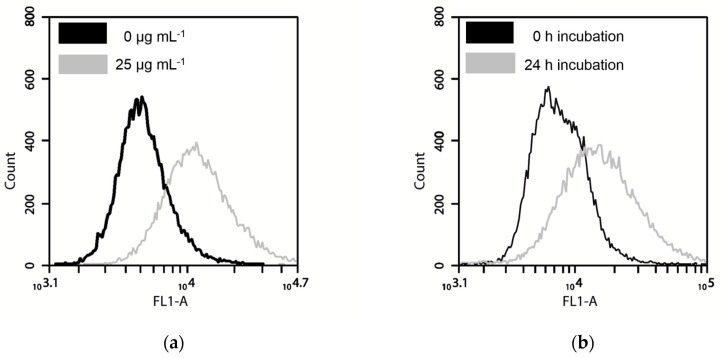
Figure 5.
Fluorescence signal of A549 and NIH/3T3 cells. (a) Histogram of fluorescence signal with 0 µg mL−1 and 25 µg mL−1 TiO2 NPs (NIH/3T3); (b) Histogram of fluorescence signal after 0 h and 24 h incubation with 12.5 µg mL−1 FITC-TiO2 NPs (NIH/3T3); (c) Fluorescence signal after incubation with different FITC-TiO2 NP concentrations for 24 h; (d) Uptake kinetic of FITC-TiO2 NPs with 12.5 µg·mL−1, signal has been normalized to control (cells without NPs).


