

Abstract
Background
Nonlinear frequency compression (NFC) can improve the audibility of high frequency sounds by lowering them to a frequency where audibility is better; however, this lowering results in spectral distortion. Consequently, performance is a combination of the effects of increased access to high frequency sounds and the detrimental effects of spectral distortion. Previous work has demonstrated positive benefits of NFC on speech recognition when NFC is set to improve audibility while minimizing distortion. However, the extent to which NFC impacts listening effort is not well understood, especially for children with hearing loss.
Purpose
To examine the impact of NFC on recognition and listening effort for speech in adults and children with hearing loss.
Research Design
Within-subject, quasi-experimental study. Participants listened to amplified nonsense words that were 1) frequency-lowered using NFC, 2) low-pass filtered at 5 kHz to simulate the restricted bandwidth (RBW) of conventional hearing aid processing, or 3) low-pass filtered at 10 kHz to simulate extended bandwidth (EBW) amplification. Participants were blinded to the type of processing. Participants’ responses to each nonsense word were analyzed for accuracy and verbal response time (listening effort).
Study Sample
Fourteen children (8–16 years) and 14 adults (19–65 years) with mild-to-severe sensorineural hearing loss.
Intervention
Participants listened to speech processed by a hearing aid simulator that amplified input signals to fit a prescriptive target fitting procedure.
Results
Both the children and adults identified the nonsense words and initial consonants better with EBW and NFC than with RBW. The type of processing did not affect the identification of the vowels or final consonants. There was no effect of age for recognition of the nonsense words, initial consonants, medial vowels or final consonants. Verbal response time did not change significantly with the type of processing or age.
Conclusion
Both the adults and children demonstrated improved speech recognition with access to the high-frequency sounds in speech. Listening effort as measured by verbal response time was not affected by access to high-frequency sounds.
Keywords: Hearing aids and assistive listening devices, Auditory rehabilitation, Pediatric audiology, Speech perception, Frequency lowering
Purpose
The loss of high-frequency audibility contributes to poorer speech recognition and increased listening effort in listeners with sensorineural hearing loss (SNHL) compared to listeners with normal hearing (NH) (Hicks and Tharpe 2002; Rakerd et al, 1996; Stelmachowicz et al, 2001). The limited high-frequency gain available in hearing aids (5–6 kHz: Dillon et al, 2001), herein referred to as restricted bandwidth (RBW), combined with the drop in speech level and increased hearing loss with higher frequencies means that listeners with SNHL still may exhibit poorer audibility in the higher frequencies despite using amplification (Kimlinger et al, 2015). Poor high-frequency audibility is more problematic for children than for adults because children require greater audibility of high-frequency sounds than adults in order to obtain equivalent speech recognition (Stelmachowicz et al, 2001, 2007). Nonlinear frequency compression (NFC) recodes high-frequency sounds at lower frequencies, where better audibility of speech can be achieved; however, this lowering results in spectral distortion (McDermott, 2011) which may limit the benefit of NFC. The goal of this research was to examine the influence of access to high-frequency speech sounds via extended bandwidth (EBW) and NFC and of age (children vs. adults) on speech recognition and listening effort. Understanding the influence of NFC and EBW on speech recognition and listening effort in children and adults could impact treatment approaches towards both age groups.
Speech Recognition
Findings are mixed on the effect of NFC relative to RBW on speech recognition and potential relationships are complex (Alexander, 2013; Alexander et al, 2014; Arehart et al, 2013; Bentler et al, 2014; Ching et al, 2013; Ellis & Munro, 2015; Glista et al, 2009; Glista et al, 2012; Hopkins et al, 2014; John et al, 2014; Kokx-Ryan et al, 2015; McCreery et al, 2013, 2014; Picou et al, 2015; Simpson et al, 2005, 2006; Souza et al, 2013; Wolfe et al, 2010, 2011, 2015). In general, benefit from NFC is better when access to high frequency sounds is increased with NFC (McCreery et al, 2013, 2014) but spectral distortion is minimized (Souza et al, 2013) as well as in listeners with greater high-frequency hearing loss (Brennan et al, 2014; Glista et al, 2009; Souza et al, 2013; but see Kokx-Ryan et al, 2015). Benefit is more likely to occur for stimuli where high-frequency audibility contributes to recognition (Hopkins et al, 2014; Kokx-Ryan et al, 2015; Wolfe et al, 2010, 2011), with decreases in recognition sometimes occurring for specific consonants or vowels (Alexander 2016; Kokx-Ryan et al, 2015). Lastly, individual variability in the ability to utilize the frequency-compressed information (Arehart et al, 2013; Ellis & Munro 2015; Glista et al, 2009; Souza et al, 2013) and acclimatization (Dickinson et al, 2014; Glista et al, 2012; Hopkins et al, 2014; Wolfe et al, 2011) may have also contributed to disparate findings across studies.
Similar to NFC, findings are mixed on the benefit of extending the bandwidth of amplification (EBW) beyond that traditionally available with hearing-aid amplification (i.e. RBW). Increasing the bandwidth of amplification has been found to improve speech recognition for both children and adults with SNHL (Ching et al, 1998; Hornsby et al, 2011; Stelmachowicz et al, 2001, 2007), however the benefit of EBW can be reduced in listeners with greater high-frequency hearing loss (Ching et al, 1998; Hogan and Turner, 1998; Turner and Cummings, 1999; Ching et al, 2001).
Experience with amplification may also contribute to benefit from NFC and EBW for both children and adults. Children who are identified and treated with amplification at a younger age experience better outcomes, than children identified at an older age (McCreery et al, 2015; Tomblin et al, 2015). Children with greater hearing aid use show better speech recognition than their peers with less hearing aid use, when controlling for degree of hearing loss (McCreery et al, 2015). Due to their greater experience with amplification, it might be expected that children who are fit with amplification at a younger age or those with greater hearing-aid use benefit more from the provision of high-frequency amplification. Adults with greater hearing-aid use might also be expected to benefit more from the provision of high-frequency amplification due to acclimation (e.g. Glista et al, 2012).
Listening Effort
Listening effort refers to the cognitive energy required to understand speech (Pichora-Fuller et al, 2016). Consistent with Kahneman’s limited capacity model of cognitive effort, adults and children with SNHL may devote more listening effort to understanding speech than listeners with NH (Hicks and Tharpe, 2002; Rakerd et al, 1996; but see Ohlenforst et al, 2017). Consequently, less cognitive capacity may be available for other tasks such as word learning (Pittman, 2008) and over the course of a day increased listening effort may lead to greater fatigue in children (Hornsby et al, 2014). Because hearing aids are the most common rehabilitative device for individuals with SNHL, understanding the effects of amplification on listening effort is critical to developing methods of signal processing that improve speech understanding, increase word learning, and reduce fatigue by reducing listening effort.
Compared to a condition without amplification, hearing aids can reduce listening effort in adults (Downs, 1982; Gatehouse and Gordon, 1990; Humes, 1999; Picou et al, 2005; Hornsby, 2013; but see Ohlenforst et al, 2017). Reductions in listening effort have been measured across different types of hearing aid signal processing, including noise reduction (Desjardins et al, 2014; Gustafson et al, 2014; Sarampalis et al, 2009; but see Alcántara et al, 2003; Brons et al, 2013) and spectral enhancement (Baer et al, 1993). However, despite the importance of high-frequency audibility for speech recognition (Stelmachowicz et al, 2001; 2007), Stelmachowicz et al. (2007) found that, compared to RBW, EBW did not decrease listening effort for a dual-task paradigm for children with and without hearing loss. The authors argued that the change in bandwidth was sufficient to improve the perception of words but not large enough to reduce listening effort. A potential limitation of that study was that the younger children might not have been able to direct attention towards the primary task (Choi et al, 2008), which would have limited the impact of bandwidth manipulations on the allocation of cognitive resources. Behavioral estimates of listening effort have included dual-task paradigms, verbal-response times, and self-reported ratings (e.g. Humes et al, 1999; Lewis et al, 2016; Norman & Bobrow, 1975; Stelmachowicz et al, 2007). For verbal response time measures, listening effort is defined as the time between the speech onset or offset and the response onset. A shorter response time is assumed to reflect a high-quality speech signal, thus requiring fewer resources—i.e. less listening effort. A longer response time is assumed to reflect a low-quality speech signal, requiring more resources and resulting in greater listening effort (Norman & Bobrow, 1975; Pisoni et al, 1987; Houben et al, 2013; McCreery and Stelmachowicz, 2013; Gustafson et al, 2014; Lewis et al, 2016). There is, however, some disagreement on the nature of the relationship of verbal processing time to listening effort. For example, McGarrigle et al (2014) suggested that a low-quality signal might cause individuals to respond more quickly as a result of more focused attention (also see Pichora-Fuller et al, 2016).
When measured by verbal response time, listening effort increases as the signal-to-noise ratio (SNR) and/or audible bandwidth decrease (Lewis et al, 2016; McCreery and Stelmachowicz, 2013). Although McCreery and Stelmachowicz showed that verbal response time increased as high-frequency audibility decreased, the effects of frequency lowering on listening effort have not been well documented in the literature. Both the extent to which NFC improves high-frequency audibility and introduces distortion likely impact the amount of listening effort exerted by a listener when using NFC. One hypothesis is that NFC might decrease listening effort because of increased audibility (McCreery et al, 2014). An alternative hypothesis is that increased listening effort from the distortion created by NFC (Arehart et al, 2013) could counteract decreases in listening effort resulting from improvements in audibility. In regards to speech recognition, benefit appears to be maximized when the maximum audible input frequency is set to each listener’s maximum audible output frequency (McCreery et al, 2013). This procedure is currently used in clinical settings and has been previously documented to minimize distortion introduced by NFC (Alexander, 2013). However, the extent to which this fitting procedure influences listening effort is unknown. Kokx-Ryan et al. (2015) compared the effect of NFC versus no NFC on listening effort in adults with SNHL. NFC was set using three settings that varied in strength; audibility was not quantified. There was no difference in listening effort between NFC on and off for either speech in quiet or in noise when measured using a dual-task paradigm.
The current study builds upon previous work by examining the effects of NFC on speech recognition and verbal response time measured in a group of children and adults. NFC was compared to a condition that simulated the bandwidth in a typical hearing aid (5 kHz, RBW) and to a condition with an extended bandwidth (10 kHz, EBW). NFC was set using a procedure that maps the maximum audible input frequency with NFC to each listener’s maximum audible output frequency with a traditional hearing aid (RBW). Speech stimuli consisted of consonant-vowel-consonant nonsense syllables with high-frequency consonants. Previous work has demonstrated that forward masking is greater than backward masking (e.g. Buss et al, 1999), consequently we hypothesized that the benefit of high-frequency audibility might be less for the final than initial consonants. By using a fitting procedure that potentially minimized the negative effects of distortion (Alexander 2013), it was hypothesized that NFC might be beneficial compared to RBW because of increased audibility. Due to increased high-frequency audibility, listening effort was hypothesized to be lower with EBW compared to RBW. For speech recognition, we hypothesized that nonsense syllable recognition would be better for conditions with greater high-frequency audibility (EBW, NFC) than a condition with lower high-frequency audibility (RBW)—with benefit being greater for EBW than NFC, due to less distortion. For equivalent speech recognition, children require greater audibility of high frequency sounds than adults (e.g. Stelmachowicz et al, 2001); consequently, we hypothesized that children would benefit more from the provision of high-frequency speech sounds (EBW and NFC) than adults. Because other studies have documented changes in the recognition of specific consonants (Kokx-Ryan et al, 2015) and vowels (Alexander, 2016) with NFC, we also examined the recognition of the individual consonants and vowels across the three bandwidth conditions. Lastly, we examined the potential contribution of degree of high-frequency hearing loss, age at which hearing-loss was identified, age of amplification, and hearing-aid use to benefit with NFC and EBW.
METHOD
Participants
This study was approved by the Institutional Review Board (IRB) for Boys Town National Research Hospital and assent or consent was obtained for all participants. Children and adults were paid $15 per hour for their participation. The children also received a book at the completion of the study. Using G*Power (v3.1) we estimated that an effect size (ηp2) of 0.05 would be detectable when 29 participants were tested (power = 80%, α = 0.05, number of groups = 2, number of measurements = 3, correlation among repeated measures = .5, non-sphericity correction = 1). The number of measurements corresponded to the number of processing conditions tested. An effect size was not estimated for the linear mixed models (for limitations of power analyses see—for example—Lenth 2001). Fourteen children (mean 11 yr, median 11 yr, range 7–16 yr) with SNHL and 16 adults (mean: 54 yr, median: 59 yr, range: 19–65 yr) with SNHL were recruited. One adult was subsequently excluded due to abnormally poor nonsense word identification (scores >3.4 standard deviations below the mean for the adult participants). All testing took place inside a doubled-walled sound booth. Additional equipment and standardized tests used in the completion of this project are listed in Table 1. Children’s speech articulation accuracy and expressive vocabulary were screened using the Goldman Fristoe Test of Articulation-2 and the Expressive Vocabulary Test-A, respectively. Children were required to have scores within 2 SD of the normative mean for their age to be included. Using this criterion for both tests, none of the children were excluded. All of the children used spoken English as their primary communication mode. Except for one child who did not wear amplification, all of the children wore bilateral hearing aids. The children who used amplification wore their hearing aids an average of 11 hours per day. Additional demographic information for the children is shown in Table 2. Five of the adults wore hearing aids (4 bilateral, 1 monaural) for an average of 12 hours per day. Two had hearing aids with NFC activated. Parents were asked if they had additional learning or language concerns for their children—none had additional concerns. Participants’ hearing thresholds were tested (ASHA 2005) and are plotted in Figure 1.
Table 1.
The equipment and software used in this study.
| Equipment | Model | Company | Location |
|---|---|---|---|
| Articulation Test | Goldman Fristoe Test of Articulation-2 | Pearson Education Inc | San Antonio, TX |
| Vocabulary Test | Expressive Vocabulary Test-A | Pearson Education Inc | San Antonio, TX |
| Computer | PC | Dell | Round Rock, TX |
| Headphones | HD-25 | Sennheiser | Wedemark, Germany |
| 2-cc Coupler | IEC 711 | Larson Davis | Provo. UT |
| Manikin | Knowles Electronic Manikin for Research | Knowles Electronics | Itasca, IL |
| Soundcard | Lynx Two B | Lynx Studio Technology | Costa Mesa, CA |
| Sound Mixer | MiniMon Mon800 | Behringer | Kirchardt, Germany |
| Headphone Amplifier | HP4 | PreSonus | Baton Rouge, LA |
| 6-cc coupler | System AEC101 | Larson Davis | Provo, Utah |
| Boom Microphone | Beta 53 | Shure | Chicago, IL |
| Video Recorder | Vixia R21 HD CMOS | Canon | Melville, NY |
| Video Software | Debut Video Capture | NCH Software | Greenwood Village, CO |
| Sound Level Meter | System 824 | Larson Davis | Provo, UT |
Table 2.
Demographic information for the child participants. Participant 1 did not wear hearing aids and information in columns 2–4 was missing for subject 6. Age ID = age in years at which each child was identified with hearing loss. Age Amp = age in years at which each child started wearing amplification. R/L/B = right, left or binaural amplification. Mean hours per day is the average hearing aid use per day. For the NFC column, Y indicates the child used amplification with NFC activated, N that the child did not. FM = frequency-modulated remote microphone hearing assistance technology use in school. NA = not available. SLP = speech-language therapy.
| Participant Number | Age ID | Age Amp | R/L/B | NFC | Mean hours per day | support services |
|---|---|---|---|---|---|---|
| 1 | 1 | NA | B | NA | 0 | N |
| 2 | 0 | 3 | B | Y | 5.7 | N |
| 3 | 4 | 4 | B | Y | 10.3 | N |
| 4 | 2 | 2 | B | Y | 12 | FM |
| 5 | 0 | 2.5 | B | N | 5.0 | FM |
| 6 | NA | NA | NA | N | 5.0 | FM/SLP |
| 7 | 3 | 3 | B | N | 14.0 | FM |
| 8 | 2.5 | 2.5 | B | Y | 12.0 | FM/SLP |
| 9 | 0 | 7 | B | Y | 9.3 | FM/SLP |
| 10 | 4 | 4 | B | N | 14.0 | FM |
| 11 | 4 | 4 | B | N | 12.7 | FM |
| 12 | 0 | 0.25 | B | N | 13.6 | N |
| 13 | 0 | 3 | B | N | 24.0 | N |
| 14 | 4 | 5 | B | N | 5.7 | FM |
|
| ||||||
| Mean | 2.42 | 3.94 | 10.5 | |||
Figure 1.
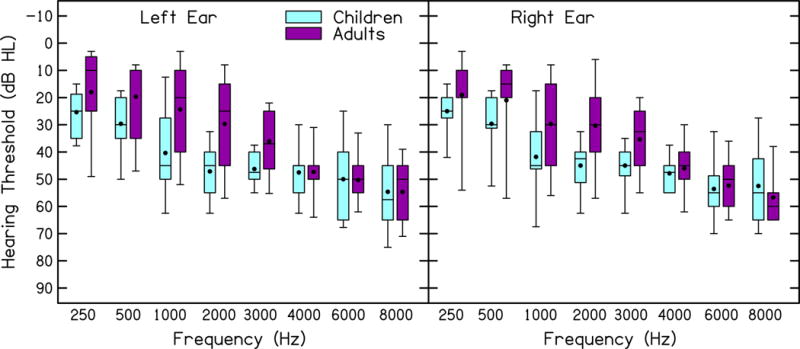
Hearing thresholds (dB HL) for children and adults. Left and right ears are shown in the left and right panels, respectively. Box boundaries represent the 25th and 75th percentiles, error bars represent the 10th and 90th percentiles, horizontal lines represent the medians, and filled circles represent the means.
Stimuli
Stimuli were 310 consonant-vowel-consonant nonsense words that had a phonotactic probability within 1 standard deviation of the mean probability split of the nonsense words in McCreery & Stelmachowicz (2011). Phonotactic probability refers to the frequency with which phonological sequences occur in a given position for words in a language and was computed as the biphone sum (consonant-vowel, vowel-consonant) using a phonotactic probability calculator (Storkel & Hoover, 2010). The stimuli were spoken by a 22-year-old female from the Midwest. Consonants were the fricatives, stops, affricates, and nasals /b/, /ʧ/, /d/, /ð/, /f/, /g/, /ŋ/, /ʤ/, /k/, /m/, /n/, /p/, /s/, /ʃ/, /t/, /θ/, /v/, /z/. Vowels consisted of: /a/, /e/, /u/, /o/, and /æ/. The nonsense words were split into 3 lists of 100 nonsense words and a practice list of 10 nonsense words. Table 3 lists the number of consonants per list.
Table 3.
Number of consonants per list.
| Initial Consonants | |||||||||||||||||||||||||||||||||||
|---|---|---|---|---|---|---|---|---|---|---|---|---|---|---|---|---|---|---|---|---|---|---|---|---|---|---|---|---|---|---|---|---|---|---|---|
|
| |||||||||||||||||||||||||||||||||||
| List | b | ʧ | d | ð | f | g | ŋ | ʤ | k | m | n | p | s | ʃ | t | θ | v | z | |||||||||||||||||
| 1 | 7 | 8 | 11 | 5 | 5 | 7 | 0 | 5 | 6 | 2 | 5 | 6 | 4 | 6 | 10 | 5 | 4 | 4 | |||||||||||||||||
| 2 | 4 | 8 | 2 | 5 | 5 | 7 | 0 | 5 | 5 | 17 | 9 | 3 | 5 | 6 | 6 | 5 | 4 | 4 | |||||||||||||||||
| 3 | 7 | 7 | 13 | 5 | 5 | 3 | 0 | 5 | 0 | 8 | 7 | 7 | 5 | 6 | 10 | 4 | 4 | 4 | |||||||||||||||||
| Total | 18 | 23 | 26 | 15 | 15 | 17 | 0 | 15 | 11 | 27 | 21 | 16 | 14 | 18 | 26 | 14 | 12 | 12 | |||||||||||||||||
| Final Consonants | |||||||||||||||||||||||||||||||||||
|
| |||||||||||||||||||||||||||||||||||
| 1 | 6 | 5 | 5 | 5 | 8 | 4 | 1 | 4 | 4 | 8 | 4 | 8 | 6 | 7 | 6 | 6 | 8 | 5 | |||||||||||||||||
| 2 | 9 | 4 | 6 | 4 | 8 | 3 | 2 | 5 | 6 | 5 | 5 | 7 | 6 | 8 | 4 | 6 | 7 | 5 | |||||||||||||||||
| 3 | 6 | 5 | 6 | 5 | 9 | 3 | 2 | 4 | 4 | 5 | 3 | 9 | 6 | 7 | 7 | 7 | 7 | 5 | |||||||||||||||||
| Total | 21 | 14 | 17 | 14 | 25 | 10 | 5 | 13 | 14 | 18 | 12 | 24 | 18 | 22 | 17 | 19 | 22 | 15 | |||||||||||||||||
Amplification
The hearing aid simulator consisted of NFC, filter bank analysis, wide dynamic range compression (WDRC), channel-specific output-limiting compression, and broadband output-limiting compression. The simulator was implemented in MATLAB (R2009b) (The MathWorks, Natick, Massachusetts) as described in detail by Alexander and Masterson (2015) and by McCreery et al. (2013). The output-limiting compression circuits used a 1-ms attack time, 50-ms release time, 10:1 compression ratio, and frequency-specific compression thresholds that were prescribed by DSL (Scollie et al, 2005) or 105 dB SPL, whichever was lower. The WDRC circuit used a 5-ms attack time and 50-ms release time. The WDRC ratios and compression thresholds were those prescribed by DSL for each participant, with linear amplification below the compression thresholds. The filter bank consisted of eight one-third octave-band filters with center frequencies spaced between .25 and 6.3 kHz. The NFC circuit used an algorithm described by Simpson et al. (2005) and others (Alexander, 2016; Brennan et al, 2014; McCreery et al, 2013, 2014).
The hearing aid simulator was programmed individually for each ear and participant to simulate three amplification conditions: RBW (5 kHz filter cutoff frequency), EBW (10 kHz filter cutoff frequency) and NFC (10 kHz maximum input frequency). Starting with EBW, the simulator set gain to meet DSL adult and DSL child prescriptive targets (Scollie et al, 2005) for the adult and child participants, respectively. Using the headphones for this study, a KEMAR transfer function was derived by comparing the output levels for pure-tones at the octave and inter-octave frequencies from 250 to 8000 Hz in a 2-cc coupler to that in an IEC 711 Zwislocki Coupler and KEMAR. Output levels were then simulated by measuring the root-mean-squared output for speech using the Carrot Passage from Audioscan (Dorchester, ON) presented at 60 dB SPL, filtered using one-third octave-wide filters (ANSI, 2004) and then adjusted to within 5 dB of the prescribed target. Minimum gain was limited to 0 dB after accounting for the KEMAR transfer function. To prevent overdriving the headphones, maximum gain was limited to 65 dB. A 1024-tap low-pass filter was applied at 5000 Hz that reduced the output by 80 dB at 5500 Hz to create the RBW amplification condition.
NFC settings were selected that would map the maximum audible input frequency (10 kHz) to the maximum audible output frequency of the RBW condition (5 kHz) by using the Sound-Recover Fitting Assistant v1.10 (Joshua Alexander, Purdue University, West Lafayette, IN). Using this method to fit NFC has been documented to improve speech recognition (McCreery et al, 2013, 2014) compared to a RBW condition. The available start frequencies and compression ratios in the hearing-aid simulator were limited to those available in the Phonak Fitting Software at the time this study was completed plus one intermediate setting (start frequency = 2700, compression ratio = 2.3). The maximum audible input frequency with NFC was 8240 Hz for all participants (maximum audible output frequency = 5 kHz, start frequency = 3.8 kHz, compression ratio = 2.6), except two participants who had a maximum audible input frequency of 6960 Hz with NFC (maximum audible output frequency = 4 kHz, start frequency = 2.7 kHz, compression ratio 2.3). More details about the NFC processing in the hearing aid simulator and the fitting method are described by Alexander (2016), Brennan et al. (2014) and McCreery et al. (2013, 2014).
Audibility was assessed by computing the Speech Intelligibility Index (SII) with RBW and EBW and a modified version of the SII for computing audibility with NFC (SII-NFC) (McCreery et al, 2014). The SPL for frequency bands one-third octave wide (ANSI, 2004) were computed for each fricative and vowel. Participant thresholds were interpolated to the center frequencies for the one-third octave filters (Pittman & Stelmachowicz, 2000), converted to dB SPL (Bentler & Pavlovic, 1989), adjusted to account for the internal noise spectrum (ANSI, 1997) and transformed to one-third octave band levels (Pavlovic, 1987). SII was then computed using the ANSI one-third octave band SII procedure with the importance weights for nonsense words (ANSI 1997).
Procedure
Stimuli were presented at 60 dB SPL to the input of the hearing aid simulator, converted from a digital to analog signal using a sound card, routed to a sound mixer, amplified with a headphone amplifier, and presented binaurally via headphones. The presentation level was calibrated to a 1-kHz pure tone using a Larson David System 824 sound level meter and headphones attached to a 6-cc coupler. Participants wore a head-worn boom microphone and were seated in a sound booth in front of a table with a video recorder. Participants were instructed to repeat back the “made-up words”. In order to maintain attention, pictures of animals were displayed on a monitor after each trial. If the examiner judged the response to be unclear, the participant was instructed to repeat back what they said. Participant responses were video and audio recorded for off-line analysis. The video signal was converted to a digital signal using Debut Video Capture and saved as MPEG-4 files at 640×480 resolution and 30 frames per second. The audio signal from the microphone was converted from an analog to digital signal at a 44.1 kHz sampling rate and with 32-bit depth. The word lists and processing conditions were counterbalanced using a Graeco-Latin square design with random presentation of stimuli within the word lists. Data presentation and collection were conducted using custom software written at Boys Town National Research Hospital.
Scoring
Three raters (1 undergraduate student, 2 audiologists) transcribed and scored (correct/incorrect) the nonsense word, initial consonants, medial vowels, and final consonants and time marked the onset (ms) of the participant responses for each nonsense word. Responses for blends (i.e. /ts/ instead of /s/) were scored as incorrect. If the participant uttered two responses, the rater used the second response. Verbal response time was measured as the time between the onset of the stimulus and the onset of the response for each token and was initially calculated using a PRAAT script (Ver.5.3.51; Boersma & Weeink, 2013). The onset of all responses selected by the software was reviewed and remarked if necessary by the raters. The raters judged the onset of the response based on the waveform, spectrogram and audio playback. Speech fillers such as “umm” and “uh”, false starts, stutters, and non-speech sounds (breathing, yawns, etc.) that occurred before the nonsense word was spoken were not included when marking the response. Verbal response time was not measured for responses during which the listener began to speak before the end of the stimulus. All three raters scored participant responses and verbal response time for two participants. For the nonsense words, the Cohen’s Kappa for scoring among the three reviewers was between .89 to .92. For verbal processing time, Pearson’s r was between .88 to .98. Given the excellent inter-rater reliability (Landis & Koch, 1977) for these two participants, only a single rater (i.e. the same rater) scored responses and measured verbal response time for the remainder of the participantsi. For trials in which that rater was uncertain, a second rater scored the trial. If the two raters disagreed about any position (initial, vowel, final) in the scoring of the nonword, a third rater scored the response. In cases where a third rater was required, the response for which two raters agreed was accepted as the score. If there was disagreement between two scorers in verbal response time by more than 50 ms, a third rater also judged the response time for that trial. The final response time was taken as the average of the two response times that were within 50 ms of each otherii. VRTs greater than 2 seconds were excluded as being outlier responses (Ratcliff 1993). The shortest reaction time was 531 ms, consequently none of the reaction times were considered for removal due to being fast guesses (<200 ms: Whelan 2008).
RESULTS
Speech Recognition
Figure 2 depicts the proportion of correctly identified nonsense words (i.e. whole-word scoring), and initial consonants, medial vowels and final consonants within each nonsense word. Because of the lack of variance, medial vowels were not included in the following statistical analysis. A multivariate analysis of variance (MANOVA) was completed using within-subject factors of measure (whole words, initial consonants, final consonants) and processing (RBW, EBW, NFC) and a between-subject factor of age (child, adult). This analysis is shown in Table 4. Multivariate effects of processing on proportion correct were significant. Neither age nor the interaction of processing and age were statistically significant. As shown in Table 4, univariate effects of processing for the identification of the nonsense words and initial consonants were significant, but the effect of processing on final consonants was not significant. Post-hoc testing using Tukey’s test of honestly significant difference (HSD = 0.028) showed that the identification of nonsense words was significantly better with EBW (M = .695, SE = .014) and NFC (M = .706, SE = .011) than with RBW (M = .664, SE = .014) but was not statistically different for EBW versus NFC. Similarly, the identification of initial consonants (HSD = .016) was significantly better with EBW (M = .864, SE = .008) and NFC (M = .877, SE = .006) than with RBW (M = .847, SE = .008) but not for EBW versus NFC. These results demonstrated that the adults and children identified the nonsense words and initial consonants better when high-frequency audibility was increased with EBW or NFC compared to a condition with less high-frequency audibility (RBW). The type of processing did not affect the identification of vowels or final consonants.
Figure 2.
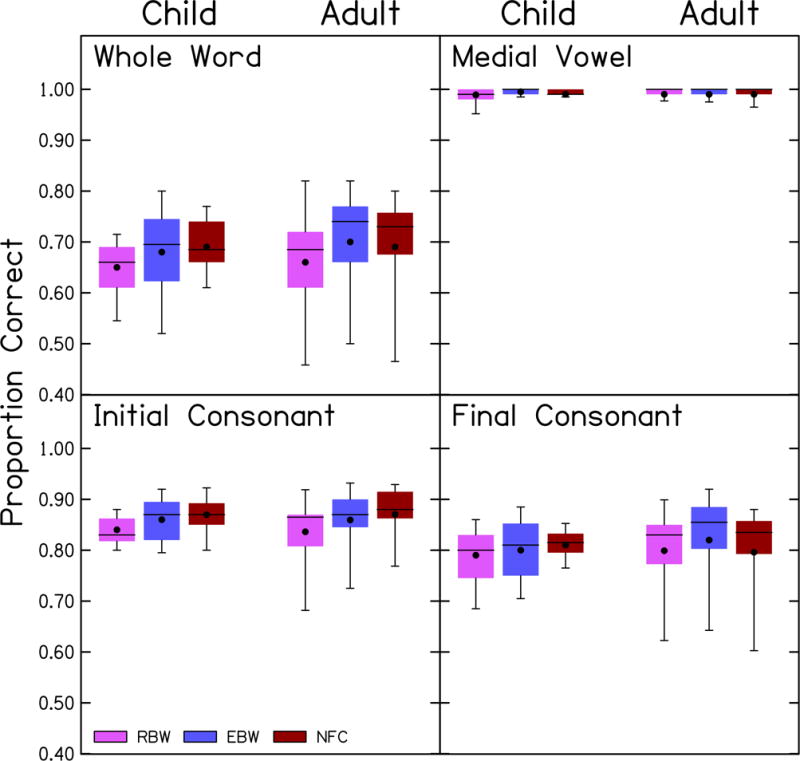
Proportion correct identification for each processing condition in children and adults. The measure depicted is indicated in each panel. Box boundaries represent the 25th and 75th percentiles, error bars represent the 10th and 90th percentiles, horizontal lines represent the medians, and filled circles represent the means.
Table 4.
Multivariate analysis of variance for repeated measures (MANOVA) for proportion correct identification. λ=Wilks’s Lambda.
| Multivariate Analysis | λ | df | F | p | ηp2 |
|---|---|---|---|---|---|
| Processing | .539 | 6,22 | 3.1 | .022 | 0.461 |
| Age | .797 | 3,25 | 2.1 | .124 | 0.203 |
| Processing × Age | .671 | 6,22 | 1.8 | .146 | 0.329 |
| Univariate analysis | |||||
|
| |||||
| Processing – whole-word scoring | 2,54 | 7.0 | .002 | 0.206 | |
| Processing – initial consonants | 2,54 | 10.1 | <.001 | 0.272 | |
| Processing – final consonants | 2,54 | 1.3 | .276 | 0.047 | |
Figure 3 displays the proportion correct for each consonant, collapsed across the two age groups due to the lack of a significant difference in the previous analyses. Performance was higher for the nasals, affricates and stops than for the fricatives, which is similar to the pattern identified by Alexander (2016) for consonants in the medial position. Two repeated-measures ANOVAs, one each for initial and final consonants, were completed using within-subject factors of consonant and processing. This analysis is shown in Table 5. For the initial consonants, /k/ was excluded because this token was absent from one of the three lists (i.e. it was not presented to several participants in the initial position). For the initial consonants, there were significant effects of processing and consonant, and a significant interaction of the consonant with processing. The minimum significant difference using Tukey’s HSD was 0.131. The recognition of /s/ and /z/ was significantly better with EBW than RBW and with NFC than RBW. No other consonants were significantly different between the three processing conditions. For the final consonants, the effect of processing was not significant. The effect of the consonant and the interaction of processing and consonant were statistically significant. The minimum significant difference using Tukey’s HSD was 0.249. Despite the significant interaction, none of the consonants were significantly different with post-hoc testing between the three processing conditions. The largest improvements in phoneme recognition between EBW and RBW were with /s/ (0.21) and /z/ (0.23). Similarly, the largest improvements in phoneme recognition occurred with /s/ (0.18) and /z/ (0.25) from RBW to NFC processing.
Figure 3.
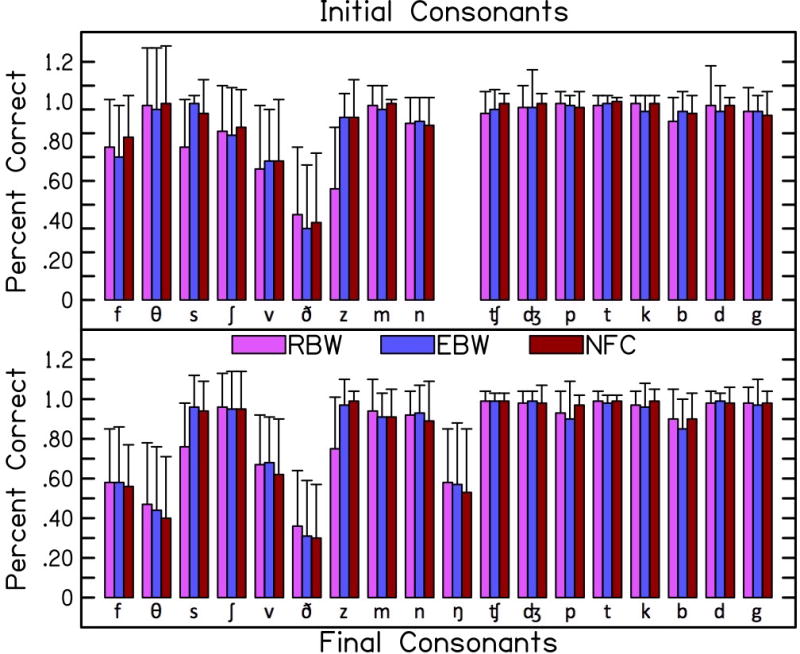
Proportion correct for each consonant in each processing condition. Initial consonants shown in the top panel and final consonants shown in the bottom panel. Arranged in order from fricatives, nasals, affricates, and stops. Within each category, voiceless is followed by voiced. Proportion correct is collapsed across the two age groups. Error bars represent one standard deviation
Table 5.
Repeated-measures ANOVAs for proportion correct identification of the initial and final consonants.
| Initial Consonants | df | F | p | ηp2 |
|---|---|---|---|---|
| Processing | 2,56 | 16.1 | <.001 | 0.364 |
| Consonant | 3.2,90.6 | 54.0 | <.001 | 0.659 |
| Processing × Consonant | 9.7,272.8 | 5.3 | <.001 | 0.159 |
| Final Consonants | ||||
|
| ||||
| Processing | 2,56 | 1.6 | .205 | 0.055 |
| Consonant | 4.7,132.3 | 63.1 | <.001 | 0.693 |
| Processing × Consonant | 10.4,293 | 2.9 | <.001 | 0.093 |
Speech Intelligibility Index
To determine if the increase in SII varied by consonant, two repeated-measures ANOVAs, one for initial consonants and another for final consonants, were completed using within-subject factors of consonant and processing. Results of this analysis are shown in Table 6. The patterns of the statistical findings were the same for initial and final consonants. There were significant main effects of processing and consonant. The interaction of processing and consonant was not statistically significant, consistent with the SII increasing by an equivalent amount for every consonant with both NFC and EBW compared to RBW.
Table 6.
Repeated-measures ANOVAs for SII with initial and final consonants. For the initial consonants, /k/ was excluded.
| Initial Consonants | df | F | p | ηp2 |
|---|---|---|---|---|
| Processing | 1.5,40.8 | 252.1 | <.001 | 0.900 |
| Consonant | 2.0,56.9 | 108.7 | <.001 | 0.795 |
| Processing × Consonant | 3.4,94.9 | 1.3 | .252 | 0.047 |
| Final Consonants | ||||
|
| ||||
| Processing | 1.6,44.2 | 232.6 | <.001 | 0.893 |
| Consonant | 2.0,55.6 | 93.4 | <.001 | 0.769 |
| Processing × Consonant | 3.3,92.1 | 1.8 | .142 | 0.061 |
Verbal Response Time
Figure 4 depicts results for the verbal response times for correct whole words. A linear mixed model with a random intercept term for each participant, as reported in Baayen and Milin (2015) and Houben et al. (2013), and processing and age as the fixed effects, was completed on verbal response time for the correct responses. The linear mixed model was completed using the R statistical package (R core team, 2016) with the linear mixed-effects 4 and lmerTest packages (Bates et al, 2015). This inclusion of random intercepts for each participant in the model allowed us to account for variability associated with differences in average response times across participants and correlations between measures from the same participants across conditions. The results for the linear mixed model are shown in Table 7. The two-way interaction of age with processing was not significant. Verbal response time did not change significantly with the type of processing or age.
Figure 4.

Verbal response time for all responses, correct responses and incorrect responses. Response times are provided for each processing condition, as depicted by the legend. Box boundaries represent the 25th and 75th percentiles, error bars represent the 10th and 90th percentiles, horizontal lines represent the medians, and filled circles represent the means.
Table 7.
Linear mixed model for verbal response time with only the correct responses. The difference column displays the beta values for the model.
| Linear mixed models | Difference (ms) | df | t | p |
|---|---|---|---|---|
| Whole Words | ||||
|
| ||||
| EBW – RBW | −22.3 | 58 | −1.18 | .242 |
| NFC – EBW | −2.0 | 58 | −0.12 | .916 |
| Adult – Child | 3.6 | 37 | 0.08 | .937 |
| EBW × Age | 9.8 | 58 | 0.36 | .719 |
| NFC × Age | 5.3 | 58 | 0.19 | .847 |
| /s/ and /z/ | ||||
|
| ||||
| EBW – RBW | −19.8 | 142 | −1.00 | 0.320 |
| NFC – RBW | 13.3 | 142 | 0.67 | 0.503 |
| consonant (/z/ - /s/) | −20.6 | 142 | −1.00 | 0.317 |
| EBW × consonant | −9.7 | 142 | −0.34 | 0.735 |
| NFC × consonant | −33.3 | 142 | −1.16 | 0.246 |
The largest improvements in consonant recognition occurred for /s/ and /z/. VRT for these consonants were compared across processing conditions using a linear mixed model, shown in Table 7, with a random intercept term for each participant. None of the main effects or interactions were statistically significant, suggesting that VRT did not vary across the three processing conditions for /s/ and /z/.
Prediction of Benefit from High-Frequency Amplification
To assess the benefit of high-frequency amplification by degree of hearing loss, benefit was calculated by subtracting the proportion correct nonsense word recognition for RBW from proportion correct for EBW and for NFC. Likewise, differences in verbal response time were calculated by subtracting verbal response time for EBW and NFC from RBW. High-frequency pure-tone average thresholds (PTA: 2, 4 and 6 kHz) were computed because previous research (Brennan et al, 2014) found that preference for NFC could be partially explained by this measure of PTA. The benefit of high-frequency amplification was then plotted against PTA, as shown in Figure 5. In this figure, values above 0 indicate that performance was better with EBW (left column) or NFC (right column) than with RBW. In general, participants with a better (lower) PTA demonstrated a larger benefit for nonsense word recognition from the provision of EBW or NFC compared to RBW. However, one participant with a low PTA (36 dB HL) did not benefit from the provision of NFC and instead showed a .10-point decrement in performance. Because this participant showed a different pattern than all other participants, we conducted an analysis with and without this data point. Specifically, the effect of PTA on speech recognition and verbal response time with high-frequency amplification was evaluated using a mixed linear model (Table 8) —with the same software and package described earlier. With the outlier, adults and children with less severe high-frequency hearing loss (lower PTA) showed significantly more benefit for nonsense word recognition with EBW than those with greater hearing loss—but not for NFC. Without the outlier, participants with lower PTA showed significantly more benefit for nonsense word recognition with both EBW and NFC. PTA did not significantly predict verbal response time.
Figure 5.
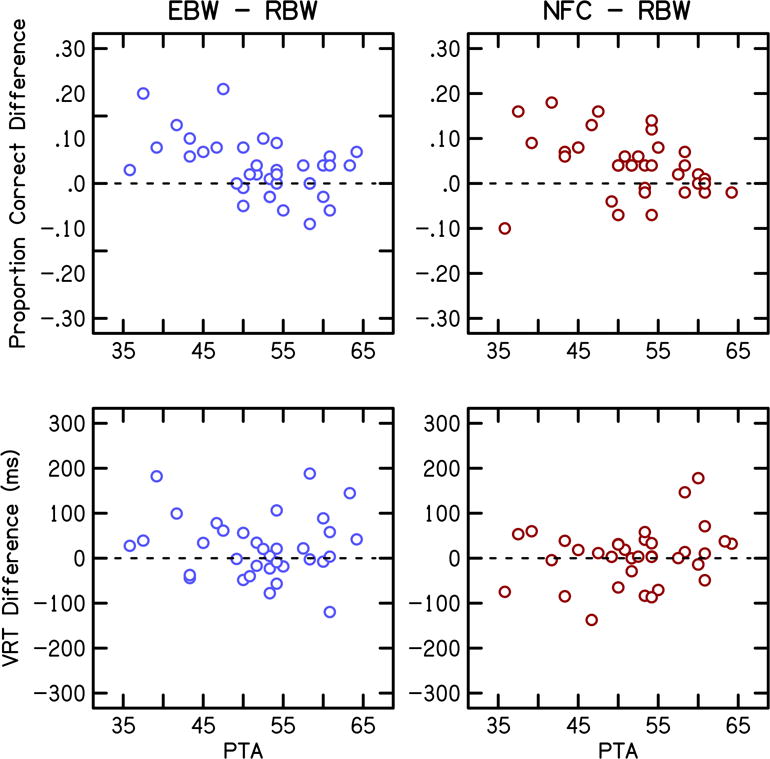
Benefit of high-frequency amplification by degree of hearing loss. EBW minus RBW shown in the left column and NFC minus RBW shown in the right column. Benefit for nonsense word recognition and verbal response time is shown in the top and bottom rows, respectively.
Table 8.
Linear mixed model for benefit of high-frequency amplification for nonsense word recognition and verbal response time. The difference column displays the beta values for the model.
| Linear mixed model Nonsense word recognition with outlier | Difference (proportion correct) | df | t | p |
|---|---|---|---|---|
| EBW – RBW | .22 | 54 | 2.36 | .022 |
| NFC – RBW | .15 | 54 | 1.67 | .099 |
| PTA | −.002 | 45 | −0.92 | .362 |
| EBW × PTA | −.0035 | 54 | −2.02 | .048 |
| NFC × PTA | −.0021 | 54 | −1.23 | .225 |
| Nonsense word recognition without outlier | ||||
|
| ||||
| EBW - RBW | .268 | 52 | 2.84 | .006 |
| NFC – RBW | .313 | 52 | 3.31 | .002 |
| PTA | <−.001 | 39 | −0.28 | .781 |
| EBW × PTA | −.005 | 52 | −2.52 | .015 |
| NFC × PTA | −.005 | 52 | −2.83 | .007 |
| Verbal reaction time | ||||
|
| ||||
| EBW – RBW | −107.0 | 54 | −1.00 | .321 |
| NFC – RBW | 133.6 | 54 | 1.25 | .216 |
| PTA | −2.3 | 34 | −0.66 | .515 |
| EBW × PTA | 1.7 | 54 | 0.84 | .402 |
| NFC × PTA | −2.6 | 54 | −1.25 | .214 |
As an exploratory analysis, additional potential predictor variables (age of hearing loss identification, age of amplification) for the children with SNHL were assessed using bivariate correlations. None of the variables significantly predicted benefit from high frequency amplification (EBW-RBW, NFC-RBW) for word recognition or verbal response time (0.25 < p < 0.89). Lastly, hearing-aid use for children and adults as a single group, was not significantly correlated with benefit from high-frequency amplification (0.59 < p < 0.63).
DISCUSSION
Speech Recognition
For speech recognition, we hypothesized that nonsense syllable recognition would be better for conditions with greater high-frequency audibility (EBW, NFC) than a condition with lower high-frequency audibility (RBW). As shown in previous work (Glista et al, 2009; McCreery et al, 2013, 2014; Wolfe et al, 2010, 2011; Alexander et al, 2014), both EBW and NFC improved nonsense-word recognition compared to RBW. This improvement was due to better identification of the initial consonants. Recognition of vowels and final consonants did not differ across processing conditions.
The improved recognition for initial but not final consonants with EBW and NFC was possibly related to the vowel masking the final but not initial consonants (e.g. Buss et al, 1999). The improvements in audibility (SII, SII-NFC) with EBW and NFC compared to RBW were similar with each stimulus type. The largest increase in correct fricative recognition with EBW and NFC occurred for /s/ and /z/ in our study—consistent with Alexander et al. (2014), Alexander (2016) and Kokx-Ryan et al. (2015), Stelmachowicz et al. (2007) and with other studies that observed improved perception of plurals (Glista et al, 2009; 2012; Wolfe et al, 2010). The high correct recognition with RBW processing for /ʃ/ was consistent with Alexander et al. (2014) (see the top of Table II in Alexander et al.) and Hillock-Dunn et al. (2014). We also observed high correct recognition for nasals, affricates and stops for all three processing conditions. The range of degradation in perception was smaller than the range of improvement in perception, with the greatest decrements occurring for /θ/ and /ð/. Together these findings suggest that the benefit of increased audibility for nonsense words with EBW and NFC is primarily limited to the fricatives /s/ and /z/.
Alexander (2016) found that NFC decreased vowel recognition with low start frequencies (< 2.2 kHz), but was unaltered by higher start frequencies (2.8 and 4.0 kHz). Our results supported this finding because vowel recognition was uniformly high (see Figure 2) for our start frequencies which were 2.7 and 3.8 kHz. Alexander noted that the lower start frequency of 1.6 kHz with a lower compression ratio was a greater detriment to vowel perception than using a higher start frequency with a higher compression ratio and that this was likely due to shifts in the 2nd formant for vowels with the lower start frequency. By using higher start frequencies in this study, we likely avoided degraded vowel recognition due to shifts in the formant frequencies.
We observed that benefit for nonsense word recognition for EBW compared to RBW was significantly greater for those with less severe high-frequency SNHL. This finding is consistent with prior speech recognition data (Ching et al, 1998, 2001; Hogan & Turner, 1998; Turner & Cummings, 1999; Hornsby, 2011). While the same relationship was observed when NFC was compared to RBW, this relationship was only statistically significant with the removal of one outlier. Our results support the notion that listeners with greater hearing loss in the high frequencies are less able to take advantage of greater bandwidth, potentially due to factors such as dead regions (Mackersie et al, 2004 but see Cox, 2011; Preminger et al, 2005) or less contribution of audibility to speech recognition for listeners with greater hearing loss (Ching et al, 1998, 2001; Hogan & Turner, 1998; Hornsby et al, 2011). However, our data differ from Souza et al. (2013) who found that those with greater hearing loss were more likely to show improved speech recognition with NFC. One possible reason for the discrepant findings is that Souza et al. had more listeners with severe SNHL than in our study and it was the listeners with severe SNHL that showed a benefit in their study. Another possible reason is that our study fit NFC to maximize audibility while limiting the amount of distortion whereas Souza et al. systematically varied the NFC parameters (start frequency, compression ratio) to examine the influence of varying the amount of spectral distortion with NFC on speech recognition.
Listening Effort
We hypothesized that NFC compared to RBW and EBW might benefit listening effort compared to RBW because of increased access to high-frequency speech information. Due to increased high-frequency audibility, listening effort was hypothesized to be lower with EBW compared to RBW. Contrary to our hypotheses, we did not measure a significant difference in verbal response time across processing conditions or age groups. The lack of a difference in verbal response time with change in high-frequency access is consistent with Stelmachowicz et al. (2007), who found that extending the high-frequency bandwidth did not decrease listening effort for their stimuli or task and with Kokx-Ryan et al. (2015), who found that listening effort, measured in adults with SNHL using a dual-task paradigm, did not differ with NFC on or off. We have extended the findings of Kokx-Ryan and colleagues to children with SNHL. Together, these findings are consistent with a systematic review by Ohlenforst et al. (2017), which did not find sufficient evidence to support the claim that SNHL or amplification impact listening effort. However, McCreery and Stelmachowicz (2013) found that listening effort decreased as the bandwidth was increased for children with NH who were listening to speech in varying levels of noise. In addition, results from Lewis et al. (2016) suggested decreased listening effort in children with NH or mild SNHL for speech recognition tasks as SNR increased. Taken together, these studies suggest that listening effort, as measured by response time, may differ depending on experimental task as well as the population being examined.
There are several possible reasons for the lack of change in verbal response time with NFC in the current study. The benefit of increased audibility on listening effort may have been offset by the increased distortion with NFC, leading to the null effect that was observed. This explanation, however, does not seem likely since EBW also did not result in a difference in VRT. It is important to note that the NFC start frequencies and compression ratios used in this study did not result in the same amount of degradation of the signal as those used in other studies (e.g. Souza et al, 2013). Use of higher compression ratios or lower start frequencies, might have resulted in increased listening effort. Future studies may benefit from additional measures of listening effort, such as physiologically based methods (e.g. Bess et al, 2015).
Conclusions
These data suggest an improvement in initial consonant recognition for nonsense syllables when the bandwidth is extended with either EBW or NFC compared to a restricted bandwidth condition. A concurrent improvement in listening effort, as measured by verbal response time, did not occur. Both adults and children benefitted equally from high-frequency amplification with improved nonsense syllable recognition. An equivalent amount of listening effort was measured in children and adults. These findings suggest that the clinical procedure used in this study of mapping the maximum input frequency to the maximum audible output frequency is beneficial for speech recognition, without improvements or decrements in this estimate of listening effort—verbal reaction time.
Acknowledgments
We thank Brenda Hoover, Brianna Byllesby, Alex Baker and Evan Cordrey for assistance with data collection and analysis, Kanae Nishi for providing the programming to analyze verbal response time and suggestions regarding stimulus development and Emily Buss for helpful suggestions throughout the project. We especially thank Pat Stelmachowicz as the original Principal Investigator on this project. NIH funding: R01 DC04300, R01 DC013591, P20 GM109023, P20 GM10902, P30 DC-4662.
Support: NIH: R01 DC04300, R01 DC013591, P20 GM109023, P20 GM10902, P30 DC-4662
Abbreviations
- APHAB
Abbreviated Profile of Hearing Aid Benefit
- ANOVA
analysis of variance
- DSL
Desired Sensation Level
- EBW
extended bandwidth
- HL
hearing loss
- KEMAR
Knowles Electronics Manikin for Acoustic Research
- MANOVA
multivariate analysis of variance
- NFC
nonlinear frequency compression
- NH
normal hearing
- PTA
pure-tone average
- RBW
restricted bandwidth
- SII
Speech Intelligibility Index
- SL
sensation level
- SNHL
sensorineural hearing loss
- SPL
sound pressure level
- WDRC
wide dynamic range compression
Footnotes
This work was presented at the 2015 American Speech Language Hearing Association Convention, Denver, CO.
A second rater scored 10% of those subjects as a reliability check and, if there was a disagreement between rater 1 and rater 2, the third rater served as a tie-breaker. For adult subjects, 12% required a tiebreaker (the first 2 raters disagreed). For child subjects, 16% required a tiebreaker.
The first rater was unsure about 1.3% of the responses.
References
- Alcántara JL, Moore BC, Kühnel V, Launer S. Evaluation of the noise reduction system in a commercial digital hearing aid. Int J Audiol. 2003;42:34–42. doi: 10.3109/14992020309056083. [DOI] [PubMed] [Google Scholar]
- Alexander JM. Individual variability in recognition of frequency-lowered speech. Semin hear. 2013;34:86–109. [Google Scholar]
- Alexander JM, Kopun JG, Stelmachowicz PG. Effects of frequency compression and frequency transposition on fricative and affricate perception in listeners with normal hearing and mild to moderate hearing loss. Ear Hear. 2014;35:519–532. doi: 10.1097/AUD.0000000000000040. [DOI] [PMC free article] [PubMed] [Google Scholar]
- Alexander JM, Masterson K. Effects of WDRC release time and number of channels on output SNR and speech recognition. Ear Hear. 2015;36:e35–e49. doi: 10.1097/AUD.0000000000000115. [DOI] [PMC free article] [PubMed] [Google Scholar]
- Alexander JM. Nonlinear frequency compression: Influence of start frequency and input bandwidth on consonant and vowel recognition. J Acoust Soc Am. 2016;139(2):938–957. doi: 10.1121/1.4941916. [DOI] [PMC free article] [PubMed] [Google Scholar]
- American National Standards Institute (ANSI) American National Standard Methods for Calculation of the Speech Intelligibility Index. New York, NY: ANSI; 1997. ANSI S3.5-1997. [Google Scholar]
- American National Standards Institute (ANSI) Specification for Octave-Band and Fractional-Octave-Band Analog and Digital Filters. New York, NY: ANSI; 2004. ANSI S1.11-2004. [Google Scholar]
- American Speech-Language-Hearing Association (ASHA) Guidelines for manual pure-tone threshold audiometry. Rockville, MD: ASHA; 2005. [Google Scholar]
- Arehart KH, Souza P, Baca R, Kates JM. Working memory, age, and hearing loss: Susceptibility to hearing aid distortion. Ear Hear. 2013;34:251–260. doi: 10.1097/AUD.0b013e318271aa5e. [DOI] [PMC free article] [PubMed] [Google Scholar]
- Baayen RH, Milin P. Analyzing reaction times. Int J Psychol Res. 2015;3:12–28. [Google Scholar]
- Baer T, Moore BCJ, Gatehouse S. Spectral contrast enhancement of speech in noise for listeners with sensorineural hearing impairment: Effects on intelligibility, quality, and response times. J Rehabil Res Dev. 1993;30:49–49. [PubMed] [Google Scholar]
- Bates D, Maechler M, Bolker B, Walker S. Fitting linear mixed-effects models using lme4. J Stat Softw. 2015;67:1–48. [Google Scholar]
- Bentler RA, Pavlovic CV. Transfer functions and correction factors used in hearing aid evaluation and research. Ear Hear. 1989;10:58–63. doi: 10.1097/00003446-198902000-00010. [DOI] [PubMed] [Google Scholar]
- Bentler R, Walker E, McCreery R, Arenas RM, Roush P. Nonlinear frequency compression in hearing aids: Impact on speech and language development. Ear Hear. 2014;35:e143–e152. doi: 10.1097/AUD.0000000000000030. [DOI] [PMC free article] [PubMed] [Google Scholar]
- Bess FH, Gustafson SJ, Corbett BA, Lambert W, Camarata SM, Hornsby BWY. Salivary cortisol profiles of children with hearing loss. Ear Hear. 2015;37:334–344. doi: 10.1097/AUD.0000000000000256. [DOI] [PMC free article] [PubMed] [Google Scholar]
- Boersma P, Weenink D. Praat: doing phonetics by computer [Computer program] 2013 Version 5.3.51, retrieved 8 November 2013 from http://www.praat.org/
- Brennan MA, McCreery R, Kopun J, Hoover B, Alexander J. Paired comparisons of nonlinear frequency compression, extended bandwidth, and restricted bandwidth hearing aid processing for children and adults with hearing loss. J Am Acad Audiol. 2014;25:983–998. doi: 10.3766/jaaa.25.10.7. [DOI] [PMC free article] [PubMed] [Google Scholar]
- Brons I, Houben R, Dreschler WA. Perceptual effects of noise reduction with respect to personal preference, speech intelligibility, and listening effort. Ear Hear. 2013;34:29–41. doi: 10.1097/AUD.0b013e31825f299f. [DOI] [PubMed] [Google Scholar]
- Buss E, Hall JW, III, Grose JH, Dev MB. Development of adult-like performance in backward, simultaneous, and forward masking. J Speech Lang Hear Res. 1999;42:844–849. doi: 10.1044/jslhr.4204.844. [DOI] [PubMed] [Google Scholar]
- Ching TYC, Dillon H, Byrne D. Speech recognition of hearing-impaired listeners: Predictions from audibility and the limited role of high-frequency amplification. J Acoust Soc Am. 1998;103:1128–1140. doi: 10.1121/1.421224. [DOI] [PubMed] [Google Scholar]
- Ching T, Dillon H, Katsch R, Byrne D. Maximizing effective audibility in hearing aid fitting. Ear Hear. 2001;22:212–224. doi: 10.1097/00003446-200106000-00005. [DOI] [PubMed] [Google Scholar]
- Ching TY, Day J, Zhang V, Dillon H, Van Buynder P, Seeto M, Hou S, Marnane V, Thomson J, Street L, Wong A, Burns L, Flynn C. A randomized controlled trial of nonlinear frequency compression versus conventional processing in hearing aids: Speech and language of children at three years of age. Int J Audiol. 2013;52:S46–54. doi: 10.3109/14992027.2013.858281. [DOI] [PMC free article] [PubMed] [Google Scholar]
- Choi S, Lotto A, Lewis D, Hoover B, Stelmachowicz P. Attentional modulation of word recognition by children in a dual-task paradigm. J Speech Lang Hear Res. 2008;51:1042–1054. doi: 10.1044/1092-4388(2008/076). [DOI] [PMC free article] [PubMed] [Google Scholar]
- Cox RM, Alexander GC, Johnson J, Rivera I. Cochlear dead regions in typical hearing aid candidates: Prevalence and implications for use of high-frequency speech cues. Ear Hear. 2011;32:339–348. doi: 10.1097/AUD.0b013e318202e982. [DOI] [PMC free article] [PubMed] [Google Scholar]
- Desjardins JL, Doherty KA. The effect of hearing aid noise reduction on listening effort in hearing-impaired adults. Ear Hear. 2014;35:600–610. doi: 10.1097/AUD.0000000000000028. [DOI] [PubMed] [Google Scholar]
- Dickinson AM, Baker R, Siciliano C, Munro KJ. Adaptation to nonlinear frequency compression in normal-hearing adults: A comparison of training approaches. Int J Audiol. 2014;53:1–11. doi: 10.3109/14992027.2014.921338. [DOI] [PubMed] [Google Scholar]
- Dillon H. Hearing Aids. New York, NY: Thieme; 2001. [Google Scholar]
- Downs DW. Effects of hearing aid use on speech discrimination and listening effort. J Speech Hear Dis. 1982;47:189–193. doi: 10.1044/jshd.4702.189. [DOI] [PubMed] [Google Scholar]
- Ohlenforst B, Zekveld AA, Jansma EP, Wang Y, Naylor G, Lorens A, Lunner T, Kramer SE. Effects of hearing impairment and hearing aid amplification on listening effort: A systematic review. Ear Hear. 2017 doi: 10.1097/AUD.0000000000000396. Ahead of Print. [DOI] [PMC free article] [PubMed] [Google Scholar]
- Ellis RJ, Munro KJ. Predictors of aided speech recognition, with and without frequency compression, in older adults. Int J Audiol. 2015;54:1–9. doi: 10.3109/14992027.2014.996825. [DOI] [PubMed] [Google Scholar]
- Gatehouse S, Gordon J. Response times to speech stimuli as measures of benefit from amplification. Br J Audiol. 1990;24:63–68. doi: 10.3109/03005369009077843. [DOI] [PubMed] [Google Scholar]
- Glista D, Scollie S, Bagatto M, Seewald R, Parsa V, Johnson A. Evaluation of nonlinear frequency compression: clinical outcomes. Int J Audiol. 2009;48:632–644. doi: 10.1080/14992020902971349. [DOI] [PMC free article] [PubMed] [Google Scholar]
- Glista D, Scollie S, Sulkers J. Perceptual acclimatization post nonlinear frequency compression hearing aid fitting in older children. J Speech Lang Hear Res. 2012;55:1765–1787. doi: 10.1044/1092-4388(2012/11-0163). [DOI] [PubMed] [Google Scholar]
- Gustafson S, McCreery R, Hoover B, Kopun JG, Stelmachowicz P. Listening effort and perceived clarity for normal-hearing children with the use of digital noise reduction. Ear Hear. 2014;35:183–194. doi: 10.1097/01.aud.0000440715.85844.b8. [DOI] [PMC free article] [PubMed] [Google Scholar]
- Hicks CB, Tharpe AM. Listening effort and fatigue in school-age children with and without hearing loss. J Speech Lang Hear Res. 2002;45:573–584. doi: 10.1044/1092-4388(2002/046). [DOI] [PubMed] [Google Scholar]
- Hillock-Dunn A, Buss E, Duncan N, Roush PA, Leibold LJ. Effects of nonlinear frequency compression on speech identification in children with hearing loss. Ear Hear. 2014;35:353–365. doi: 10.1097/AUD.0000000000000007. [DOI] [PMC free article] [PubMed] [Google Scholar]
- Hogan CA, Turner CW. High-frequency audibility: Benefits for hearing-impaired listeners. J Acoust Soc Am. 1998;104:432–441. doi: 10.1121/1.423247. [DOI] [PubMed] [Google Scholar]
- Hopkins K, Khanom M, Dickinson AM, Munro KJ. Benefit from non-linear frequency compression hearing aids in a clinical setting: The effects of duration of experience and severity of high-frequency hearing loss. Int J Audiol. 2014;53:219–228. doi: 10.3109/14992027.2013.873956. [DOI] [PubMed] [Google Scholar]
- Hornsby BWY, Johnson EE, Picou E. Effects of degree and configuration of hearing loss on the contribution of high-and low-frequency speech information to bilateral speech understanding. Ear Hear. 2011;32:543–555. doi: 10.1097/AUD.0b013e31820e5028. [DOI] [PMC free article] [PubMed] [Google Scholar]
- Hornsby BW. The effects of hearing aid use on listening effort and mental fatigue associated with sustained speech processing demands. Ear Hear. 2013;24:523–534. doi: 10.1097/AUD.0b013e31828003d8. [DOI] [PubMed] [Google Scholar]
- Hornsby BWY, Werfel K, Camarata S, Bess FH. Subjective fatigue in children with hearing loss: Some preliminary findings. Ear Hear. 2014;23:129–134. doi: 10.1044/1059-0889(2013/13-0017). [DOI] [PMC free article] [PubMed] [Google Scholar]
- Houben R, van Doorn-Bierman M, Dreschler WA. Using response time to speech as a measure for listening effort. Int J Audiol. 2013;52:753–61. doi: 10.3109/14992027.2013.832415. [DOI] [PubMed] [Google Scholar]
- Humes L, Christensen L, Thomas T, Bess F, Hedley-William A, Bentler R. A comparison of the aided performance and benefit provided by a linear and a two-channel wide dynamic range compression hearing aid. J Speech Lang Hear Res. 1999;42:65–79. doi: 10.1044/jslhr.4201.65. [DOI] [PubMed] [Google Scholar]
- John A, Wolfe J, Scollie S, Schafer E, Hudson M, Woods W, Wheeler J, Hudgens K, Neumann S. Evaluation of wideband frequency responses and nonlinear frequency compression for children with cookie-bite audiometric configurations. J Am Acad Audiol. 2014;25:1022–1033. doi: 10.3766/jaaa.25.10.10. [DOI] [PubMed] [Google Scholar]
- Johnson J, Xu J, Cox R, Pendergraft P. A comparison of two methods for measuring listening effort as part of an audiologic test battery. Am J Audiol. 2015;24:419–431. doi: 10.1044/2015_AJA-14-0058. [DOI] [PMC free article] [PubMed] [Google Scholar]
- Kahneman D. Attention and Effort. Englewood Cliffs, NJ: Prentice-Hall, Inc; 1973. [Google Scholar]
- Kimlinger C, McCreery R, Lewis D. High-frequency audibility: The effects of audiometric configuration, stimulus type, and device. J Am Acad Audiol. 2015;26:128–137. doi: 10.3766/jaaa.26.2.3. [DOI] [PMC free article] [PubMed] [Google Scholar]
- Kokx-Ryan M, Cohen J, Cord MT, Walden TC, Makashay MJ, Sheffield BM, Brungart DS. Benefits of nonlinear frequency compression in adult hearing aid users. J Am Acad Audiol. 2015;26:838–855. doi: 10.3766/jaaa.15022. [DOI] [PubMed] [Google Scholar]
- Landis JR, Koch GG. The measurement of observer agreement for categorical data. Biometrics. 1977;33:159–174. [PubMed] [Google Scholar]
- Lenth RV. Some practical guidelines for effective sample size determination. Am Stat. 2001;55:187–193. [Google Scholar]
- Lewis D, Schmid K, O’Leary S, Heinrichs-Graham E, Spalding J, High R. Effects of noise on speech recognition and listening effort in children with normal-hearing and children with mild bilateral or unilateral hearing loss. J Speech Lang Hear Res. 2016;59:1218–1232. doi: 10.1044/2016_JSLHR-H-15-0207. [DOI] [PMC free article] [PubMed] [Google Scholar]
- Mackersie CL, Crocker TL, Davis RA. Limiting high-frequency hearing aid gain in listeners with and without suspected cochlear dead regions. J Amer Acad Audiol. 2004;15:498–507. doi: 10.3766/jaaa.15.7.4. [DOI] [PubMed] [Google Scholar]
- McCreery RW, Stelmachowicz PG. Audibility-based predictions of speech recognition for children and adults with normal hearing. J Acoust Soc Am. 2011;130:4070–4081. doi: 10.1121/1.3658476. [DOI] [PMC free article] [PubMed] [Google Scholar]
- McCreery RW, Stelmachowicz P. The effects of limited bandwidth and noise on verbal processing time and word recall in normal-hearing children. Ear Hear. 2013;34:585–591. doi: 10.1097/AUD.0b013e31828576e2. [DOI] [PMC free article] [PubMed] [Google Scholar]
- McCreery RW, Brennan MA, Hoover BM, Kopun JG, Stelmachowicz PG. Maximizing audibility and speech recognition with nonlinear frequency compression by estimating audible bandwidth. Ear Hear. 2013;34:e24–e27. doi: 10.1097/AUD.0b013e31826d0beb. [DOI] [PMC free article] [PubMed] [Google Scholar]
- McCreery RW, Alexander JM, Brennan MA, Hoover BM, Kopun JG. The influence of audibility on speech recognition with nonlinear frequency compression for children and adults with hearing loss. Ear Hear. 2014;35:440–447. doi: 10.1097/AUD.0000000000000027. [DOI] [PMC free article] [PubMed] [Google Scholar]
- McCreery RW, Walker EA, Spratford M, Oleson J, Bentler R, Holte L, Roush P. Speech recognition and parent ratings from auditory development questionnaires in children who are hard of hearing. Ear Hear. 2015;36:60S–75S. doi: 10.1097/AUD.0000000000000213. [DOI] [PMC free article] [PubMed] [Google Scholar]
- McDermott HJ. A technical comparison of digital frequency-lowering algorithms available in two current hearing aids. PLoS ONE. 2011;6:1–6. doi: 10.1371/journal.pone.0022358. [DOI] [PMC free article] [PubMed] [Google Scholar]
- McGarrigle R, Munro KJ, Dawes P, Stewart AJ, Moore DR, Barry JG, Amitay S. Listening effort and fatigue: What exactly are we measuring? A British society of audiology cognition in hearing special interest group ‘white paper’. Int J Audiol. 2014;53:433–440. doi: 10.3109/14992027.2014.890296. [DOI] [PubMed] [Google Scholar]
- Moore BCJ, Stone M, Füllgrabe C, Glasberg B, Puria S. Spectro-temporal characteristics of speech at high frequencies, and the potential for restoration of audibility to people with mild-to-moderate hearing loss. Ear Hear. 2008;29:907–922. doi: 10.1097/AUD.0b013e31818246f6. [DOI] [PMC free article] [PubMed] [Google Scholar]
- Norman DA, Bobrow DG. On data-limited and resource-limited processes. Cognitive Psychology. 1975;7:44–64. [Google Scholar]
- Pavlovic CV. Derivation of primary parameters and procedures for use in speech intelligibility predictions. J Acoust Soc Am. 1987;82:413–422. doi: 10.1121/1.395442. [DOI] [PubMed] [Google Scholar]
- Pichora-Fuller MK, Kramer SE, Eckert MA, Edwards B, Hornsby BW, Humes LE, et al. Hearing impairment and cognitive energy: The framework for understanding effortful listening (FUEL) Ear Hear. 2016;37:5S–27S. doi: 10.1097/AUD.0000000000000312. [DOI] [PubMed] [Google Scholar]
- Picou EM, Marcrum SC, Ricketts TA. Evaluation of the effects of nonlinear frequency compression on speech recognition and sound quality for adults with mild to moderate hearing loss. Int J Audiol. 2015;54:162–169. doi: 10.3109/14992027.2014.961662. [DOI] [PubMed] [Google Scholar]
- Picou EM, Ricketts TA, Hornsby BW. How hearing aids, background noise, and visual cues influence objective listening effort. Ear Hear. 2005;34:e52–e64. doi: 10.1097/AUD.0b013e31827f0431. [DOI] [PubMed] [Google Scholar]
- Pisoni DB, Manous LM, Dedina MJ. Comprehension of natural and synthetic speech: Effects of predictability on the verification of sentences controlled for intelligibility. Comput Speech Lang. 1987;2:303–320. doi: 10.1016/0885-2308(87)90014-3. [DOI] [PMC free article] [PubMed] [Google Scholar]
- Pittman A. Short-term word-learning rate in children with normal hearing and children with hearing loss in limited and extended high-frequency bandwidths. J Speech Lang Hear Res. 2008;51:785–797. doi: 10.1044/1092-4388(2008/056). [DOI] [PMC free article] [PubMed] [Google Scholar]
- Pittman A, Stelmachowicz PG. Perception of voiceless fricatives by normal-hearing and hearing-impaired children and adults. J Speech Lang Hear Res. 2000;43:1389–1401. doi: 10.1044/jslhr.4306.1389. [DOI] [PubMed] [Google Scholar]
- Preminger JE, Carpenter R, Ziegler CH. A clinical perspective on cochlear dead regions: Intelligibility of speech and subjective hearing aid benefit. J Amer Acad Audiol. 2005;16:600–613. doi: 10.3766/jaaa.16.8.9. [DOI] [PubMed] [Google Scholar]
- Core Team R. R Foundation for Statistical Computing. Vienna, Austria: 2016. [Google Scholar]
- Rakerd B, Seitz P, Whearty M. Assessing the cognitive demands of speech listening for people with hearing losses. Ear Hear. 1996;17:97–106. doi: 10.1097/00003446-199604000-00002. [DOI] [PubMed] [Google Scholar]
- Ricketts TA, Dittberner AB, Johnson EE. High-Frequency amplification and sound quality in listeners with normal through moderate hearing loss. J Speech Lang Hear Res. 2008;51:160–172. doi: 10.1044/1092-4388(2008/012). [DOI] [PubMed] [Google Scholar]
- Sarampalis A, Kalluri S, Edwards B, Hafter E. Objective measures of listening effort: Effects of background noise and noise reduction. J Speech Lang Hear Res. 2009;52:1230–1240. doi: 10.1044/1092-4388(2009/08-0111). [DOI] [PubMed] [Google Scholar]
- Scollie S, Seewald R, Cornelisse L, Moodie S, Bagatto M, Laurnagaray D, Beaulac S, Pumford J. The desired sensation level multistage input/output algorithm. Trends Amplif. 2005;9:159–197. doi: 10.1177/108471380500900403. [DOI] [PMC free article] [PubMed] [Google Scholar]
- Simpson A, Hersbach AA, McDermott HJ. Improvements in speech perception with an experimental nonlinear frequency compression hearing device. Int J Audiol. 2005;44:281–292. doi: 10.1080/14992020500060636. [DOI] [PubMed] [Google Scholar]
- Simpson A, Hersbach AA, McDermott HJ. Frequency-compression outcomes in listeners with steeply sloping audiograms. Int J Audiol. 2006;45:619–629. doi: 10.1080/14992020600825508. [DOI] [PubMed] [Google Scholar]
- Souza PE, Arehart KH, Kates JM, Croghan NB, Gehani N. Exploring the limits of frequency lowering. J Speech Lang Hear Res. 2013;56:1349–1363. doi: 10.1044/1092-4388(2013/12-0151). [DOI] [PMC free article] [PubMed] [Google Scholar]
- Stelmachowicz PG, Pittman AL, Hoover BM, Lewis DE. Effect of stimulus bandwidth on the perception of /s/ in normal- and hearing-impaired children and adults. J Acoust Soc Am. 2001;110:2183–2190. doi: 10.1121/1.1400757. [DOI] [PubMed] [Google Scholar]
- Stelmachowicz PG, Lewis DE, Choi S, Hoover BM. The effect of stimulus bandwidth on auditory skills in normal–hearing and hearing-impaired children. Ear Hear. 2007;28:483–494. doi: 10.1097/AUD.0b013e31806dc265. [DOI] [PMC free article] [PubMed] [Google Scholar]
- Storkel HL, Hoover JR. An online calculator to compute phonotactic probability and neighborhood density on the basis of child corpora of spoken American English. Behav Res Methods. 2010;42:497–506. doi: 10.3758/BRM.42.2.497. [DOI] [PMC free article] [PubMed] [Google Scholar]
- Tomblin JB, Harrison M, Ambrose SE, Walker EA, Oleson JJ, Moeller MP. Language outcomes in young children with mild to severe hearing loss. Ear Hear. 2015;36:76S–91S. doi: 10.1097/AUD.0000000000000219. [DOI] [PMC free article] [PubMed] [Google Scholar]
- Turner CW, Cummings KJ. Speech audibility for listeners with high-frequency hearing loss. Am J Audiol. 1999;8:47–56. doi: 10.1044/1059-0889(1999/002). [DOI] [PubMed] [Google Scholar]
- Whelan R. Effective analysis of reaction time data. The Psychol Rec. 2008;58:475–482. [Google Scholar]
- Wolfe J, John A, Schafer E, Nyffeler M, Boretzki M, Caraway T. Evaluation of nonlinear frequency compression for school-age children with moderate to moderately severe hearing loss. J Am Acad Audiol. 2010;21:618–628. doi: 10.3766/jaaa.21.10.2. [DOI] [PubMed] [Google Scholar]
- Wolfe J, John A, Schafer E, Nyffeler M, Boretzki M, Caraway T, Hudson M. Long-term effects of non-linear frequency compression for children with moderate hearing loss. Int J Audiol. 2011;50:396–404. doi: 10.3109/14992027.2010.551788. [DOI] [PubMed] [Google Scholar]
- Wolfe J, John A, Schafer E, Hudson M, Boretzki M, Scollie S, Woods W, Wheeler J, Hudgens K, Neumann S. Evaluation of wideband frequency responses and non-linear frequency compression for children with mild to moderate high-frequency hearing loss. Int J Audiol. 2015;54:170–181. doi: 10.3109/14992027.2014.943845. [DOI] [PubMed] [Google Scholar]