Abstract
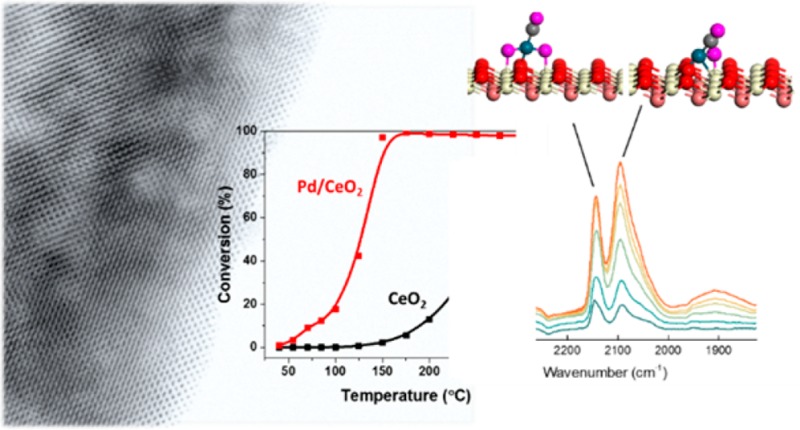
Ceria-supported Pd is a promising heterogeneous catalyst for CO oxidation relevant to environmental cleanup reactions. Pd loaded onto a nanorod form of ceria exposing predominantly (111) facets is already active at 50 °C. Here we report a combination of CO-FTIR spectroscopy and theoretical calculations that allows assigning different forms of Pd on the CeO2(111) surface during reaction conditions. Single Pd atoms stabilized in the form of PdO and PdO2 in a CO/O2 atmosphere participate in a catalytic cycle involving very low activation barriers for CO oxidation. The presence of single Pd atoms on the Pd/CeO2-nanorod, corroborated by aberration-corrected TEM and CO-FTIR spectroscopy, is considered pivotal to its high CO oxidation activity.
Keywords: cerium oxide, palladium, single site, CO oxidation, FTIR, computational modeling, mechanism
Three-way catalysts for automotive exhaust emissions convert harmful gases such as CO, NOx, and hydrocarbons into harmless gases. The catalyst layer contains platinum, rhodium, and palladium on alumina and ceria-zirconia carriers.1,2 Palladium can replace the more expensive platinum and is, in combination with ceria, essential for low-temperature oxidation performance of CO and hydrocarbons.3,4 Thermal sintering of the Pd atoms, clusters, and nanoparticles via Ostwald ripening is the cause of deactivation of these catalysts during prolonged operation.5,6 The synergy between palladium and ceria is relevant to several chemical reactions.3,4,6,7 For low-temperature CO oxidation, high dispersion of palladium on the ceria surface appears to be crucial.8 It is usually assumed that metallic Pd clusters and nanoparticles are the active components for CO oxidation. There is, however, increasing evidence that single atoms or very small clusters of Au, Pt, and Rh have distinct advantages in CO oxidation catalysis, especially in connection with ceria as a carrier that can easily supply oxygen atoms.9,10 Many of these studies made use of novel preparation methods to increase the amount of isolated or highly dispersed metal atoms on the support.11,12 For instance, Flytzani-Stephanopoulos used cyanide-leaching to remove metallic Au particles from Au/CeO2, with the remaining gold cations interacting strongly with ceria and displaying high activity in CO oxidation and the water–gas shift reaction.13 The same group emphasized the role of single Pt atoms stabilized by alkali ions in obtaining highly active CO oxidation catalysts.14 On the contrary, Stair et al. reported that single Pt atoms supported on TiO2 and SiO2 are not active in low-temperature CO oxidation, as they bind CO too strongly. Instead, very small subnanometer Pt clusters were identified as the active phase for CO oxidation.15 Datye and co-workers recently demonstrated that volatile Pt-oxides can be trapped on ceria in ionic form at high temperature. The resulting catalysts contain atomically dispersed Pt with high thermal stability, because the metal atoms are trapped in stable binding sites of ceria.16 However, these ionic Pt sites are not active for low-temperature CO oxidation in agreement with the results from the Stair group.
In contrast, much higher CO oxidation activity was demonstrated by highly dispersed Rh-oxide clusters supported on ceria compared with metallic Rh particles.17 Quantum-chemical calculations show how lattice O atoms of ceria are involved in the catalytic cycle of CO oxidation by such Rh-oxide clusters.18 Likewise, it was proposed that isolated Pd oxide supported on La-modified alumina was more active than metallic metal clusters.19 These isolated Pd species transformed easily into metallic Pd particles, losing catalytic activity.
Although Pd/CeO2 is known to be active and stable for low-temperature CO oxidation, the nature of the active sites has not been conclusively established. Here, we will show that, during low temperature CO oxidation, Pd can be stabilized as single atoms on the (111) facet of ceria using conventional preparation techniques. Such high dispersion of Pt and Pd by simple wet impregnation can for instance also be achieved on an alumina support.19,20 As mentioned before, also CeO2 can stabilize single noble metal atoms on its surface.16 In our case, these Pd atoms are stable under reaction conditions and contribute substantially to the CO oxidation activity of Pd/CeO2. We selected nanostructured ceria nanorods, because they expose prominent (111) facets, which are the most stable surfaces of ceria.21 We loaded this support with 1 wt % Pd using its nitrate salt by incipient wetness impregnation followed by calcination at 300 °C in air. Figure 1a shows the CO oxidation activity as a function of the temperature for the blank CeO2-rods and the Pd/CeO2-rods. While the support alone shows negligible activity at low temperature, the Pd/CeO2-rod catalyst is able to achieve full CO conversion at temperatures as low as 125 °C. Notably, Pd/CeO2-rod is already active at 50 °C, a temperature which we will employ below to study the catalytic surface by IR spectroscopy after adsorption of CO. The higher catalytic activity of CeO2 nanorods-based catalysts compared to other CeO2 nanostructures in many reactions has already been reported by many research groups. Soler et al. demonstrated that a higher activity in CO oxidation can be obtained by depositing noble metals on CeO2 nanorods, rather than on nanocubes or other nanostructures.22 Wu et al. studied the CO oxidation activity of bare CeO2 nanostructures and confirmed that nanorods have a higher activity compared to nanocubes and polyhedra.23 Peng et al. showed that rod-shaped Pt/CeO2 was remarkably more active than cube-shaped Pt/CeO2 or polyhedra-shaped Pt/CeO2 in toluene oxidation.24 Hsiao et al. studied Rh/CeO2 and determined that rod-shaped catalysts show higher activity in ethanol reforming and higher hydrogen selectivity.25
Figure 1.
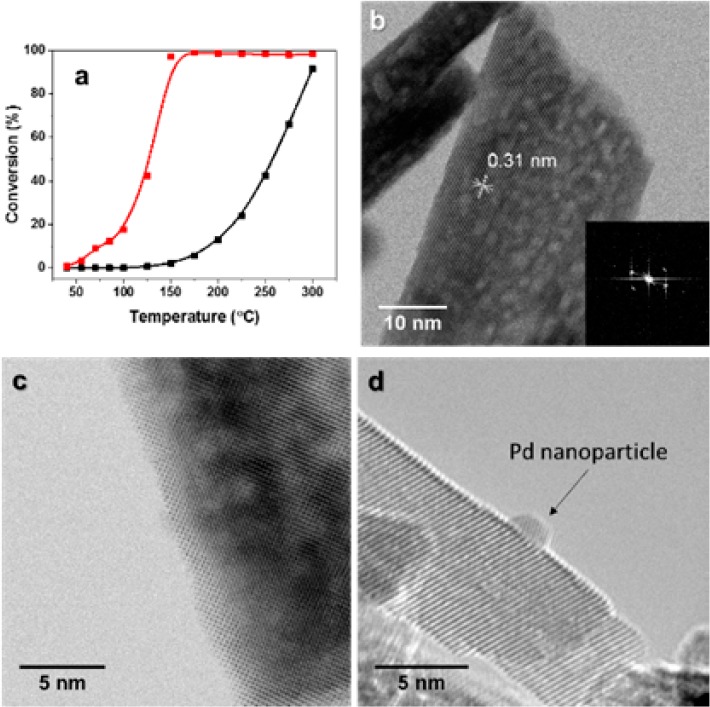
(a) CO oxidation on (black) CeO2-rods and (red) Pd/CeO2-rod, (b) AC-TEM image of CeO2 nanorods showing exposed (111) facets, (c) AC-TEM image of Pd/CeO2-rod after air calcination at 300 °C showing the absence of particles, and (d) AC-TEM image of the Pd/CeO2-rod sample after reduction at 300 °C showing a well-defined metallic Pd nanoparticle.
To investigate the origin of the high reactivity of Pd/ceria nanorods we utilized aberration-corrected scanning transmission electron microscopy (AC-STEM) of 2 wt % Pd. Figure 1b shows bare ceria nanorods confirming the exposed (111) facet. Figure 1c shows that no Pd clusters or particles were observed on ceria nanorods in their oxidized state, after calcination in air at 300 °C. This strongly suggests that Pd is present in highly dispersed form on the nanorod-shaped ceria support. There is a complete absence of any three-dimensional structures of PdO, and the atomically dispersed PdO is not easy to image due to low contrast compared with the high atomic number ceria support. The presence of a highly dispersed Pd phase is corroborated by EXAFS, which shows the lack of Pd–Pd coordination in the oxidized catalyst (see Supporting Information). In contrast, when the Pd/ceria nanorod is subjected to reducing environments at 300 °C, we observe well-defined Pd nanoparticles on the ceria surface (Figure 1d).
We employed in situ transmission FTIR spectroscopy to characterize the palladium phase in the Pd/CeO2-rod sample using CO as a probe molecule. The sample as a self-supporting pellet was first calcined at 300 °C in O2, evacuated, and then cooled to 50 °C. Figure 2 shows IR spectra with increasing CO pressure (CO administered as pulses). The initial spectrum contains bands at 2138, 2090, and 1975 cm–1 as well as a broad band below 1900 cm–1. The intensity of most of these bands increases with CO pressure. The strongest increase is observed for the 2090 cm–1 band, which shifts to 2086 cm–1. The band at 2138 cm–1 quickly disappears after a few CO pulses. We speculate that these changes are due to the reduction of a Pd-oxide phase into metallic Pd structures. The bands at 1950 cm–1 and in the 1850–1900 cm–1 region can be assigned to bridge and 3-fold adsorbed CO on metallic Pd, respectively.26−28 The band at 2086 cm–1 has been assigned before to linearly adsorbed CO on a highly dispersed electron-deficient Pd phase in strong interaction with CeO2.4,26 DFT calculations show that CO adsorption on Pd clusters can give rise to such vibrational frequencies (see the Supporting Information). CO2 is also formed during exposure to CO, indicating that CO reduces the catalytic surface already at 50 °C.
Figure 2.
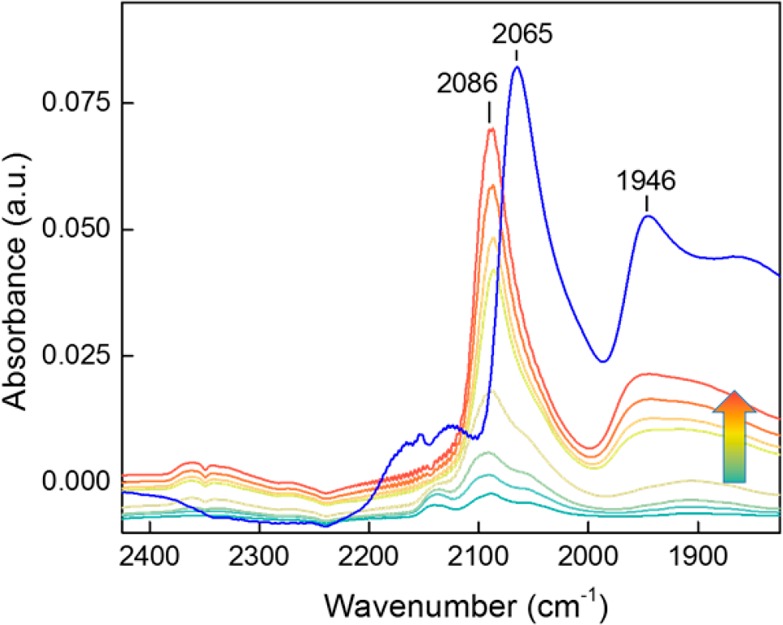
IR spectra of incremental doses of CO on calcined Pd/CeO2-rod catalyst at 50 °C (arrow indicates increasing CO pressure) and after CO adsorption at 50 °C on Pd/CeO2-rod reduced at 300 °C in H2 (blue line).
The CO FTIR spectrum of the same catalyst reduced in H2 at 300 °C (blue spectrum in Figure 2) is different: pronounced bands at 2065 cm–1, 1950 cm–1 and at lower wavenumbers due to linear and bridge-bonded CO on extended Pd metal surfaces (see the Supporting Information) emphasize the formation of larger particles in comparison to the case where the catalyst was reduced in CO at 50 °C. Figure 1d shows confirmation of this change through the formation of well-defined metallic nanoparticles on the ceria surface. The bands at 2160 and 2125 cm–1 can be assigned to electronic transitions of Ce3+ surface states, generated during the reduction process.29,30
After showing that CO is able to reduce the PdO phase at 50 °C, we carried out a similar infrared experiment in which the sample was exposed to increasing amounts of CO in the presence of 2 mbar O2 (Figure 3). The obtained FTIR spectra look very different and are characterized by increasing intensities of bands at 2143 cm–1 (composite with a shoulder around 2120 cm–1), a band at 2098 cm–1 with a shoulder at 2056 cm–1, and a very broad band around 1900 cm–1. The band at 2143 cm–1 relates to a surface intermediate, as the typical rotational–vibrational spectrum of gaseous CO is not observed. At the same time, we observe much more pronounced CO2 evolution as compared with the O2-free experiment, which demonstrates that the Pd species present in an O2 atmosphere are significantly more active for CO oxidation. We hypothesize that the bands around 2143 and 2098 cm–1 are associated with sites that are active for low-temperature CO oxidation. We initially assigned the shoulder at 2056 cm–1 and the broad band around 1900 cm–1 to a small amount of metallic Pd particles that could not be oxidized under these conditions, but we will later see that these bands are most likely due to small metallic clusters covered with O atoms.
Figure 3.
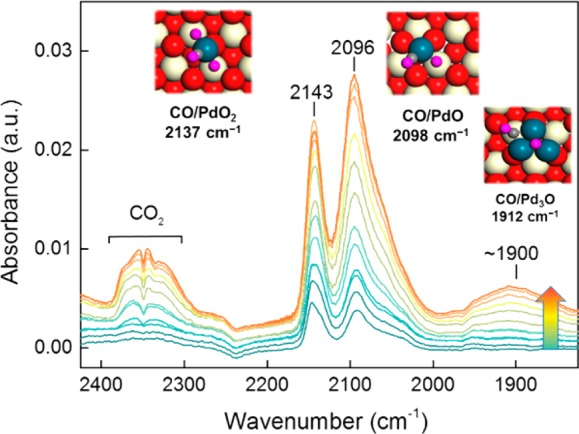
IR spectra of incremental doses of CO on the Pd/CeO2-rod catalyst at 50 °C. The catalyst was previously in situ calcined at 300 °C, cooled to 50 °C in an O2-atmosphere followed by lowering the O2 pressure to 2 mbar followed by CO pulses. The inserts show DFT-optimized structure of CO on different Pd configuration on CeO2(111) (color scheme: red, surface O; orange, subsurface O; white, surface Ce; pink, O of adsorbed species; blue, Pd).
Density functional theory was used to model the CeO2(111) surface, candidate overlayer structures of Pd, and stretching frequencies of adsorbed CO as well as possible reaction mechanisms for CO oxidation. These calculations were performed using the GGA-PBE electron exchange-correlation functional including a Hubbard-like term to describe the on-site Coulombic interaction to improve the description of the localized states for the Ce 4f orbital. As AC-STEM shows the absence of three-dimensional Pd structures (Figure 1c), implying the existence of dispersed Pd species, we first explored CO adsorption on a single Pd atom on the stoichiometric CeO2(111) surface. We report scaled vibrational CO frequencies. In this way, we find νCO = 2047 cm–1 for CO on Pd/CeO2(111), νCO = 2098 cm–1 for CO on PdO/CeO2(111), and νCO = 2137 cm–1 for CO on PdO2/CeO2(111). PdO3/CeO2(111) does not adsorb CO. Thus, PdO and PdO2 are candidate structures giving rise to the two bands observed in the FTIR spectrum under CO oxidation conditions at 50 °C. Estimating Helmholtz free energies (A) by using A = U – TS ≈ EDFT – TSO2 for PdO x /CeO2(111) shows that the stability order is PdO2 > PdO (+ 34 kJ/mol) > Pd (+ 42 kJ/mol) > PdO3 (+ 152 kJ/mol) in gaseous O2 at 50 °C (EDFT: electronic energy computed by DFT; entropy of solids neglected). This comparison renders Pd, PdO, and PdO2 on CeO2(111) candidate structures for exploring a catalytic cycle for CO oxidation. We also calculated the CO adsorption frequencies on other Pd structures. CO adsorption on a periodic Pd(111) surface, which serves as a model for surface of nanoparticles, gives rise to bands at 2056, 1868, and 1789 cm–1 for top, bridge, and 3-fold adsorbed CO, respectively. Corresponding CO adsorption configurations on a Pd10 cluster placed on the CeO2(111) surface occur at nearly similar frequencies. We also considered a very small cluster consisting of three Pd atoms and determined by ab initio thermodynamic analysis that it will be present in the form of Pd3O during CO oxidation (see the Supporting Information). When CO is bridge-bonded on the Pd3O cluster, frequencies between 1900 and 1950 cm–1 are computed depending on CO coverage. Accordingly, we surmise that the experimentally observed weak band around 1907 cm–1 is due to bridge-adsorbed CO on a small amount of metallic clusters to which O atoms are adsorbed.
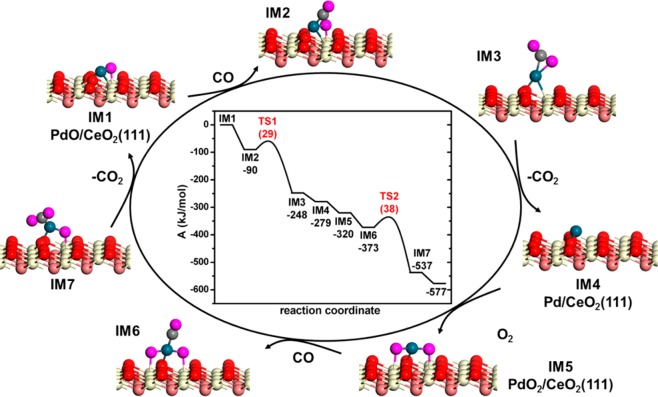
We then explored different mechanisms of CO oxidation on single atom Pd models supported on CeO2(111). CO adsorbs strongly on PdO with ΔE = −90 kJ/mol (Figure 4). The formation of CO2 by reaction of adsorbed CO with the O atom bridging between Pd and Ce4+ is very facile (ΔEact = 29 kJ/mol; ΔEact: activation barrier). Desorption of CO2 costs 31 kJ/mol. The resulting single Pd atom is slightly positively charged. According to our calculations at the PBE+U level, the energy difference between Pd0 on the stoichiometric CeO2(111) surface and the state where one electron of Pd reduces one Ce4+ ion to Ce3+ is very small. The cycle can then proceed by adsorption of CO or O2. We first considered the adsorption of CO on the Pd atom (ΔE = −152 kJ/mol). The reaction of adsorbed CO with a ceria lattice O atom is too difficult. The barrier ΔEact = 110 kJ/mol is inconsistent with the low-temperature activity of the Pd/CeO2-rod sample. Moreover, the formed CO2 molecule remains strongly adsorbed to the ceria (ΔE = 93 kJ/mol). The single Pd atom can also be oxidized by O2 from the gas phase or by a lattice O atom of ceria. The latter reaction is endothermic, whereas it is exothermic for single Rh atoms dispersed on CeO2(111).18 The difference relates to the higher d-orbital occupancy of the Pd atom, rendering O adsorption weaker. Accordingly, dissociative adsorption of O2 on the single Pd atom is more likely, as it is strongly exothermic by ΔE = −107 kJ/mol. In the resulting PdO2 configuration, the Pd atom is in the +3 oxidation state. Adsorption of CO to the PdO2 surface intermediate is exothermic by ΔE = −53 kJ/mol. The activation barrier for formation of CO2 from the PdO2–CO complex is only ΔEact = 38 kJ/mol. Desorption of the second CO2 molecule costs 40 kJ/mol. The last step regenerates the initial PdO species and thereby closes the catalytic cycle.
Figure 4.
Helmholtz free-energy diagram of the catalytic cycle for CO oxidation on a single Pd atom on the CeO2(111) surface (IM = intermediate; TS = transition state; color scheme: red, surface O; orange, subsurface O; white, surface Ce; pink, O of O2 and CO; blue, Pd).
In determining which states along the reaction coordinate may be expected to dominate under typical reaction conditions, we constructed a Helmholtz free-energy diagram (Figure 4). We neglected the entropies of the solids in this analysis. The resulting energy diagram emphasizes that the transition states of the two CO oxidation events (IM2 → IM3 and IM6 → IM7) are the only endergonic states along the reaction coordinate. The two endothermic CO2 desorption steps are exergonic because of the entropy gain associated with the release of CO2 into the gas phase. This simple analysis predicts CO-PdO/CeO2(111) and CO-PdO2/CeO2(111) to be the major reaction intermediates during CO oxidation. These intermediates are identified by their respective CO signatures at 2137 and 2096 cm–1, respectively, which can be matched with the experimentally observed spectral features at 2143 and 2098 cm–1, respectively.
In order to gain insight into the stability of oxidized single Pd atoms, we determined energy barriers for the diffusion of Pd and PdO2 on the CeO2(111) surface. The potential energy diagrams are provided in the Supporting Information. While Pd can freely diffuse on the surface (ΔEact = 6 kJ/mol), PdO2 is much more strongly bonded to the support. The resulting diffusion barrier of 88 kJ/mol illustrates its resistance against sintering. Finally, we compared the thermodynamic stability of a range of Pdn clusters (n = 2–21), Pd and PdO2 on CeO2(111). The result shows that under reducing conditions Pdn clusters are more stable than isolated Pd. On the contrary, in the presence of oxygen dispersion of Pdn clusters into isolated PdO2 species is favorable, explaining the high Pd dispersion discussed in this work.
In summary, we focused on an intentionally nanostructured catalyst containing single Pd sites on CeO2 nanorods that expose (111) facets. We investigated the reaction mechanism of CO oxidation by means of a combination of experimental techniques, such as aberration-corrected TEM which helps define the structure of the Pd sites and CO-FTIR which shows the nature of the adsorbed CO. The theoretical calculations allowed us to precisely assign each infrared band with the help of DFT calculations, to evaluate the entire catalytic mechanism and to prove the existence of single Pd sites in our catalyst. These single Pd sites play an essential role in the low-temperature CO oxidation reaction. The presence of single sites in the Pd/CeO2-rod sample, which was assessed by the combination of AC-TEM and FTIR, helps to explain the high activity for the CO oxidation reaction at temperatures where metallic Pd is inactive because of CO poisoning.
Acknowledgments
E.J.M.H. thanks The Netherlands Organization for Scientific Research (NWO) for a personal Vici research grant. We acknowledge support from the U.S. Department of Energy, Office of Science through grant DE-FG02–05ER15712.
Supporting Information Available
The Supporting Information is available free of charge on the ACS Publications website at DOI: 10.1021/acscatal.7b02001.
Synthesis procedures for the ceria support and the Pd-loaded catalyst, characterization methods (TEM, IR), DFT calculation details, and alternative reaction cycles (PDF)
The authors declare no competing financial interest.
Supplementary Material
References
- Trovarelli A.; de Leitenburg C.; Boaro M.; Dolcetti G. Catal. Today 1999, 50, 353–367. 10.1016/S0920-5861(98)00515-X. [DOI] [Google Scholar]
- Montini T.; Melchionna M.; Monai M.; Fornasiero P. Chem. Rev. 2016, 116, 5987–6041. 10.1021/acs.chemrev.5b00603. [DOI] [PubMed] [Google Scholar]
- Cargnello M.; Delgado Jaén J. J.; Hernández Garrido J. C.; Bakhmutsky K.; Montini T.; Calvino Gámez J. J.; Gorte R. J.; Fornasiero P. Science 2012, 337, 713–717. 10.1126/science.1222887. [DOI] [PubMed] [Google Scholar]
- Boronin A. I.; Slavinskaya E. M.; Danilova I. G.; Gulyaev R. V.; Amosov Y. I.; Kuznetsov P. A.; Polukhina I. A.; Koscheev S. V.; Zaikovskii V. I.; Noskov A. S. Catal. Today 2009, 144, 201–211. 10.1016/j.cattod.2009.01.035. [DOI] [Google Scholar]
- Xu Q.; Kharas K. C.; Croley B. J.; Datye A. K. ChemCatChem 2011, 3, 1004–1014. 10.1002/cctc.201000392. [DOI] [Google Scholar]
- Adijanto L.; Bennett D. A.; Chen C.; Yu A. S.; Cargnello M.; Fornasiero P.; Gorte R. J.; Vohs J. M. Nano Lett. 2013, 13, 2252–2257. 10.1021/nl4008216. [DOI] [PubMed] [Google Scholar]
- Bera P.; Patil K. C.; Jayaram V.; Subbanna G. N.; Hegde M. S. J. Catal. 2000, 196, 293–301. 10.1006/jcat.2000.3048. [DOI] [Google Scholar]
- Zhang S.; Chen C.; Cargnello M.; Fornasiero P.; Gorte R. J.; Graham G. W.; Pan X. Nat. Commun. 2015, 6, 7778–7783. 10.1038/ncomms8778. [DOI] [PMC free article] [PubMed] [Google Scholar]
- Kopelent R.; Van Bokhoven J. A.; Szlachetko J.; Edebeli J.; Paun C.; Nachtegaal M.; Safonova O. V. Angew. Chem., Int. Ed. 2015, 54, 8728–8731. 10.1002/anie.201503022. [DOI] [PubMed] [Google Scholar]
- Manzoli M.; Boccuzzi F.; Chiorino A.; Vindigni F.; Deng W.; Flytzani-Stephanopoulos M. J. Catal. 2007, 245, 308–315. 10.1016/j.jcat.2006.10.021. [DOI] [Google Scholar]
- Guan Y.; Ligthart D. A. J. M.; Pirgon-Galin Ö.; Pieterse J. A. Z.; van Santen R. A.; Hensen E. J. M. Top. Catal. 2011, 54, 424–438. 10.1007/s11244-011-9673-2. [DOI] [Google Scholar]
- Liu P.; Zhao Y.; Qin R.; Mo S.; Chen G.; Gu L.; Chevrier D. M.; Zhang P.; Guo Q.; Zang D.; Wu B.; Fu G.; Zheng N. Science 2016, 352, 797–800. 10.1126/science.aaf5251. [DOI] [PubMed] [Google Scholar]
- Flytzani-Stephanopoulos M. Acc. Chem. Res. 2014, 47, 783–792. 10.1021/ar4001845. [DOI] [PubMed] [Google Scholar]
- Zugic B.; Zhang S.; Bell D. C.; Tao F.; Flytzani-Stephanopoulos M. J. Am. Chem. Soc. 2014, 136, 3238–3245. 10.1021/ja4123889. [DOI] [PubMed] [Google Scholar]
- Ding K.; Gulec A.; Johnson A. M.; Schweitzer N. M.; Stucky G. D.; Marks L. D.; Stair P. C. Science 2015, 350, 189–192. 10.1126/science.aac6368. [DOI] [PubMed] [Google Scholar]
- Jones J.; Xiong H.; DeLaRiva A. T.; Peterson E. J.; Pham H.; Challa S. R.; Qi G.; Oh S.; Wiebenga M. H.; Hernandez X. I. P.; Wang Y.; Datye A. K. Science 2016, 353, 150–154. 10.1126/science.aaf8800. [DOI] [PubMed] [Google Scholar]
- Ligthart D. A. J. M.; van Santen R. a.; Hensen E. J. M. Angew. Chem., Int. Ed. 2011, 50, 5306–5310. 10.1002/anie.201100190. [DOI] [PubMed] [Google Scholar]
- Song W.; Jansen A. P. J.; Degirmenci V.; Ligthart D. A. J. M.; Hensen E. J. M. Chem. Commun. 2013, 49, 3851–3853. 10.1039/c3cc40670a. [DOI] [PubMed] [Google Scholar]
- Peterson E. J.; DeLaRiva A. T.; Lin S.; Johnson R. S.; Guo H.; Miller J. T.; Hun Kwak J.; Peden C. H. F.; Kiefer B.; Allard L. F.; Ribeiro F. H.; Datye A. K. Nat. Commun. 2014, 5, 4885. 10.1038/ncomms5885. [DOI] [PubMed] [Google Scholar]
- Kwak J. H.; Hu J.; Mei D.; Yi C.-W.; Kim D. H.; Peden C. H. F.; Allard L. F.; Szanyi J. Science 2009, 325, 1670–1673. 10.1126/science.1176745. [DOI] [PubMed] [Google Scholar]
- Agarwal S.; Lefferts L.; Mojet B. L.; Ligthart D. A. J. M.; Hensen E. J. M.; Mitchell D. R. G.; Erasmus W. J.; Anderson B. G.; Olivier E. J.; Neethling J. H.; Datye A. K. ChemSusChem 2013, 6, 1898–1906. 10.1002/cssc.201300651. [DOI] [PubMed] [Google Scholar]
- Soler L.; Casanovas A.; Urrich A.; Angurell I.; Llorca J. Appl. Catal., B 2016, 197, 47–55. 10.1016/j.apcatb.2016.02.025. [DOI] [Google Scholar]
- Wu Z.; Li M.; Overbury S. H. J. Catal. 2012, 285 (1), 61–73. 10.1016/j.jcat.2011.09.011. [DOI] [Google Scholar]
- Peng R.; Sun X.; Li S.; Chen L.; Fu M.; Wu J.; Ye D. Chem. Eng. J. 2016, 306, 1234–1246. 10.1016/j.cej.2016.08.056. [DOI] [Google Scholar]
- Hsiao W. I.; Lin Y. S.; Chen Y. C.; Lee C. S. Chem. Phys. Lett. 2007, 441, 294–299. 10.1016/j.cplett.2007.05.024. [DOI] [Google Scholar]
- Xu J.; Ouyang L.; Mao W.; Yang X.-J.; Xu X.; Su J.-J.; Zhuang T.-Z.; Li H.; Han Y.-F. ACS Catal. 2012, 2, 261–269. 10.1021/cs200694k. [DOI] [Google Scholar]
- Bensalem A.; Muller J.-C.; Tessier D.; Bozon-Verduraz F. J. Chem. Soc., Faraday Trans. 1996, 92, 3233–3237. 10.1039/FT9969203233. [DOI] [Google Scholar]
- Cabilla G. C.; Bonivardi A.; Baltanas M. Catal. Lett. 1998, 55, 147–156. 10.1023/A:1019095231484. [DOI] [Google Scholar]
- Agarwal S.; Zhu X.; Hensen E. J. M.; Mojet B. L.; Lefferts L. J. Phys. Chem. C 2015, 119, 12423–12433. 10.1021/acs.jpcc.5b02389. [DOI] [Google Scholar]
- Aldana P. A. U.; Ocampo F.; Kobl K.; Louis B.; Thibault-Starzyk F.; Daturi M.; Bazin P.; Thomas S.; Roger A. C. Catal. Today 2013, 215, 201–205. 10.1016/j.cattod.2013.02.019. [DOI] [Google Scholar]
Associated Data
This section collects any data citations, data availability statements, or supplementary materials included in this article.


