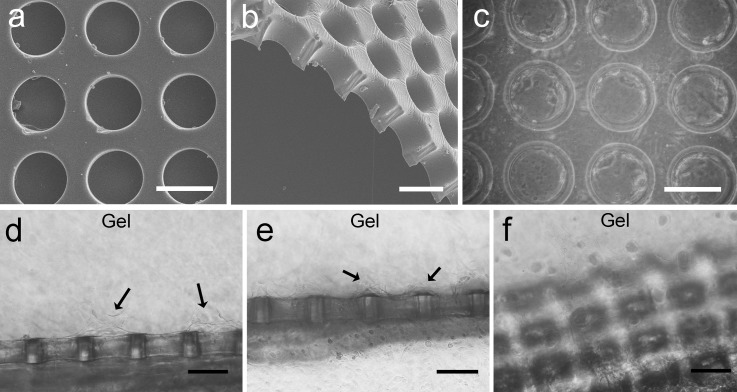
FIG. 4.
SEM images of the microhole barrier and cell integration. (a) and (b) SEM images of the PDMS microhole barrier. (b) The sectional view. (c) Phase-contrast micrograph of HUVECs cultured on the microhole substrate for 1 day. (d)–(f) Phase-contrast micrograph of HUVECs cultured in the device with the microhole barrier for 2 days. The arrows indicate the initial sprouting positions. The scale bar is 100 μm.

