

Abstract
In this survey, a total of 80 787 reads and 28 171 unique NifH protein sequences were retrieved from soil RNA. This dataset extends our knowledge about the structure and diversity of the functional diazotrophic communities in agricultural soils from Argentinean Pampas. Operational taxonomic unit (OTU)‐based analyses showed that nifH phylotypes related to Geobacter and Anaeromyxobacter (44.8%), Rhizobiales (29%), Cyanobacteria (16.7%), and Verrucomicrobiales (8%) are key microbial components of N2 fixation in soils associated with no‐till management and soil depth. In addition, quantification of nifH gene copies related to Geobacter and Cyanobacteria revealed that these groups are abundant in soils under maize–soybean rotation and soybean monoculture, respectively. The correlation of physicochemical soil parameters with the diazotrophic diversity and composition showed that soil stability and organic carbon might contribute to the functional signatures of particular nifH phylotypes in fields under no‐till management. Because crop production relies on soil‐borne microorganism's activities, such as free N2 fixation, the information provided by our study on the diazotrophic population dynamics, associated with the edaphic properties and land‐use practices, represents a major contribution to gain insight into soil biology, in which functionally active components are identified.
Keywords: Cyanobacteria and Geobacter, nifH transcripts, soil diazotrophic community, soil management practices
1. INTRODUCTION
Agricultural management in the extensive Pampa and Chaco plains of Argentina relies on no‐till farming (source: Aapresid, www.aapresid.org.ar) that accounts for about 27 million hectares, with an increasing simplification in crop sequence based mainly on soybean monoculture (Durán, Morrás, Studdert, & Liu, 2011; Viglizzo et al., 2011). Several adverse effects have been associated with this simplification such as lower organic carbon (OC), lower aggregate stability, modification of soil porosity due to a diminution of its total volume, as well as higher bulk density and development of platy structures (Chagas, Santanatoglia, Castiglioni, & Marelli, 1995; Novelli, Caviglia, & Melchiori, 2011; Novelli, Caviglia, Wilson, & Sasal, 2013; Sasal, Andriulo, & Taboada, 2006). Hence, the way soils are used in agriculture can deeply modify their architecture constitution (Pierce, Fortin, & Staton, 1994) with significant consequences on the soil structure and the soil–water interactions (Castiglioni, Behrends Kraemer, & Morras, 2013; Raynaud & Nunan, 2014; Reynolds, Bowman, Drury, Tana, & Lu, 2002). Moreover, crop sequence in addition to no tilling also impacts pore size as well as pore stability (Castiglioni et al., 2013; Novelli et al., 2013) with strong depth influence due to the high stratification of soil properties in this system (Cavenage et al., 1999; Wander & Bollero, 1999). It has been shown that these physical soil properties affect activity and survival of fungal and bacterial communities (Hattori, 1988). Furthermore, it has been suggested that microscale spatial patterns and depth may have a regulatory effect on bacterial density (Nunan, Wu, Young, Crawford, & Ritz, 2003) and activity (Darrah, White, & Nye, 1987; Grundmann et al., 2001).
The soil microbes play key roles in recycling carbon, nitrogen, and other nutrients as well as solubilization and uptake of P and K. In particular, biologically available nitrogen in soil is the major common nutrient that limits productivity in terrestrial ecosystems, and its input is predominantly mediated by biological nitrogen fixation (BFN) (Gaby & Buckley, 2011). BFN, consisting of the N2 enzymatic reduction into ammonia by nitrogenase activity, is an exclusively prokaryotic metabolic process which is performed by a phylogenetically diverse group of microorganisms belonging to Bacteria and Archaea domains (Zehr, Jenkins, Short, & Steward, 2003). This process accounts for approximately 128 million tons of nitrogen per year and is considered the main route by which fixed nitrogen enters the biosphere by natural processes (Galloway et al., 2004). Here, two major pathways for BNF have been shown either living as free‐living forms or in symbiotic/associative relationships (Izquierdo & Nüsslein, 2006; Young, 1992). The ecological significance of free‐living diazotrophs in terrestrial ecosystems can be difficult to constrain as estimates for N fixation by these microorganisms can vary widely, ranging from 0 to 60 kg Ha−1 per year (Cleveland et al., 1999; Hsu & Buckley, 2009; Reed, Cleveland, & Townsend, 2011).
Examination of the nifH gene that encodes the nitrogenase reductase subunit has been used to assess the phylogeny, diversity, and abundance of diazotrophic communities (Zehr et al., 2003). Surveys of nifH sequences in soil have reported important contributions which in turn have increased our understanding about N2‐fixation potential and dynamics in this environment (Hamelin, Fromin, Tarnawski, Teyssier‐Cuvelle, & Aragno, 2002; Niederberger et al., 2012; Rösch, Mergel, & Bothe, 2002; Wang et al., 2016; Yeager et al., 2004). Several studies emphasize that a great part of the diazotrophic diversity corresponds to uncharacterized and uncultured soil bacteria (Duc, Noll, Meier, Bürgmann, & Zeyer, 2009; Gaby & Buckley, 2011; Hsu & Buckley, 2009). Recent next‐generation sequencing techniques broaden the database of potential diazotrophs in several natural environments such as sea water, soils, and saline mats (Collavino et al., 2014; Farnelid et al., 2011; Wang et al., 2013; Woebken et al., 2015).
However, there is still considerable uncertainty about which components of the diazotrophic community are actively expressing nitrogenase in the different ecosystems. Studies which lead to the examination of soil functioning in real‐world field conditions are limited. McInnes, Shepard, Raes, Waite, and Quigg (2014) applied in situ hybridization assays to estimate BNF in ocean waters. Buckley, Huangyutitham, Hsu, and Nelson (2007) used a procedure based on 15N‐stable isotopic probing with soil samples to characterize and identify diazotrophs that are functionally active in situ. An alternative approach is to directly investigate the mRNA of nifH by RT‐PCR, which has been widely applied in aquatic environments (Bird & Wyman, 2013; Church, Short, Jenkins, Karl, & Zehr, 2005; Short & Zehr, 2007; Turk et al., 2011). Nevertheless, studies on nifH‐cDNA are in general, very limited in soil samples (Hsu & Buckley, 2009; McGrath et al., 2008; Niederberger et al., 2012).
We have previously reported the abundance, diversity, and structure of diazotrophic communities in a gradient of Argentinean no‐till agricultural soils under contrasting management. In that research, we used deep pyrosequencing‐based analysis of the nifH gene in the DNA extracted from soil samples. This investigation has revealed not only novel nitrogen‐fixing organisms but also has begun to shed light on how diazotrophic communities are effected and influenced by soil chemistry and land use (Collavino et al., 2014).
The aim of this study was to assess the effect of different agricultural managements and soil depth on the diversity and structure of the active N2‐fixing community. To this end, we have applied a pyrosequencing‐based analysis of nifH sequences obtained from soil RNA from Pergamino fields located in the Argentinean Pampas. Our results have revealed a great diversity and a high representation of sequences related to Geobacter and Rhizobiales, and also to a major group of deep divergent sequences related to Cyanobacteria. The abundance of these particular groups, the diversity of the active diazotroph community, and distributions of key populations were affected by no‐till practices and by some physical–chemistry features of the soil. These taxa that were found to be associated with characteristics of porosity and soil pore size can provide useful criteria to assess the quality of agricultural soils.
2. EXPERIMENTAL PROCEDURES
2.1. Soil sampling and nucleic acid extraction
Free N2‐fixing communities were studied at the agricultural area of Pergamino in Buenos Aires Province (33°56′36″S; 60°33′57″W) from two soil depths of 0.0–10 cm (surface) and 10‐20 cm (subsurface) in June 2012. Soil samples of this site were previously studied by our team (Collavino et al., 2014). The studied soil is Typic Argiudoll, silty loam found in the surface horizon, and silty clay loam in the deeper layers (Duval et al., 2013). The clay mineralogy consists of 2:1 clays, mainly illites with a small proportion of irregular interstratified illite–smectite minerals, and traces of kaolinite.
Two different no‐till agricultural managements were examined as treatments. Good agricultural practices (GAP) are characterized by intensive crop rotation (soybean–maize), practice of winter cover crops, nutrient replacement, and low agrochemical use (herbicides, insecticides, and fungicides). Poor agricultural practices (PAP) are characterized by crop monoculture (soybean), low nutrient replacement, high agrochemical use, and lower yields. Natural environment (NE) was used as treatment reference, and consisted of natural grassland close to the cultivated plots, where no cultivation has been practiced for at least the last 30 years. The reader is referred to the Methods sections of Figuerola et al., 2012, for a detailed description of these contrasting agricultural practices. Each treatment and depth were sampled in three replicates from 5 m2 quadrants separated by at least 50 m from each other. Soil samples were transported with dry ice to the laboratory, sieved through 4 mm mesh to remove roots and plant detritus, and processed 24 hr after collection. Total community RNA was extracted from 2 g of each replicate soil sample using the RNA PowerSoil® Total RNA Isolation Kit (MO BIO) following the manufacturer's instructions. Total community DNA was extracted from 0.25 g of each replicate soil sample using FastDNASpin kit for soil (MP Biomedicals), in accordance with the manufacturer's instructions. The resulting RNA was treated with DNase I Amplification Grade (Invitrogen™). Quality and concentration of extracted nucleic acid were subsequently assessed by gel electrophoresis and spectrometry (Nanodrop, ThermoScientific).
2.2. Reverse transcriptase (RT)‐PCR amplification
cDNA was synthesized from 200 ng of RNA of each replicate soil using the SuperScript III reverse transcriptase (Invitrogen™) with three picomol of the universal primer nifH3 (Zani, Mellon, Collier, & Zehr, 2000). The rest of the reagents were added as per manufacturer's instructions. The final volume of the reaction mix was 20 μl. Reaction mixtures were incubated at 55°C for 50 min.
After reverse transcription, 2 μl (10 ng/μl) of the nifH‐cDNA was used for the first step of nested PCR as proposed by Yeager et al. (2004). For the second PCR slight modifications were incorporated. We used 2 μl of undiluted PCR product as template and primers included Roche 454 tag sequences (in bold) fused to the 5′ end (nifH11 5′CACGACGTTGTAAAACGAC GAY CCN AAR GCN GAC TC 3′ and nifH22 5′CAGGAAACAGCTATGACC ADW GCC ATC ATY TCR CC 3′). The PCR reactions were conducted in triplicate to minimize random PCR bias. Amplicons were purified by using NucleoSpin® Gel Extract II kit (Macherey‐Nagel) and quantified using a Nanodrop Spectrophotometer. Replicates were pooled in equimolar concentrations in a single treatment library. Negative controls were applied in order to confirm that RT‐PCR results come from RNA template and not from possible genomic DNA contamination. Extracted RNA from all depth–treatment soil samples was treated with DNase I. After this treatment, 1 μl of RNA (200 ng/μl) was subjected to RT‐PCR reaction without reverse transcriptase and subsequently to nifH nested PCR. The DNA contamination was also monitored through agarose gel electrophoresis during the different experimental steps (Fig. S3).
2.3. nifH amplicon pyrosequencing and sequence processing
The diversity and structure of the active diazotrophic communities were evaluated by pyrosequencing analysis of the nifH gene. Each of the six RNA libraries (3 treatments × 2 depth soil) was labeled with a unique oligonucleotide barcode and pyrosequenced using 454 GS FLX technology. Pyrosequencing data were processed as previously described by Collavino et al. (2014). Briefly, short‐ and low‐quality sequences (Q value = 30), putative frame shifts, and chimeras were removed from the database. Remaining high‐quality sequences were clustered with OTUs defined at 98% amino acid sequence similarity, as discussed in Collavino et al., 2014. OTUs with at least three sequences were selected and their relative abundance was normalized using the subsampling‐based method described in mothur (http://www.mothur.org/wiki/Normalize.shared) prior to comparative analyses. OTU representative amino acid sequences along with sequences selected from the nifH reference database (http://wwwzehr.pmc.ucsc.edu/nifH_Database_Public/) were used to build protein phylogenetic trees.
The sequences obtained in this study have been deposited in the NCBI‐SRA (Sequence Read Archive) with the submission ID SRP029166 and BioProject ID PRJNA214426.
2.4. Taxa‐specific qPCR of nifH
Primers were designed to amplify the nifH sequences of two abundant phylotypes of the ADC classified within the subclusters 1A (related to Geobacter) and 1B (related to Nostoc). Target sequences were aligned and visually compared using the Jalview v2. The target OTUs 1A for phylotypes related to Geobacter (8, 22, 27, 53, 380, and 488) were amplified with GeoFw 5′ GCC AAR GCG CAG AAT ACG GT 3′ and the reverse primer nifH2 (Zehr & McReynolds, 1989). The OTU 1B (755) was amplified with cyanoFw 5′ TGG TAT CAT CAC CGC CAT CAA CTT C 3′ and cyanoRev 5′ GAA TTG GCA TAG CGA AAC CAC CG 3′. The amplicon size was 314 bp and 116 bp for phylotypes 1A and 1B, respectively. Theoretical calculations for primer concentrations and annealing temperatures (Ta) for each pair of primers were determined using the web tool OligoAnalyzer in IDT DNA (https://www.idtdna.com/calc/analyzer). Primers were experimentally evaluated through PCR amplification of DNA from Geobacter and Nostoc, as well as from other phylogenetic distant diazotrophs (e.g., Herbaspirillum sp., Burkholderia sp., Azotobacter sp., and Gluconacetobacter sp.). Amplification with cyanobacterial primers showed the expected amplicon size (116 bp) in soil samples as well as in Nostoc DNA (Fig. S4A). The PCR reaction consisted of 1 μl DNA (10 ng/μl), 0.2 μmol/L of each primer, 1.25 U Go Taq (Promega), Buffer Go Taq 10X, 2.5 mmol/L MgCl2 (Promega), and ultrapure water (Promega) up to 25 μl. Cycling conditions were 5 min at 95°C, followed by 30 cycles of 1 min at 94°C, 1 min at 60°C and 2 min at 72°C, and a final step of 10 min at 72°C. No amplification was detected in other phylogenetic distant diazotrophs under these PCR experimental conditions (Fig S4A).
The optimization of PCR conditions, annealing temperature, and the amount of template were necessary to improve efficiency and specificity for the amplification of nifH genes related to Geobacter. PCR reaction consisted of 1 μl DNA (5 ng, 10 ng, and 15 ng), 0.2 μmol/L of each primer, 1.25 U Go Taq (Promega), Buffer Go Taq 10X, 2.5 mmol/L MgCl2 (Promega), and ultrapure water (Promega) up to 25 μl. The cycling conditions were 5 min at 95°C, followed by 30 cycles of 1 min at 94°C, 1 min of Ta (57–58–59°C), and 2 min at 72°C, and a final step of 10 min at 72°C. The expected amplicon size of 314 bp was clearly visualized in the environmental samples with all the amounts of template tested, but with higher efficiency at 10 ng/μl of template (data not shown). Amplification was observed using 57°C and 58°C of Ta (Fig. S4B), whereas no amplification was detected in some environmental samples at 59°C (Fig. S4B, line 6). The amplification of Geobacter sp. DNA showed additional bands using 10 ng/μl or 15 ng/μl of template in all Ta evaluated (Fig. S4B, lines 13, 14, and 15). These spurious bands were eliminated by reducing the amount of template to 5 ng and using 57°C or 58°C of Ta (Fig. S4C). Therefore, Herbaspirillum sp., Burkholderia sp., Azotobacter sp., and Gluconacetobacter sp. were amplified using 5 ng of template and 57°C or 58°C of Ta. As shown in Fig. S4D, nonamplification was detected in the DNA tested at both Ta, except for Gluconacetobacter sp. which amplified at 57°C but not at 58°C of Ta. Finally, the PCR conditions used for the amplification of nifH gene with primers GeoFw‐nifH2 were 58°C of Ta using 5 ng/μl and 10 ng/μl for strain DNAs and environmental samples, respectively. It should be mentioned that GeoFw has only one A‐G primer–target mismatch at nucleotide position 8 with respect to nifH from G. diazotrophicus (Genbank accession AF105225), nevertheless non‐nifH gene amplification was detected from G. diazotrophicus DNA in the optimized PCR conditions (Fig. S4D). In addition, the specificity of the set GeoFw‐nifH2 primers in the environmental samples was analyzed by sequencing the amplified products. nifH amplicons generated from the different treatment and depth samples were pooled, an aliquot of 100 ng was purified using a commercial kit (NucleoSpin® Extract II, Macherey‐Nagel) and cloned using the TOPO‐TA pCR2.1 kit (Invitrogen) according to the manufacturer's conditions. A total of 52 clones were sequenced using capillary‐based Sanger sequencing method. Nucleotides sequences were identified using blastX against NCBI database. The best match for all sequences corresponded to nifH sequences related to Geobacter species with identity values >97% (data not shown), which would indicate that using the GeoFw‐nifH2 primers in our environmental samples the largest proportion of amplicons corresponds to Geobacter nifH sequences. The sequences obtained were deposited in NCBI reservoir under GenBank accession numbers KY941188 to KY941239.
The relative abundance of the selected phylotypes was quantified by qPCR using as a template the DNA extracted from the same soil samples selected for the analysis of nifH‐RNA. The qPCR reactions contained 10 ng of soil DNA, 0.8 μl of each primer (5 μmol/L), 10 μl of 2× SYBR Green iCycler iQ mixture (Bio‐Rad), and water ultrapure for 20 μl final reaction volume. The reaction was carried out in the thermocycler Applied Biosystems 7,500 Real‐time PCR system (Applied Biosystems). The thermocycling program has the following parameters: initial denaturing at 95°C for 10 min, followed by 40 cycles of 95°C for 15 s, followed by an annealing step at 60°C (group 1B)/58°C (group 1A) for 20 s, and a final elongation step at 72°C for 20 s. Nontemplate controls were included in all runs. Fluorescence was measured at the end of each cycle. 16S rRNA gene abundances quantified by qPCR using universal primers 338F‐518R (Park & Crowley, 2005) were employed to normalize the nifH values between the different samples. The relative levels of the nifH were calculated using the tool GENORM (https://genorm.cmgg.be/). All qPCR reactions were run in duplicate with DNA extracted from two biological replicates, and the melting curve of each run was analyzed to ensure the proper development of amplification cycle.
2.5. Soil physical and chemical characterization
General soil properties were determined in crushed and 2 mm sieved samples (“fine earth”): pH (1:2.5 soil:water) by potentiometry, organic carbon (OC) by dry combustion method using a LECO CR12 19 equipment, and electric conductivity (EC) with a conductimeter. The cation exchange capacity (CEC) was measured at pH 7 with ammonium acetate by extraction with potassium chloride (Chapman, 1965). Particle size distribution was measured by means of the Robinson's pipette method for the clay and silt fractions and by sieving for the sand fractions (Soil Conservation Service, 1972). Total Nitrogen (TN) was measured by the Kjeldahl method (Bremner, 1996) and extractable phosphorous was determined by the method of Bray and Kurtz (1945).
Soil bulk density (BD) was determined by the core method (Blake & Hartge, 1986) using 138.5 cm3 volume cores (n = 9). Three samples were obtained for each depth at each subsampling area for the three treatments assessed (treatment n = 27). Aggregate stability was determined with fast immersion in water (slaking process) according to Le Bissonnais (1996). Thus, three undisturbed soil cores (6,000 cm3) were taken from the topsoil (0–15 cm) from each sampling unit. Results are presented as mean weight diameter (MWD).
The soil–water retention curve was measured in undisturbed soil samples (cores, 135 cm3) at matric suctions of 10, 30, 60, 90, 330, 2,000, and 15,000 cm in a pressure plate apparatus (Klute, 1986) with depths of 0–10 and 10–20 cm (n = 27). Water moisture and matric suction pairs were fitted to Van Genuchten (1980) water retention model, according to equation (1), considering the Mualem restriction m = 1‐1/n (Mualem, 1986). This procedure was done with RETC software (Van Genuchten, Leij, & Yates, 1991), using nonlinear least squares optimization, reaching in all cases parameters estimations above R2>0.96.
| (1) |
where θg (kg kg−1) is gravimetric water content, θgs (kg kg−1) is the saturated gravimetric water content, θgr (kg kg−1) is the residual gravimetric water content, θ (−) is the normalized water content, and α, n, and m are empirical curve‐fitting parameters.
Different pore sizes, >300 μm (PMac>300) and <50 μm (PMic<50) corresponding to large macroporosity and microporosity (Reynolds et al., 2002), respectively, were obtained with the fitted water retention curves (equation (2), (3)) considering Or and Wraith (2000) equation.
| (2) |
| (3) |
where θs is 0 water potential (saturation).
For each sample, a pore volume distribution function was determined according to Reynolds, Drury, Tan, Fox, and Yang (2009) and Shahab, Emami, Hagnia, and Karimi (2013) with a further normalization of this function to allow the comparison between different soil samples. Pore volume distributions can be characterized using location and shape parameters (Reynolds et al., 2009), where the location parameters include the mode (Dmode), median (Dmedian), and mean (Dmean) pore diameter values, and the shape parameters include standard deviation of porosity volume (Por. SD), skewness (asymmetry), and kurtosis (peakedness).
Dmode corresponds to the inflection point of the pore volume distribution function, being this location with the most frequent pore diameter value. Por. SD quantifies the size range of equivalent pore diameters, where Por. SD = 1 indicates pore diameter homogeneity while high Por. SD indicates an increase in equivalent pore diameters range. Skewness = 0 indicates a lognormal distribution. While negative values indicate high numbers of small pores, positive values indicates high number of large pores. Kurtosis = 1 corresponds to a lognormal distribution; values > 1 indicate a “leptokurtic” distribution which is more peaked in the center and more tailed in the extremes than the lognormal curve, whereas values < 1 indicate a “platykurtic” distribution which is less peaked in the center and less tailed in the extremes than the lognormal curve (Reynolds et al., 2009).
2.6. Statistical data analysis
The α‐diversity of the active diazotrophic community was evaluated by rarefaction curves with the rarefaction single Mothur command using resampling without replacement approach (Schloss et al., 2009). The estimators of richness (Chao1, SChao1) and diversity Shannon–Wiener (H’) were calculated from the OTUs normalized abundance matrix using Past3 program (Hammer, Harper, & Ryan, 2009). To determine the significance of richness, diversity, and nifH relative abundance across treatment‐depth samples, one‐way and two‐way ANOVA models coupled with Tukey's multiple comparison of means were applied with the statistical package InfoStat version 2011 (Di Rienzo et al., 2008). For comparative analysis of the composition between samples (β‐diversity) two measures of dissimilarity were applied. Bray–Curtis measure (Bray & Curtis, 1957) was calculated from the abundance of nifH subclusters while weighted normalize UniFrac measure (Lozupone, Lladser, Knights, Stombaugh, & Knight, 2011) was applied on the abundance and phylogeny of the nifH OTUs. These measures were calculated using Past3 program and online Unifrac program (http://unifrac.colorado.edu/), respectively. Principal Coordinate Analysis (PCoA) was used to visualize the variation in ADC composition across treatment–depth samples.
Associations between physical and chemical soil variables (pH, Pe, TN, OC, CEC, BD, PMac>300, PMic<50, Dmode, Dmean, and Por. SD), estimators of richness and evenness (SChao1 and H’, respectively), were assessed by principal component analysis (PCA) performed on the correlation matrix.
All location and shape of pore volume distribution curve variables and PMac>300 were transformed (Log10) as they did not attain normality (Shapiro–Wilkis, p < .05). Kurtosis could not be normalized with standard methods therefore only descriptive data are presented.
3. RESULTS AND DISCUSSION
3.1. Diversity of the active diazotrophic community
We were able to synthesize and subsequently PCR amplify nifH‐cDNA from total RNA extracted from two soil depths (topsoil: 0–10 cm, subsurface soil: 10–20 cm). We assume that this cDNA represents the functional community of free‐living nitrogen‐fixing microorganisms, and hereafter we will refer to this as the active diazotrophic community (ADC). For each soil depth, the ADC was examined in two different no‐till agricultural managements (GAP and PAP for good and poor agricultural practices, respectively). Natural grassland close to the cultivated plots was used as reference (NE for natural environment). After sequencing and processing data, a total of 80 787 reads, comprising 28 171 protein‐encoding nifH genes were obtained and used to define 437 OTUs with a cutoff of 98% similarity at amino acid level. These nifH encoding sequences formed the nifH‐cDNA database and were used to calculate richness and diversity.
The ADC diversity was assessed using rarefaction curves and estimators of richness (SChao1) and evenness (H’) (Fig. S1 and Table 1). According to SChao1 the relative coverage across the six samples ranged between 66% and 100% (Table 1). Most of rarefaction curves nearly reached asymptote, indicating that a substantial part of the active diazotrophs diversity was recovered from our sampled soils. The evenness and richness of the ADC were both strongly affected by the agricultural use. It is the nondisturbed soil (NE) that showed the highest levels of diversity (H’) and richness (SChao1) at both depths (Table 1). Two‐way analysis of variance (ANOVA) indicated a significant interaction effect between treatment and depth (r 2 = 1, p = 1e−4 for H’ and r 2 = 0.98, p = 1e−4 for SChao1). Diversity in NE and GAP soils was higher in the first 0–10 cm than at 10–20 cm (p = 3e−4 for NE depths and p < 1e−4 for GAP depths), whereas in PAP the highest H’ was found in the 10–20 cm depth (p < 1e−4).
Table 1.
Sample coverage and diversity indices for nifH‐cDNA libraries
| Depth (cm)/management | SeqN | SeqNn | Sobs | H′ | SChao1 | RChao1 |
|---|---|---|---|---|---|---|
| 0–10 | ||||||
| NE | 3,983 | 3,151 | 231 | 3.96 f | 245 d | 94 |
| GAP | 6,265 | 3,159 | 67 | 1.12 c | 67 b | 100 |
| PAP | 4,997 | 3,159 | 20 | 0.11 a | 27 a | 74 |
| 0–20 | ||||||
| NE | 3,335 | 3,159 | 166 | 3.32 e | 183 c | 91 |
| GAP | 4,463 | 3,159 | 33 | 0.37 b | 50 ab | 66 |
| PAP | 5,128 | 3,159 | 143 | 2.57 d | 175 c | 82 |
| Management | *** | *** | ||||
| Depth | NS | NS | ||||
| Management × Depth | *** | *** | ||||
The richness estimator (SChao1) and Shannon's diversity index (H′) were calculated with OTUs defined at 98% amino acid sequence similarity. SeqNn, normalized number of sequences per sample; Sobs, detected number of operational taxonomic units (OTUs) at 2% distance level; RC, relative coverage calculated as OTU number divided by estimated richness (SChao1). Different lowercase letters indicate statistical differences based on one‐way ANOVA (Tukey test, p < .05). Significant differences in the interaction (*** p < .001). NS, not significant.
Therefore, these results suggest that ADC diversity and richness in soil are negatively affected by both the soil management practices studied, relative to the nearby nondisturbed soils. Moreover, the diazotrophic diversity seems to be influenced by depth albeit dependent of the agricultural soil use.
In addition, we compared the diversity of the ADC with the potential community previously described after pyrosequencing DNA‐nifH from the same site (Collavino et al., 2014). For this purpose, reads from cDNA of nifH were pooled across depths. The primers used for DNA and cDNA pyrosequencing were different, and we cannot rule out that primer bias could be affecting the results; however, both sets of primers targeted the same nifH conserved region. As shown in Fig. S2, no significant difference in H’ was found between the potential (DNA) and active (RNA) communities of uncultivated soils (p = .367). In cultivated soils, however, the diversity of potential community was significantly higher than the ADC (p < 1e−4 and p = 2e−3 for GAP and PAP, respectively). Moreover, a lower number of OTUs (229 in GAP and 173 in PAP) was observed in the cultivated soils of ADC compared to those observed in the potential community (361 in GAP and 381 in PAP). We have previously reported that richness and diversity of the potential diazotrophic community were not affected by soil management practices (Collavino et al., 2014). The diversity difference among potential and active diazotrophic community suggests that while no‐tillage management seems not to affect the presence of potential N2 fixers, but does influence nifH expression of some of them.
Fierer et al. (2012) compared microbial diversity of two soils, one with successional grassland and the other with agricultural use, and observed relative lower diversity in the agricultural site as compared to the grassland site. It is possible to speculate that soils having more plant diversity could promote higher bacterial diversity as in the case of NE with natural indigenous grasses, as compared with soils of either soybean–maize rotation (GAP) or soybean monoculture (PAP).
Eilers and colleagues evaluated the effect of soil depth on the structure of Bacteria and Archaea communities by 16S rRNA pyrosequencing, noting that diversity is greater in the first 10 cm compared to 10–25 cm and 175 cm, decreasing by 20% and 40%, respectively (Eilers, Debenport, Anderson, & Fierer, 2012). Similar results using techniques of DNA fingerprinting showed a decrease in bacterial diversity in deeper layers of soil (Agnelli et al., 2004; Fierer, Schimel, & Holden, 2003; Will et al., 2010). In addition, an increase in total bacteria diversity and transcription activity in the waste surface horizon compared with the organic horizon was found in coniferous forest soils over a period of decomposition of organic matter (Baldrian et al., 2012). Together, these studies indicate that bacterial community diversity tends to decrease in the lowest soil depths, which is also found in the case of the ADC examined in this work except for soil samples under PAP. As detailed later, richness and diversity were correlated with physical parameters related to pore type and stability (Figure 5). The topsoil of PAP showed the lowest structural condition mainly due to a decrease in their aggregate stability, which could be explaining the opposite trend of diversity in relation to depth observed in this treatment. Also, the excessive use of agrochemicals could be affecting the presence of certain groups (e.g., OTUs related to Bradyrhizobium, as detailed below) and thus decreasing diazotrophic topsoil diversity.
Figure 5.
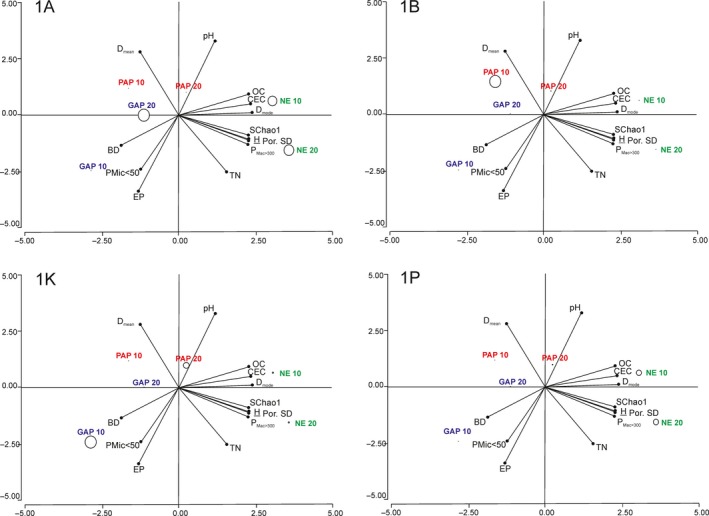
Proportion of nifH phylotypes related to diversity, treatment, depth, and soil physicochemistry. The proportions of subclusters 1A, 1B, 1K, and 1P are indicated by circle size at each sample point plotted on the first two principal components of the soil physicochemical parameters, richness, and diversity indexes (represented by lines). Component 1 (horizontal axis) covers 61.7% (mainly by Dmode: 0.34, CEC: 0.34, and H: 0.33) and component 2 (vertical axis) covers additional 20.1% of variation (mainly by pH: 0.48, Pe: ‐0.47) of the variance. Richness and diversity are represented by SChao1 and H, respectively. The different land‐type use is coded by different colors (green for NE, blue for GAP, and red for PAP)
3.2. Comparison of diazotrophic communities across contrasting agricultural soil management and depth
Patterns of ADC β‐diversity across all samples were examined using principal coordinate analysis (PCoA) with weighted UniFrac distances and Bray–Curtis dissimilarities. The results of both analyses showed similar ordinations and groupings between soil samples as well as a high percentage of total variance explained (PC1 47.5% for UniFrac and 55.8% for Bray–Curtis). As shown in Figure 1 for weighted normalized UniFrac analysis (Bray–Curtis‐based ordinations are not shown), PC1 and PC2 appear to group together the two NE depths and the 20 cm of GAP, whereas PAP 20 cm and GAP 10 cm group separately. PC1 and PC2 clearly put PAP 10 cm separate from all samples. This ordination shows that GAP diazotrophic communities have similarities with those of PAP and NE, while NE and PAP samples are distantly arranged between them. The PAP management, consisting in soybean monoculture and nonsustainable practices, has a noticeable effect on the ADC structure at both depths compared to that of soil under intensive crop rotation practice (GAP) and noncultivated soil (NE). Similarly, it has been shown by Rosa et al. (2014) that PAP management compared to NE presented an important effect on the size and the functioning of the denitrification community in Argentinean cropping fields. Moreover, PCoA plots show that samples from 0 to 10 cm are more dissimilar than samples from 10 to 20, given by the proximity in the plot. This is also reflected in the lower number of OTUs shared among all the 0–10 cm samples (3 OTUs) compared to those shared in the 10–20 cm samples (11 OTUs). The topsoil, expected to have more physical and chemical disturbances due to the agricultural practices, showed the most different diazotrophic community between treatments.
Figure 1.
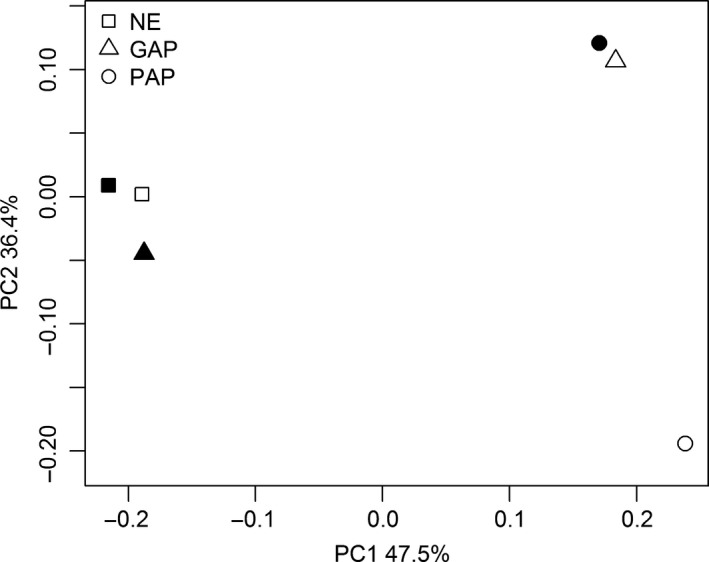
Relationship among diazotrophic communities examined by principal coordinate analysis (PCoA) using weighted UniFrac distance matrix. Closeness on the scatter plot indicates similarity between samples in terms of OTUs proportions and phylogeny. The communities under different agricultural use are coded by different symbols: square for NE, triangle for GAP, and circle for PAP. Depths 0–10 cm and 10–20 cm are, respectively, shaded in white and black
3.3. Composition of the active diazotrophic community of soil
The 437 distinct OTUs obtained from Pergamino soils were assigned into the four major clusters and the 17 subclusters that comprise the nifH phylogeny as previously defined by Zehr et al. (2003). The most abundant group across the entire nifH‐cDNA database was subcluster 1A (44.8%) composed by sequences related to Anaeromyxobacter and Desulfuromonadales (Table 2). Other dominant taxa were as follows: Alphaproteobacteria from subcluster 1K (29%) represented by rhizobiales sequences, Cyanobacteria from subcluster 1B (16.7%) related to the Nostocales, and Verrucomicrobiales and Desulfovibrionales from subcluster 3B (8%). The remaining nifH subclusters represented less than 1% of the total sequence count (Table 2).
Table 2.
Composition of phylotypes in nifH‐cDNA amplified from Pergamino soils
| % | Group | Orderd | |||
|---|---|---|---|---|---|
| Sequence counta | OTU countb | Distributionc | |||
| Subcluster | |||||
| 1 | 0.1 | 0.5 | 33 | Epsilon | Campylobacterales |
| 1A | 44.8 | 48.5 | 83 | Delta | Myxococcales and Desulfuromonadales |
| 1B | 16.7 | 2.3 | 50 | Cyanobacteria | Nostocales |
| 1C | 0.6 | 1.1 | 50 | Firmicutes | Clostridiales |
| 1E | 0.2 | 0.7 | 33 | Firmicutes | Bacillales |
| 1G | 0.05 | 0.2 | 50 | Gamma | Pseudomonadales and Enterobacteriales |
| 1J | 0.4 | 1.1 | 83 | Alfa and Beta | Rhizobiales and Rhodospirillales |
| 1K | 29.0 | 24.7 | 100 | Alfa | Rhizobiales |
| 1O | 0.05 | 0.2 | 17 | Gamma | Chromatiales |
| 1P | 0.2 | 1.1 | 67 | Beta | Rhodocyclales |
| 3B | 8.0 | 19.5 | 67 | Delta and Verrucomicrobia | Desulfovibrionales and Verrucomicrobiales |
Percentage of sequences of nifH‐cDNA database assigned to each nifH subcluster.
Percentage of OTUs classified in each nifH subcluster.
Presence across the six samples analyzed (e.g., subcluster present in all samples shows a distribution of 100%).
Orders closest to the predominant sequences observed in the subcluster.
The diazotrophic community composition was mostly similar at both depths of the uncultivated soil (NE) as shown in Figure 1, in which populations that belong to subclusters 1A (79% to 87%) and 1K (11%) were highly represented (Figure 2). Also, the underrepresented subclusters (with < 1% of the total sequences) were mainly found at both depths of uncultivated soils. Contrarily, in cultivated soils the community composition showed strong differences in relation to soil depth and management practices. In GAP soils, subcluster 1K (99.4%) and 1A (99.3%) were dominated at the topsoil and subsurface, respectively (Figure 2). In PAP soils, subcluster 1B was predominant (98.8%) in the topsoil, whereas subclusters 1K (51.6%), 3B (45%), and 1A (3%) were found in the subsurface (Figure 2).
Figure 2.
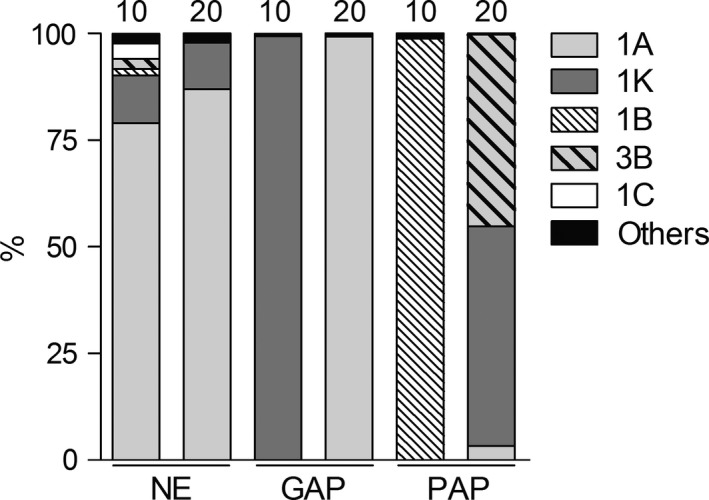
Distribution of the nifH subclusters across treatments and depths. Subclusters with a representation above 1% are shown, whereas subclusters with a representation <1% are shown together in “Others”. Different treatments are indicated as NE, natural environment, GAP, good no‐till agricultural practices, and PAP, poor no‐till agricultural practices. Depth 0–10 and 10–20 cm are labeled as 10 and 20, respectively
Sixteen OTUs were represented by more than 100 sequences each and accounted for 53% of the total nifH‐cDNA database. These abundant OTUs were distributed among subclusters 1A (11 OTUs), 1K (3 OTUs), 1B (1 OTU), and 3B (1 OTU), as shown in Figure 3.
Figure 3.
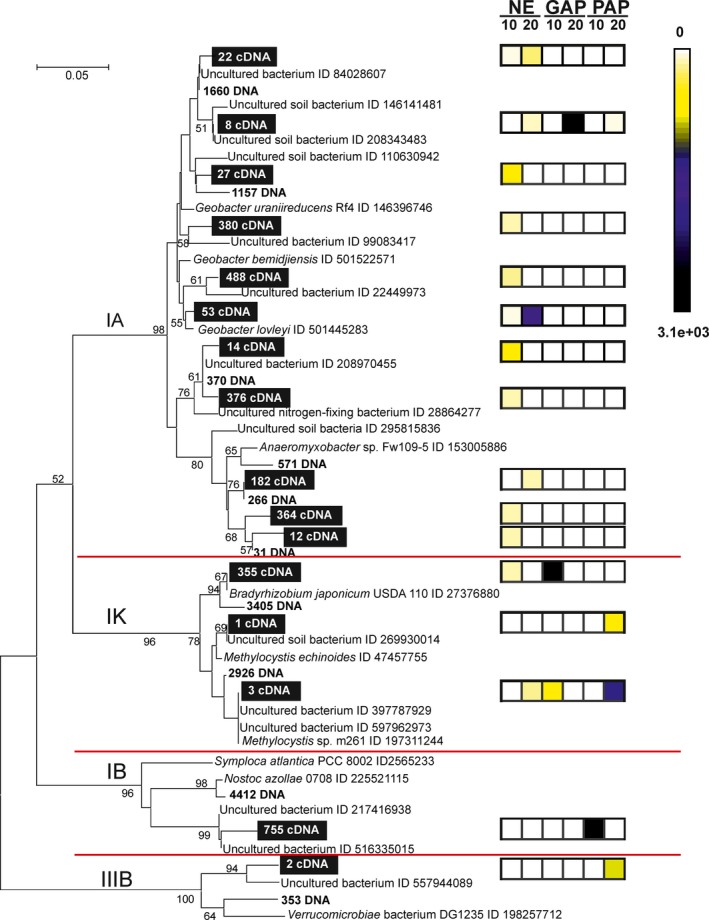
Neighbor‐joining phylogenetic tree of partial amino acid nifH sequences of the 16 most abundant OTUs. The abundant OTUs are identified with numbers within black boxes. OTUs in bold were obtained from DNA of Pergamino according to previous work described by Collavino et al. (2014). The diagram in the right margin showed the number of normalized nifH sequences assigned to each OTU in the different depth–treatment sample. Canonical nifH subclusters are indicated to the left in the figure. Only bootstrap values >50% are shown
Six OTUs belonging to subcluster 1A, representing about 28% of the database, were related to Geobacter species (G. uraniireducens and G. bemidjiensis, and G. lovely). Noteworthy, except for OTU 8, all abundant 1A OTUs were found mainly in NE and showed a differential depth distribution (Figure 3). Particularly, OTU 8 highly represented in GAP 20 cm depth was closely related to G. uraniireducens and nifH clones reported as uncultured soil bacteria (Buckley et al., 2007; Hsu & Buckley, 2009). The sequences of these clones were obtained by an experimental approach using 15N‐stable isotopic probing (Buckley et al., 2007; Hsu & Buckley, 2009). As this approach relies on N‐fixation activity, and our study is based on cDNA analysis, altogether these findings suggest that populations closely related to anaerobic facultative Geobacter sp. could be important functional components in free‐living N2 fixation in soil.
The OTUs classified within subclusters 1K, 1B, and 3B were highly represented in cultivated soils and showed a differential distribution across depth (Figure 3). The 1K OTUs represented 25% of the nifH‐cDNA database and fell in two groups related to rhizobiales sequences. Particularly, OTU 355 more closely related to B. japonicum USDA 110, a broadly used strain in soybean commercial inoculants, was found mainly in the topsoil of GAP. Although, both GAP and PAP have soybean crop with Bradyrhizobium exogenous inoculation, the more stressing conditions by the use of agrochemical and nonnutrient replacement may affect the survival of Bradyrhizobium in PAP soil.
There is an increasing understanding that N2 fixation mediated by rhizobia is not limited to symbiotic association with leguminous plant host. Transcripts of nifH gene phylogenetically related to Bradyrhizobium and Rhizobium sp. have been found in endophyte community of rice and sugarcane roots (Burbano et al., 2011; Sessitsch et al., 2012). A high‐throughput study of the ecological profile of diazotrophic communities from soil lacking legumes revealed several nifH sequences related to Bradyrhizobium and Rhizobium (Wang et al., 2013). Wang and collaborates proposed that rhizobia could have a wide range of lifestyles, including that as a free‐living N2 fixer. Alternatively, it is possible to speculate that yet uncharacterized microorganisms may have received the nifH genes of rhizobia by horizontal transfer.
The remaining 1K OTUs related to the methanotrophic Methylocystis sp. were found mainly in the cultivated soils (Figure 3). This group has been reported as abundant soil diazotrophs (Collavino et al., 2014; Duc et al., 2009), likely due to its adaptive advantage to grow in soils with low organic matter content plus the dependence on the fermentation products of root exudates or crop retention residues (Buckley, Huangyutitham, Shi‐Fang, & Tyrrell, 2008).
The OTU 755 belonging to subcluster 1B, more similar to uncultured soil sequences and distantly related (83% similarity) to the heterocyst‐forming cyanobacteria Nostoc azollae, was the most abundant OTU in the database (16.4%) and found only in the topsoil of PAP (Figure 3). The cyanobacterial clade is a relevant diazotrophic group not only in aquatic environments (Bullerjahn & Post, 2014; Goebel, Edwards, Church, & Zehr, 2007; Zehr & McReynolds, 1989) but also in soil (Cavacini, 2001; Duc et al., 2009; Irisarri, Gonnet, & Monza, 2001; Teng et al., 2009; Yeager et al., 2007). Recently, the importance of this clade in N2‐fixation activity in Guerrero Negro intertidal microbial mats has been shown (Woebken et al., 2015). These surveys indicate the widespread distribution of N2‐fixing cyanobacteria and their active role in the functioning of various ecosystems including soils.
The OTU 2 classified in the subcluster 3B was mostly related to nifH sequences of noncultivated soil bacteria (Hoppe et al., 2014), but also to a certain extent to sequences from Verrucomicrobiales (82% similarity). This OTU was only found in the subsurface of PAP samples (Figure 3). The phylum Verrucomicrobia includes members that are ubiquitous and abundant in diverse habitats, including soil, water, and sediments (Kielak, Pijl, Van Veen, & Kowalchuk, 2008; Kielak et al., 2010; Sangwan, Chen, Hugenholtz, & Janssen, 2004), and their representatives are preferentially found in the 10–50 cm depth of some soils (Bergmann et al., 2011; Eilers et al., 2012).
The abundant OTUs in the nifH‐cDNA database showed various degrees of identity with GenBank nifH sequences, and the novelty of several phylotypes is highlighted, possibly as key players in the process of soil N fixation. We also identified phylotypes linked to particular treatments and/or depth (e.g., Geobacter, Cyanobacteria, and Verrucomicrobia).
3.4. qPCR of specific nifH phylotypes
In order to evaluate the data obtained from deep sequencing of nifH‐cDNA, the abundance of two particular members of the N2‐fixing microbial communities in Pergamino soils was assessed by qPCR. Primers were designed and preliminary experiments were performed to define conditions that specifically amplify nifH sequences related to Geobacter and Cyanobacteria, respectively (Fig. S4).
As shown in Figure 4, the nifH gene copies of the phylotypes related to Geobacter was significantly different between NE and GAP (p = .009) and depths (p > .03). The pattern of relative abundance of Geobacter nifH resulting from qPCR analysis and the one revealed in the ADC were found similar to each other. Thus, it was higher in the subsurface of both NE and GAP soils with significant difference in the latter (p = 1e−4), which suggests that this phylotype related to Geobacter may be adapted to grow at a deep layer of soil where anaerobic environment could facilitate expression of nitrogenase. It has been reported that members of the Geobacter clade are able to use the facultative anaerobic respiration (Lovley et al., 2011) as well as to express nitrogen‐fixation gene nifD in subsurface sediments (Holmes, Nevin, & Lovley, 2004). By contrast, the group was not detected in PAP samples (Figure 4). This treatment that has low nutrient addition could negatively affect the presence of this heterotrophic group.
Figure 4.
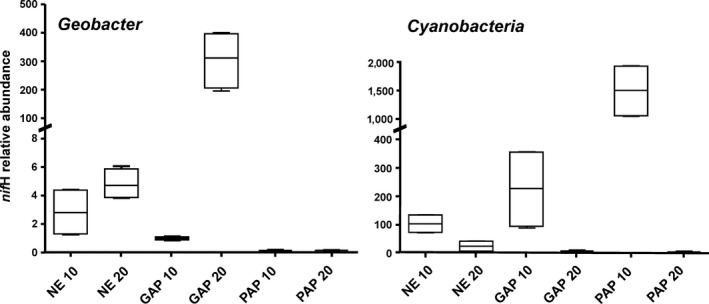
Quantitative abundance of nifH phylotypes related to Geobacter and Cyanobacteria in Pergamino soil samples as determined by qPCR. Level of nifH copies is shown as relative units normalized to 16S rRNA gene abundance. A value of 1 was assigned to the samples with the lowest detected value (GAP 0–10 cm and NE 10–20 cm to Geobacter and Cyanobacteria, respectively). Depth 0–10 and 10–20 cm are labeled as 10 and 20, respectively. Nondetectable nifH related to Geobacter and Cyanobacteria resulted in the PAP treatment and in the subsurface of cultivated soils, respectively. Boxes display the range of two biological and two technical replicates
Cyanobacterial nifH gene was detected in the topsoil of all treatments with higher value in PAP sample (r 2 = 0.85, p = 2e−4), whereas it was only detected at lower abundance in the subsurface of NE (p = .009) (Figure 4). Occurrence of Cyanobacteria in the topsoil could be linked to the fact that this layer presents beneficial environmental conditions for photosynthetic activity and aerobic metabolism (Whitton & Potts, 2000).
Overall, these results together with those from nifH‐cDNA suggest that phylotypes related to Geobacter and Cyanobacteria could be considered important players of the free‐nitrogen fixation in agricultural soils.
3.5. Land‐use, edaphic properties, and active diazotrophic community
The physical and chemical characteristics of the land‐use types are presented in Table 3. No granulometric differences were observed across the soils examined. Tendency of OC was NE>PAP>GAP (Table 2). High OC at both sampling depths of NE (data not shown) could be explained by the lack of disturbance and the presence of active roots the year‐round (Novelli et al., 2011; Six, Elliott, Paustian, & Doran, 1998).
Table 3.
Texture and chemical properties of soils for management treatments (0–20 cm)
| Management | Granulometry | EC | pH | CEC | BS | OC | TN | EP | ||||||||||||
|---|---|---|---|---|---|---|---|---|---|---|---|---|---|---|---|---|---|---|---|---|
| Clay | Silt | Sand | mS cm−1 | 1:2.5 | cmolc Kg−1 | (%) | (%) | (%) | ppm | |||||||||||
| (<2 μm) | (2–50 μm) | (>50 μm) | ||||||||||||||||||
| g Kg−1 | ||||||||||||||||||||
| NE | 218 | 0.6 | 623 | 0.2 | 15.9 | 0.4 | 0.36 | 0.03 | 5.7 | 0.1 | 18.9 | 0.9 | 72.8 | 2.8 | 1.8 | 0.2 | 0.19 | 0.05 | 3.6 | 1.7 |
| GAP | 228 | 1.5 | 602 | 1.5 | 16.9 | 0.3 | 0.39 | 0.02 | 5.5 | 0.1 | 17.1 | 1.0 | 71.6 | 2.1 | 1.3 | 0.1 | 0.14 | 0.02 | 10.5 | 8.2 |
| PAP | 211 | 1.6 | 643 | 0.9 | 14.6 | 0.7 | 0.26 | 0.04 | 6.2 | 0.0 | 18.0 | 0.7 | 80.3 | 3.8 | 1.6 | 0.0 | 0.14 | 0.01 | 1.5 | 0.8 |
CEC, Cation exchange capacity; EC, electrical conductivity; OC, total organic carbon; TN, total nitrogen; EP, extractable phosphorus, BS, Base saturation. Granulometric and chemical variables were not significantly different by depth; therefore, average values (0–20 cm) are presented. Treatments are labeled as: NE, natural environment; GAP, good no‐till agricultural practices; PAP, poor no‐till agricultural practices. Underlined values indicate standard error.
Location and shape porosity curve variables were affected by management practices, but not by depth (Table S1). Pore diameter values (Dmode), statistical distribution of the pores (Por. SD), and the nonnormality pore size distribution (Skewness) were significantly higher in NE than cultivated soils (Table S1). Por.SD of this treatment largely exceeds the expected optimal ranges proposed by Shahab et al. (2013) indicating that diverse sizes of pore diameter are present in NE. Macroporosity (PMac>300) showed a significant interaction between treatment and depth. In GAP and NE soils the higher values were observed in the first 0–10 cm, whereas in PAP the highest value was found in the 10–20 cm depth (Table S2). Bulk density (BD) was different between land‐use types and the highest values were found in the agricultural soils (Table S2). High BD values and the occurrence of platy structures (Kraemer et al., 2017) can cause worse porosity conditions in GAP and PAP compared to NE. Moreover, aggregate stability (fast water immersion) from NE was significantly higher (MWD: 2.00 mm) than the agricultural treatments (p < .05), whereas GAP (MWD: 0.50 mm) presented higher aggregate stability with respect to PAP (MWD: 0.38) without statistical significance.
The relationships between the diversity of the ADC and edaphic soil properties are shown in Figure 5. Diversity and richness appear to be mainly driven by several edaphic properties that characterize the NE soils. These properties include Dmode, Por.SD, CEC, and OC. Diversity also shows significant correlations with hydrophobicity (Letey, 1969) (r = .9, p = .015), aggregate stability (r = .82, p = .04), and soil visual quality assessment (Ball, Batey, & Munkholm, 2007) (r = −.8, p = .05). Interestingly, a high proportion of subclusters 1A and 1P (one of the underrepresented subclusters) was found associated with NE soils conditions (Figure 5). Moreover, as mentioned previously, all the nonabundant nifH subclusters were mainly represented in NE soils (Figure 2). Diversity of bacterial communities as well as activity and microscale distribution are affected by pore structure (Carson et al., 2010; Chau, Bagtzoglou, & Willig, 2011; Nunan et al., 2003). In addition, more structured soil favors bacterial survival by offering them a higher diversity of physical habitats (Chenu & Cosentino, 2011).
Also, the correlation between diversity and OC has been found while examining the diversity of nifH‐DNA sequences from the same soils (Collavino et al., 2014). It has been found that OC increases the abundance, diversity, and activity of soil diazotrophic communities, which may be explained by the promotion of heterotrophic N2‐fixing bacteria in a niche with more available carbon (Billings, Schaeffer, & Evans, 2003; Huhe et al., 2014; Orr, James, Leifert, Cooper, & Cummings, 2011).
The topsoil of PAP was found related to higher average pore size (Dmean) values in opposition to Dmode and PMac>300, indicating an association with small diameter pores (Figure 5). Proportion of the cyanobacterial subcluster (1B) increased under this management (Figure 2 and Figure 5), suggesting that the niche occupied by phylotypes related to Cyanobacteria is characterized by strong fluctuation in water regime (oxic and anoxic environment). Water regime fluctuations are often affected by depth, and this condition and the great light exposure on the topsoil could be explaining the strong abundance differences in this subcluster observed throughout both sampling layers in PAP (Figure 2). Reports on the impact of soil physics in the cyanobacterial N2‐fixation activity are limited. A previous study reported a relationship among soil instability, water stress, and the predominance of Nostoc and Scytonema in biological soil crusts (Yeager et al., 2004). High Dmean value together with low OC and Por. SD (Figure 5) are indicators of poor soil structural quality and well‐sorted physical microenvironments. Accordingly, cyanobacterial nifH relative abundance was higher under cultivated treatments where OC and physical quality were lower (Figure 4 and Table 3). Moreover, PAP treatment has lower plant coverage compared to GAP and NE, which present winter cover crops or grassland, respectively (Figuerola et al., 2012). The low coverage could generate a greater sunlight exposure in PAP compared to the other topsoil samples. This together with low aggregate stability could explain the high representation of phylotypes related to Cyanobacteria in PAP topsoil (Figure 5). In addition, the abundance of this group was found negatively correlated with TN, OC, and EP (data not shown); which may indicate that Cyanobacteria have an ecological advantage in these limiting nutrient conditions.
The topsoil of GAP was associated with physical properties related to poor structural conditions, such as high proportion of micropores (PMic<50) or “water storage pores” and high density (BD) (Figure 5). In loamy soils, as those of Pergamino, these physical parameters may create conditions for microaerophilic environments that allow N2 fixation by microaerophilic organisms such as Bradyrhizobium and the methanotrophic group Methylosinus/Methylocystis. Accordingly, the proportion of subcluster 1K, composed mostly by rhizobiales sequences, was found to be increased in the GAP topsoil sample (Figure 2 and Figure 5).
3.6. Concluding remarks
In recent years many high‐throughput studies have been reported on soil, which generally revealed a broad microbial diversity, some of them by using taxonomic markers such as 16S rRNA genes while others by examining functional genes such as the genes coding for denitrification, nitrification, nitrogen fixation, etc. However, these studies often do not associate the microbial data with the edaphic properties, land use, or agronomic practices; neither determined which components of the microbial community are indeed functionally active under agricultural conditions. In this work, the structure and diversity of the active diazotrophic community and its relation to physicochemical soil properties were assessed within a framework of a productive agricultural management system. Despite the limited number of soil samples analyzed, the deep pyrosequencing approach was useful to reveal underrepresented N‐fixing microorganisms and a high diversity of the ADC in soil samples. Indeed, the predominance of some phylotypes observed in the nifH‐cDNA data was validated by qPCR analysis.
The nifH‐cDNA database encompass 437 OTUs, whereas about 600 OTUS were identified in the DNA analysis previously reported (Collavino et al., 2014). This suggests that the ADC from Pergamino soils represents an important fraction of the potential diazotrophic community, although it cannot be ruled out that primer biases could be affecting the comparative analysis. The diversity and composition of the active diazotrophic community are influenced by management practices under no till, and this effect is in part related to the physical quality and organic carbon content. In soils with favorable structural conditions and higher OC, the N2 fixation could rely on a diverse community with a key role of 1A group, while poorer soil physical conditions drive the predominance of few groups, such as Rhizobiales, Cyanobacteria, and Verrumicrobiales, depending on management/depth condition. BNF is a complex cellular process as a large number of genes need to be activated in order to have a functional nitrogenase enzyme, energetically requires about 16 ATP molecules per mole of reduced nitrogen, and anaerobic or microaerobic environment to protect nitrogenase of irreversible damage. Therefore, it is expected that soil properties such as physical structure and organic carbon level may influence biological nitrogen fixation by specific taxonomic groups of diazotrophs.
The high representation of nifH phylotypes related to Geobacter and Cyanobacteria given at both potential and active levels provides solid bases to consider them as key players of free‐nitrogen fixation in agricultural soils. The occurrence of these groups was affected by management and depth conditions. For instance, the abundance of nifH gene related to Geobacter was found reduced in soils under intensive monoculture, which showed the lowest structural condition, whereas cyanobacterial nifH level was higher in the topsoil of this treatment.
This study shows the view of a single point in time of a particular soil type, therefore further temporal studies will help to determine how diazotrophic communities change over time and what soil properties and types of land use may drive the structuring of specific populations. Our results suggest strong associations of nifH phylotypes with soil properties and management practices, highlighting the importance of linking microbial community characterization with soil metadata to gain insight into the ecology of free‐living diazotrophs in soils.
CONFLICT OF INTEREST
None declared.
Supporting information
ACKNOWLEDGMENTS
This work was supported by the Argentinean National Agency for Science and Technology (FONCyT; project code PAE 37164‐PID 91). PAC, MMC, FBK, HJM, and OMA are funded by the National Research Council for Science and Technology of Argentina (CONICET).
Calderoli PA, Collavino MM, Behrends Kraemer F, Morrás HJM, Aguilar OM. Analysis of nifH‐RNA reveals phylotypes related to Geobacter and Cyanobacteria as important functional components of the N2‐fixing community depending on depth and agricultural use of soil. MicrobiologyOpen. 2017;6:e502 https://doi.org/10.1002/mbo3.502
REFERENCES
- Agnelli, A. , Ascher, J. , Corti, G. , Ceccherini, M. T. , Nannipieri, P. , & Pietramellara, G. (2004). Distribution of microbial communities in a forest soil profile investigated by microbial biomass, soil respiration and DGGE of total and extracellular DNA. Soil Biology & Biochemistry, 36, 859–868. [Google Scholar]
- Baldrian, P. , Kolařík, M. , Stursová, M. , Kopecký, J. , Valášková, V. , Větrovský, T. , … Voříšková, J. (2012). Active and total microbial communities in forest soil are largely different and highly stratified during decomposition. ISME Journal, 6, 248–258. [DOI] [PMC free article] [PubMed] [Google Scholar]
- Ball, B. C. , Batey, T. , & Munkholm, L. J. (2007). Field assessment of soil structural quality – a development of the Peerlkamp test. Soil Use and Management, 23, 329–333. [Google Scholar]
- Bergmann, G. T. , Bates, S. T. , Eilers, K. G. , Lauber, C. L. , Caporaso, J. G. , Walters, W. A. , … Fierer, N . (2011). The under‐recognized dominance of Verrucomicrobia in soil bacterial communities. Soil Biology & Biochemistry, 43, 1450–1455. [DOI] [PMC free article] [PubMed] [Google Scholar]
- Billings, S. A. , Schaeffer, S. M. , & Evans, R. D. (2003). Nitrogen fixation by biological soil crusts and heterotrophic bacteria in an intact Majove Desert ecosystem with elevated CO2 and added soil carbon. Soil Biology & Biochemistry, 35, 643–649. [Google Scholar]
- Bird, C. , & Wyman, M. (2013). Transcriptionally active heterotrophic diazotrophs are widespread in the upper water column of the Arabian Sea. FEMS Microbiology Ecology, 84, 189–200. [DOI] [PubMed] [Google Scholar]
- Blake, G. R. , & Hartge, K. H . (1986). Bulk density In Klute A. (Eds.), Methods of Soil Analysis, Part 1. Physical and Minerological Methods (pp. 363‐376). Madison, USA: American Society of Agronomy. [Google Scholar]
- Bray, J. R. , & Curtis, J. T. (1957). An ordination of the upland forest communities of southern Wisconsin. Ecological Monographs, 27, 325–349. [Google Scholar]
- Bray, R. H. , & Kurtz, L. T. (1945). Determination of total, organic, and available forms of phosphorus in soils. Soil Science, 59, 39–45. [Google Scholar]
- Bremner, J. M . (1996). Nitrogen‐total In Sparks D. L., Page A. L., Helmke P. A., Loep‐pert R. H., Soltanpour P. N., Tabatabai M. A., Johnston C. T. & Sumner M. E. (Eds.), Methods of Soil Analysis. Part 3. Chemical Methods (pp. 1085–1121). Madison, USA: American Society of Agronomy and Soil Science Society of America. [Google Scholar]
- Buckley, D. H. , Huangyutitham, V. , Hsu, S.‐F. , & Nelson, T. A. (2007). Stable isotope probing with 15N2 reveals novel noncultivated diazotrophs in soil. Applied and Environment Microbiology, 73, 3196–3204. [DOI] [PMC free article] [PubMed] [Google Scholar]
- Buckley, D. H. , Huangyutitham, V. , Shi‐Fang, H. , & Tyrrell, A. N. (2008). 15N2‐DNA‐stable isotope probing of diazotrophic methanotrophs in soil. Soil Biology & Biochemistry, 40, 1272–1283. [Google Scholar]
- Bullerjahn, G. S. , & Post, A. F. (2014). Physiology and molecular biology of aquatic cyanobacteria. Frontiers in Microbiology, 5, 359. [DOI] [PMC free article] [PubMed] [Google Scholar]
- Burbano, C. S. , Liu, Y. , Rösner, K. L. , Reis, V. M. , Caballero‐Mellado, J. , & Reinhold‐Hurek, B. (2011). Predominant nifH transcript phylotypes related to Rhizobium rosettiformans in field‐grown sugarcane plants and in Norway spruce. Environmental Microbiology Reports, 3, 383–389. [DOI] [PubMed] [Google Scholar]
- Carson, J. K. , Gonzalez‐Quiñones, V. , Murphy, D. V. , Hinz, C. , Shaw, J. A. , & Gleeson, D. B. (2010). Low pore connectivity increases bacterial diversity in soil. Applied and Environment Microbiology, 76, 3936–3942. [DOI] [PMC free article] [PubMed] [Google Scholar]
- Castiglioni, M. G. , Behrends Kraemer, F. , & Morras, H. J. M. (2013). Efecto de la secuencia de cultivos bajo siembra directa sobre la calidad de algunos suelos de la región Pampeana. Cienc Suelo, 31, 93–105. [Google Scholar]
- Cavacini, P. (2001). Soil algae from northern Victoria Land (Antarctica). Polar Bioscience, 14, 45–60. [Google Scholar]
- Cavenage, A. , Moraes, M. L. T. , Alves, M. C. , Carvalho, M. A. C. , Freitas, M. L. M. , & Buzetti, S. (1999). Alterações nas propriedades físicas de um Latossolo Vermelho‐Escuro sob diferentes culturas. Revista Brasileira de Ciência do Solo, 23, 997–1003. [Google Scholar]
- Chagas, C. I. , Santanatoglia, O. J. , Castiglioni, M. G. , & Marelli, H. J. (1995). Tillage and cropping effects on selected properties of an Argiudoll in Argentina. Communications in Soil Science \& Plant Analysis, 26, 643–655. [Google Scholar]
- Chapman, H. D . (1965). Cation exchange capacity In Black C. A. (Ed.), Methods of Soil Analysis, Part 2, Number 9 (pp. 891–901). Madison, USA: American Institute of Agronomy. [Google Scholar]
- Chau, J. F. , Bagtzoglou, A. C. , & Willig, M. R. (2011). The effect of soil texture on richness and diversity of bacterial communities. Environmental Forensics, 12, 333–341. [Google Scholar]
- Chenu, C. , & Cosentino, D . (2011). Microbial regulation of soil structural dynamics In Ritz K. & Young I., (Eds.), The architecture and biology of soils. Life in inner space (pp. 37–70). London, UK: CABI. [Google Scholar]
- Church, M. J. , Short, C. M. , Jenkins, B. D. , Karl, D. M. , & Zehr, J. P. (2005). Temporal patterns of nitrogenase gene (nifH) expression in the oligotrophic North Pacific Ocean. Applied and Environment Microbiology, 71, 5362–5370. [DOI] [PMC free article] [PubMed] [Google Scholar]
- Cleveland, C. C. , Townsend, A. R. , Schimel, D. S. , Fisher, H. , Howarth, R. W. , Hedin, L. O. , … Wasson, MF . (1999). Global patterns of terrestrial biological nitrogen (N2) fixation in natural ecosystems. Global Biogeochemical Cycles, 13, 623–645. [Google Scholar]
- Collavino, M. M. , Tripp, H. J. , Frank, I. E. , Vidoz, M. L. , Calderoli, P. A. , Donato, M. , … Aguilar, OM . (2014). nifH pyrosequencing reveals the potential for location‐specific soil chemistry to influence N2‐fixing community dynamics. Environmental Microbiology, 16, 3211–3223. [DOI] [PubMed] [Google Scholar]
- Darrah, P. R. , White, R. E. , & Nye, P. H. (1987). A theoretical consideration of the implications of cell clustering for the prediction of nitrification in soil. Plant and Soil, 99, 387–400. [Google Scholar]
- Di Rienzo, J. A. , Casanoves, F. , Balzarini, M. G. , Gonzalez, L. , Tablada, M. , & Robledo, Y. C. (2008). InfoStat. Grupo InfoStat: FCA, Universidad Nacional de Córdoba, Argentina. [Google Scholar]
- Duc, L. , Noll, M. , Meier, B. E. , Bürgmann, H. , & Zeyer, J. (2009). High diversity of diazotrophs in the forefield of a receding alpine glacier. Microbial Ecology, 57, 179–190. [DOI] [PubMed] [Google Scholar]
- Durán, A. , Morrás, H. , Studdert, G. , & Liu, X. (2011). Distribution, properties, land use and management of Mollisols in South America. Chinese Geographical Science, 21, 511–530. [Google Scholar]
- Duval, M. E. , Galantini, J. A. , Iglesias, J. O. , Canelo, S. , Martinez, J. M. , & Wall, L. (2013). Analysis of organic fractions as indicators of soil quality under natural and cultivated systems. Soil and Tillage Research, 131, 11–19. [Google Scholar]
- Eilers, K. G. , Debenport, S. , Anderson, S. , & Fierer, N. (2012). Digging deeper to find unique microbial communities: The strong effect of depth on the structure of bacterial and archaeal communities in soil. Soil Biology & Biochemistry, 50, 58–65. [Google Scholar]
- Farnelid, H. , Andersson, A. F. , Bertilsson, S. , Al‐Soud, W. A. , Hansen, L. H. , Sørensen, S. , … Riemann, L . (2011). Nitrogenase gene amplicons from global marine surface waters are dominated by genes of non‐cyanobacteria. PLoS ONE, 6, e19223. [DOI] [PMC free article] [PubMed] [Google Scholar]
- Fierer, N. , Lauber, C. L. , Ramirez, K. S. , Zaneveld, J. , Bradford, M. A. , & Knight, R. (2012). Comparative metagenomic, phylogenetic and physiological analyses of soil microbial communities across nitrogen gradients. ISME Journal, 6, 1007–1017. [DOI] [PMC free article] [PubMed] [Google Scholar]
- Fierer, N. , Schimel, J. P. , & Holden, P. A. (2003). Variations in microbial community composition through two soil depth profiles. Soil Biology & Biochemistry, 35, 167–176. [Google Scholar]
- Figuerola, E. L. M. , Guerrero, L. D. , Rosa, S. M. , Simonetti, L. , Duval, M. E. , Galantini, J. A. , … Erijman, L . (2012). Bacterial Indicator of Agricultural Management for Soil under No‐Till Crop Production. PLoS ONE, 7, e51075. [DOI] [PMC free article] [PubMed] [Google Scholar]
- Gaby, J. C. , & Buckley, D. H. (2011). A global census of nitrogenase diversity. Environmental Microbiology, 13, 1790–1799. [DOI] [PubMed] [Google Scholar]
- Galloway, J. N. , Dentener, F. J. , Capone, D. G. , Boyer, E. W. , Howarth, R. W. , & Seitzinger, S. (2004). Nitrogen cycles: Past, present, and future. Biogeochemistry, 70, 153–226. [Google Scholar]
- Goebel, N. L. , Edwards, C. A. , Church, M. J. , & Zehr, J. P. (2007). Modeled contributions of three types of diazotrophs to nitrogen fixation at Station ALOHA. ISME Journal, 1, 606–619. [DOI] [PubMed] [Google Scholar]
- Grundmann, G. L. , Dechesne, A. , Bartoli, F. , Flandrois, J. P. , Chasse, J. L. , & Kizungu, R. (2001). Spatial modeling of nitrifier microhabitats in soil. Soil Science Society of America Journal, 65, 1709–1716. [Google Scholar]
- Hamelin, J. , Fromin, N. , Tarnawski, S. , Teyssier‐Cuvelle, S. , & Aragno, M. (2002). nifH gene diversity in the bacterial community associated with the rhizosphere of Molinia coerulea, an oligonitrophilic perennial grass. Environmental Microbiology, 4, 477–481. [DOI] [PubMed] [Google Scholar]
- Hammer, Ø. , Harper, D. A. T. , & Ryan, P. D. (2009). PAST: Palaeontological statistics software package for education and data analysis. Palaeontologia Electronica, 4, 1–9. [Google Scholar]
- Hattori, T. (1988). Soil aggregates as microhabitats for microorganisms. Reports of the Institute for Agricultural Research, Tohoku University, 37, 23–26. [Google Scholar]
- Holmes, D. E. , Nevin, K. P. , & Lovley, D. R. (2004). In situ expression of Geobacteraceae nifD in subsurface sediments. Applied and Environment Microbiology, 70, 7251–7259. [DOI] [PMC free article] [PubMed] [Google Scholar]
- Hoppe, B. , Kahl, T. , Karasch, P. , Wubet, T. , Bauhus, J. , Buscot, F. , & Krüger, D. (2014). Network analysis reveals ecological links between N‐fixing bacteria and wood‐decaying fungi. PLoS ONE, 9, e88141. [DOI] [PMC free article] [PubMed] [Google Scholar]
- Hsu, S.‐F. , & Buckley, D. H. (2009). Evidence for the functional significance of diazotroph community structure in soil. ISME Journal, 3, 124–136. [DOI] [PubMed] [Google Scholar]
- Huhe, Borjigin, S. , Cheng, Y. X. , Nomura, N. , Nakajima, T. , Nakamura, T. , & Uchiyama, H . (2014). Effect of abandonment on diversity and abundance of free‐living nitrogen‐fixing bacteria and total bacteria in the cropland soils of Hulun Buir, Inner Mongolia. PLoS ONE,9, e106714 https://doi.org/10.1371/journal.pone.0106714 [DOI] [PMC free article] [PubMed] [Google Scholar]
- Irisarri, P. , Gonnet, S. , & Monza, J. (2001). Cyanobacteria in Uruguayan rice fields: Diversity, nitrogen fixing ability and tolerance to herbicides and combined nitrogen. Journal of Biotechnology, 91, 95–103. [DOI] [PubMed] [Google Scholar]
- Izquierdo, J. A. , & Nüsslein, K. (2006). Distribution of extensive nifH gene diversity across physical soil microenvironments. Microbial Ecology, 51, 441–452. [DOI] [PubMed] [Google Scholar]
- Kielak, A. , Pijl, A. S. , Van Veen, J. A. , & Kowalchuk, G. A. (2008). Differences in vegetation composition and plant species identity lead to only minor changes in soil‐borne microbial communities in a former arable field. FEMS Microbiology Ecology, 63, 372–382. [DOI] [PubMed] [Google Scholar]
- Kielak, A. , Rodrigues, J. L. , Kuramae, E. E. , Chain, P. S. , Van Veen, J. A. , & Kowalchuk, G. A. (2010). Phylogenetic and metagenomic analysis of Verrucomicrobia in former agricultural grassland soil. FEMS Microbiology Ecology, 71, 23–33. [DOI] [PubMed] [Google Scholar]
- Klute, A . (1986). Water retention. Laboratory methods In Klute A. (Ed.), Methods of Soil Analysis, Part 1. Physical and Minerological Methods (pp. 635–662). Madison, USA: American Society of Agronomy. [Google Scholar]
- Kraemer, F. B. , Soria, M. A. , Castiglioni, M. G. , Duval, M. , Galantini, J. , & Morrás, H. (2017). Morpho‐structural evaluation of various soils subjected to different use intensity under no‐tillage. Soil and Tillage Research, 169, 124–137. [Google Scholar]
- Le Bissonnais, Y. (1996). Aggregate stability and assessment of soil crustability and erodibility: i. Theory and methodology. European Journal of Soil Science, 47, 425–437. [Google Scholar]
- Letey, J. (1969). Measurement of contact angle, water drop penetration time, and critical surface tensions In DeBano L. F., & Letey J. (Eds.), Proceedings of the Symposium on Water Repellent Soils (pp. 43–47). Riverside, USA: University of California. [Google Scholar]
- Lovley, D. R. , Ueki, T. , Zhang, T. , Malvankar, N. S. , Shrestha, P. M. , Flanagan, K. A. , … Nevin, KP . (2011). Geobacter: The microbe electric's physiology, ecology, and practical applications. Advances in Microbial Physiology, 59, 1–100. [DOI] [PubMed] [Google Scholar]
- Lozupone, C. A. , Lladser, M. E. , Knights, D. , Stombaugh, J. , & Knight, R. (2011). UniFrac: An effective distance metric for microbial community comparison. The ISME Journal, 5, 169–172. [DOI] [PMC free article] [PubMed] [Google Scholar]
- McGrath, K. C. , Thomas‐Hall, S. R. , Cheng, C. T. , Leo, L. , Alexa, A. , Schmidt, S. , & Schenk, P. M. (2008). Isolation and analysis of mRNA from environmental microbial communities. Journal of Microbiol Methods, 75, 172–176. [DOI] [PubMed] [Google Scholar]
- McInnes, A. S. , Shepard, A. K. , Raes, E. J. , Waite, A. M. , & Quigg, A. (2014). Simultaneous quantification of active carbon and nitrogen fixing communities and estimation of rates using fluorescence in situ hybridization and flow cytometry. Applied and Environment Microbiology, 80, 6750–6759. [DOI] [PMC free article] [PubMed] [Google Scholar]
- Mualem, Y . (1986). Hydraulic conductivity of unsaturated soils: Prediction and formulas In Klute A. (Ed.), Methods of Soil Analysis, Part 1. Physical and Minerological Methods (pp. 799–823). Madison, USA: American Society of Agronomy. [Google Scholar]
- Niederberger, T. D. , Sohm, J. A. , Tirindelli, J. , Gunderson, T. , Capone, D. G. , Carpenter, E. J. , & Cary, S. C. (2012). Diverse and highly active diazotrophic assemblages inhabit ephemerally wetted soils of the Antarctic Dry Valleys. FEMS Microbiology Ecology, 82, 376–390. [DOI] [PubMed] [Google Scholar]
- Novelli, L. E. , Caviglia, O. P. , & Melchiori, R. J. M. (2011). Impact of soybean cropping frequency on soil carbon storage in Mollisols and Vertisols. Geoderma, 167, 254–260. [Google Scholar]
- Novelli, L. E. , Caviglia, O. P. , Wilson, M. G. , & Sasal, M. C. (2013). Land use intensity and cropping sequence effects on aggregate stability and C storage in a Vertisol and a Mollisol. Geoderma, 195–196, 260–267. [Google Scholar]
- Nunan, N. , Wu, K. , Young, I. M. , Crawford, J. W. , & Ritz, K. (2003). Spatial distribution of bacterial communities and their relationships with the micro‐architecture of soil. FEMS Microbiology Ecology, 44, 203–215. [DOI] [PubMed] [Google Scholar]
- Or, D. , & Wraith, J. M . (2000). Soil water content and water potential relationships In Summer M. E. (Ed.), Handbook of Soil Science (pp. 53–85). New York, USA: CRC Press. [Google Scholar]
- Orr, C. H. , James, A. , Leifert, C. , Cooper, J. M. , & Cummings, S. P. (2011). Diversity and activity of free‐living nitrogen‐fixing bacteria and total bacteria in organic and conventionally managed soils. Applied and Environment Microbiology, 77, 911–919. [DOI] [PMC free article] [PubMed] [Google Scholar]
- Park, J. W. , & Crowley, D. E. (2005). Normalization of soil DNA extraction for accurate quantification of real‐time PCR and of target genes by DGGE. BioTechniques, 38, 579–586. [DOI] [PubMed] [Google Scholar]
- Pierce, F. J. , Fortin, M. C. , & Staton, M. J. (1994). Periodic plowing effects on soil properties in a no‐till farming system. Soil Science Society of America Journal, 58, 1782–1787. [Google Scholar]
- Raynaud, X. , & Nunan, N. (2014). Spatial Ecology of Bacteria at the Microscale in Soil. PLoS ONE, 9, e87217. [DOI] [PMC free article] [PubMed] [Google Scholar]
- Reed, S. C. , Cleveland, C. C. , & Townsend, A. R. (2011). Functional ecology of free‐living nitrogen fixation: A contemporary perspective. Annual Review of Ecology Evolution and Systematics, 42, 489–512. [Google Scholar]
- Reynolds, W. D. , Bowman, B. T. , Drury, C. F. , Tana, C. S. , & Lu, X. (2002). Indicators of good soil physical quality: Density and storage parameters. Geoderma, 110, 131–146. [Google Scholar]
- Reynolds, W. D. , Drury, C. F. , Tan, C. S. , Fox, C. A. , & Yang, X. M. (2009). Use of indicators and pore volume‐function characteristics to quantify soil physical quality. Geoderma, 152, 252–263. [Google Scholar]
- Rosa, S. M. , Kraemer, F. B. , Soria, M. A. , Guerrero, L. D. , Morrás, H. J. , Figuerola, E. L. , & Erijman, L. (2014). The influence of soil properties on denitrifying bacterial communities and denitrification potential in no‐till production farms under contrasting management in the Argentinean Pampas. Applied Soil Ecology, 75, 172–180. [Google Scholar]
- Rösch, C. , Mergel, A. , & Bothe, H. (2002). Biodiversity of denitrifying and dinitrogen‐fixing bacteria in an acid forest soil. Applied and Environment Microbiology, 68, 3818–3829. [DOI] [PMC free article] [PubMed] [Google Scholar]
- Sangwan, P. , Chen, X. , Hugenholtz, P. , & Janssen, P. H. (2004). Chthoniobacter flavus gen. nov., sp. nov., the First Pure‐Culture Representative of Subdivision Two, Spartobacteria classis nov., of the Phylum Verrucomicrobia . Applied and Environment Microbiology, 70, 5875–5881. [DOI] [PMC free article] [PubMed] [Google Scholar]
- Sasal, C. , Andriulo, A. , & Taboada, M. (2006). Soil Porosity characteristics and water movement under zero tillage in silty soils in Argentinian Pampas. Soil and Tillage Research, 87, 9–18. [Google Scholar]
- Schloss, P. D. , Westcott, S. L. , Ryabin, T. , Hall, J. R. , Hartmann, M. , Hollister, E. B. , … Weber, C. F . (2009). Introducing mothur: Open‐source, platform‐independent, community‐supported software for describing and comparing microbial communities. Applied and Environment Microbiology, 75, 7537–7541. [DOI] [PMC free article] [PubMed] [Google Scholar]
- Sessitsch, A. , Hardoim, P. , Döring, J. , Weilharter, A. , Krause, A. , Woyke, T. , … Reinhold‐Hurek, B . (2012). Functional characteristics of an endophyte community colonizing rice roots as revealed by metagenomic analysis. Molecular Plant‐Microbe Interactions, 25, 28–36. [DOI] [PubMed] [Google Scholar]
- Shahab, H. , Emami, H. , Hagnia, G. H. , & Karimi, A. (2013). Pore size distribution as a soil physical quality index for agricultural and pasture soils in northeastern Iran. Pedosphere, 23, 312–320. [Google Scholar]
- Short, S. M. , & Zehr, J. P. (2007). Nitrogenase gene expression in the Chesapeake Bay Estuary. Environmental Microbiology, 9, 1591–1596. [DOI] [PubMed] [Google Scholar]
- Six, J. , Elliott, E. T. , Paustian, K. , & Doran, J. W. (1998). Aggregation and soil organic matter accumulation in cultivated and native grassland soils. Soil Science Society of America Journal, 62, 1367–1377. [Google Scholar]
- Soil Conservation Service (1972). Soil survey laboratory methods and procedures for collecting soils samples, Soil Survey, Report 1. Washington: United States Department of Agriculture. [Google Scholar]
- Teng, Q. , Sun, B. , Fu, X. , Li, S. , Cui, Z. , & Cao, H. (2009). Analysis of nifH gene diversity in red soil amended with manure in Jiangxi, South China. Journal of Microbiology, 7, 135–141. [DOI] [PubMed] [Google Scholar]
- Turk, K. A. , Rees, A. P. , Zehr, J. P. , Pereira, N. , Swift, P. , Shelley, R. , … Gilbert, J . (2011). Nitrogen fixation and nitrogenase (nifH) expression in tropical waters of the eastern North Atlantic. ISME Journal, 5, 1201–1212. [DOI] [PMC free article] [PubMed] [Google Scholar]
- Van Genuchten, M. T. (1980). A closed‐form equation for predicting the hydraulic conductivity of unsaturated soils. Soil Science Society of America Journal, 44, 892–898. [Google Scholar]
- Van Genuchten, M. , Leij, M. , & Yates, F . (1991). The RETC code for quantifying the hydraulic functions of unsaturated soils. Report No. EPA/600/2‐91/065, R. S. Kerr Environ. Res. Laboratory, Ada, Oklahoma: US Environmental Protection Agency, p. 85. [Google Scholar]
- Viglizzo, E. F. , Frank, F. C. , Carreño, L. V. , Jobbágy, E. G. , Pereyra, H. , & Clatt, J. (2011). Ecological and environmental footprint of 50 years of agricultural expansion in Argentina. Global Change Biology, 17, 959–973. [Google Scholar]
- Wander, M. R. , & Bollero, G. A. (1999). Soil quality assessment of tillage impacts of Illinois. Soil Science Society of America Journal, 63, 961–971. [Google Scholar]
- Wang, Q. , Quensen, J. F. , Fish, J. A. , Lee, T. K. , Sun, Y. , Tiedje, J. M. , & Cole, J. R. (2013). Ecological patterns of nifH genes in four terrestrial climatic zones explored with targeted metagenomics using FrameBot, a new informatics tool. MBio, 4, e00592–13. [DOI] [PMC free article] [PubMed] [Google Scholar]
- Wang, J. , Zhang, D. , Zhang, L. , Li, J. , Raza, W. , Huang, Q. , & Qirong, S. (2016). Temporal variation of diazotrophic community abundance and structure in surface and subsoil under four fertilization regimes during a wheat growing season. Agriculture, Ecosystems & Environment, 216, 116–124. [Google Scholar]
- Whitton, B. A. , & Potts, M. (2000). The Ecology of Cyanobacteria: their Diversity in Time and Space. Dordrecht, Netherlands: Kluwer Academic Publishers. [Google Scholar]
- Will, C. , Thürmer, A. , Wollherr, A. , Nacke, H. , Herold, N. , Schrumpf, M. , … Daniel, R . (2010). Horizon‐specific bacterial community composition of German grassland soils, as revealed by pyrosequencing‐based analysis of 16S rRNA genes. Applied and Environment Microbiology, 76, 6751–6759. [DOI] [PMC free article] [PubMed] [Google Scholar]
- Woebken, D. , Burow, L. C. , Behnam, F. , Mayali, X. , Schintlmeister, A. , Fleming, E. D. , … Bebout, B. M . (2015). Revisiting N2 fixation in Guerrero Negro intertidal microbial mats with a functional single‐cell approach. ISME Journal, 9, 485–496. [DOI] [PMC free article] [PubMed] [Google Scholar]
- Yeager, C. M. , Kornosky, J. L. , Housman, D. C. , Grote, E. E. , Belnap, J. , & Kuske, C. R. (2004). Diazotrophic community structure and function in two successional stages of biological soil crusts from the Colorado Plateau and Chihuahuan Desert. Applied and Environment Microbiology, 70, 973–984. [DOI] [PMC free article] [PubMed] [Google Scholar]
- Yeager, C. M. , Kornosky, J. L. , Morgan, R. E. , Cain, E. C. , Garcia‐Pichel, F. , Housman, D. C. , … Kuske, CR . (2007). Three distinct clades of cultured heterocystous cyanobacteria constitute the dominant N2‐fixing members of biological soil crusts of the Colorado Plateau, USA. FEMS Microbiology Ecology, 60, 85–97. [DOI] [PubMed] [Google Scholar]
- Young, J. P. W. (1992). Phylogenetic classification of nitrogen fixing organisms In Stacey G., Evans H. J., & Burris R. H. (Eds.), Biological Nitrogen Fixation (pp. 43–86). New York: Chapman and Hall. [Google Scholar]
- Zani, S. , Mellon, M. T. , Collier, J. L. , & Zehr, J. P. (2000). Expression of nifH genes in natural microbial assemblages in Lake George, New York, detected by reverse transcriptase PCR. Applied and Environment Microbiology, 66, 3119–3124. [DOI] [PMC free article] [PubMed] [Google Scholar]
- Zehr, J. P. , Jenkins, B. D. , Short, S. M. , & Steward, G. F. (2003). Nitrogenase gene diversity and microbial community structure: A cross‐system comparison. Environmental Microbiology, 5, 539–554. [DOI] [PubMed] [Google Scholar]
- Zehr, J. P. , & McReynolds, L. A. (1989). Use of degenerate oligonucleotides for amplification of the nifH gene from the marine cyanobacterium Trichodesmium spp. Applied and Environment Microbiology, 55, 2522–2526. [DOI] [PMC free article] [PubMed] [Google Scholar]
Associated Data
This section collects any data citations, data availability statements, or supplementary materials included in this article.
Supplementary Materials