

Abstract
Optimizing physical activity during physical education is necessary for children to achieve daily physical activity recommendations. The purpose of this study was to examine the relationship among various contextual factors with accelerometer measured physical activity during elementary physical education. Data were collected during 2015–2016 from 281 students (1st–5th grade, 137 males, 144 females) from a private school located in a metropolitan area of Utah in the U.S. Students wore accelerometers for 12 consecutive weeks at an accelerometer wear frequency of 3 days per week during physical education. A multi-level general linear mixed effects model was employed to examine the relationship among various physical education contextual factors and percent of wear time in moderate-to-vigorous physical activity (%MVPA), accounting for clustering of observations within students and the clustering of students within classrooms. Explored contextual factors included grade level, lesson context, sex, and class size. Main effects and interactions among the factors were explored in the multi-level models. A two-way interaction of lesson context and class size on %MVPA was shown to be statistically significant. The greatest differences were found to be between fitness lessons using small class sizes compared to motor skill lessons using larger class sizes (β = 14.8%, 95% C.I. 5.7%–23.9% p < 0.001). Lessons that included a focus on fitness activities with class sizes that were < 25 students associated with significantly higher %MVPA during elementary physical education.
Keywords: Exercise, Physical education and training, Adolescents
Highlights
-
•
Small class sizes relate to increased physical activity during physical education.
-
•
Fitness lessons yielded higher physical activity compared to motor skills/games.
-
•
Small classes and fitness lessons are additive for increasing physical activity.
1. Introduction
There are many health benefits associated with a physically active lifestyle. Approximately 35 different chronic conditions can be prevented by being physically active, including: arthritis, cardiovascular disease, cancer, stroke, high blood pressure, metabolic syndrome, and type 2 diabetes (Centers for Disease Control and Prevention (CDC), 2015). Bones and muscles become stronger, mental health and mood can improve, as well as improved sleep patterns with elevated levels of physical activity. (Mayo Clinic, 2016). Additionally, studies have shown that a child's fitness level is associated with academic achievement (Castelli et al., 2007) and cognitive functioning (Roberts et al., 2010). Conversely, physical inactivity associates with an increased prevalence of obesity, cardiovascular disease, and high blood pressure (Cauderay and Cachat, 2015). Research has found that being physically active helps prevent obesity while higher levels of sedentary behavior can lead to obesity (Herman et al., 2014, Jimenez-Pavon et al., 2010).
Schools in the United States provide an ideal environment for students to be physical active and prevent obesity (Howe et al., 2012). School is where children spend the majority of their time outside of the home (SHAPE America, 2013). The Institutes of Medicine recommends children get 30 min of moderate-to-vigorous physical activity (MVPA) and have the opportunity to be physically active for 60 min while at school (Koplan et al., 2005). If the amount of physical activity (PA) opportunities is higher during the school day it not only helps children reach the daily recommendation of 60 min of MVPA but it may lower obesity incidence (Alexander et al., 2015).
Physical education class is an optimal setting to increase the PA opportunities during the school day. Numerous sources suggest that when a high-quality physical education program is implemented, students can learn the skills, confidence, and knowledge to be physically active during school, outside of school, and throughout their life (Sallis et al., 2012, USDHHS, 2010). During physical education classes, the U.S. Department of Health and Human Services (USDHHS) recommends that students are engaged in MVPA at least 50% of the time (USDHHS, 2010). However, there have been numerous studies done showing that students are not meeting this guideline (Bevans et al., 2010, Coe et al., 2006, Fairclough and Stratton, 2005, Levin et al., 2001, Nader and National Institute of Child Health and Human Development Study of Early Child Care and Youth Development Network, 2003, McKenzie et al., 2006, McKenzie et al., 2000, Nettlefold et al., 2011, Scruggs et al., 2003, Troiano et al., 2007, Van Beurden et al., 2003). In a review by Fairclough and Stratton (2006), it was found that on average students engage in MVPA 34.2% of physical education class time. Scruggs, 2007, Scruggs, 2013 suggests that elementary students should be engaged in MVPA at least 33% of class time. Scruggs (2007) gives five suggestions of why the MVPA goal for elementary children should be set at 33% as opposed to 50%: 1) Elementary physical education is shorter than secondary physical education so things such as management and instruction may have a greater impact on overall activity time, 2) It is recommended that young children engage in physical activity intermittently, 3) Educational goals and public health both need to be taught as well as the importance of developing lifelong healthy habits, 4) Elementary physical education lessons are focused on the cognitive, affective and psychomotor domains and not just physical activity, 5) The “play-teach-play” approach is implemented more in elementary physical education than in secondary classes. This helps create an intermittent physical activity environment (Scruggs, 2007).
The amount of MVPA students achieve during physical education can be a result of the individual student, environmental factors, socioeconomic status, grade level, location of school, and gender (Greenfield et al., 2015). Student's age, size of gym, teacher specialization, lesson type, and class size also have an effect on the amount of MVPA that is achieved (Bevans et al., 2010, Ruch et al., 2012). In a review of 44 papers that researched physical activity in physical education, Fairclough and Stratton (2005) found that regardless of the observation instrument boys and girls took part in similar amounts of physical education. Nettlefold et al. (2011) found that 1.8% of girls and 2.9% of boys achieved the physical activity guidelines. Despite these findings, no study to date has explored contextual factors related to physical activity using accelerometers over relatively long time periods. The purpose of this study was two-fold. The primary purpose was to explore what contextual factors may affect the elementary student's physical activity during education class. The explored factors included: sex of student, class size (small, large), lesson context (motor skills/games, fitness), and grade level (1st–5th grade). For descriptive purposes, a secondary aim was to identify the percentage of participants that met the recommendations, 33% MVPA and 50% MVPA during physical education class time.
2. Methods
2.1. Participants
Participants were a convenience sample of 281 school-aged children (1st–5th grade, 137 males, 144 females) from a private school located in a metropolitan area in the southwestern United States. Approximately 38% of the participants identified themselves as an ethnic minority. The parents were informed of the study in a newsletter and given the option for their child(ren) to not participate. Children were informed of the study in physical education class. Each grade level had physical education three times a week. The University Institutional Review Board and school principal approved the research design and procedures used in this study.
2.2. Instrumentation
Participants wore an Actigraph GT1M (Pensacola, FL, USA) on their waist, in line with their right knee cap. The GT1M is a uniaxial accelerometer with vertical and antero-posterior vectors (Hanggi et al., 2013). The GT1M can be worn by all ages, and measures body movements at a frequency of 30 Hz (Actigraph, 2015). The epoch length (time-sampling interval) was set at 5-s. Epoch length is how often the accelerometer records the participant's physical activity (Vale et al., 2009). When higher epoch lengths are used it can result in inaccurate results because of the short-bursts of PA children typically participate in (Rowlands et al., 2006). Therefore, smaller epoch lengths can help provide more valid results (Rowlands, 2007).
The GT1M has been deemed valid and reliable when compared to oxygen consumption tests (Kelly et al., 2013). Previous research has validated this instrument with this age group (Hanggi et al., 2013, Ruch et al., 2012). The cut-points for the accelerometers for this study was set to those derived from Evenson et al. (2008), which have been validated against estimated energy expenditure measured using indirect calorimetry in children (Trost et al., 2011). The cut-points were: sedentary: 0–100 Counts Per Minute (CPM), light: 101–2295 CPM, moderate: 2296–4011 CPM, and vigorous: 4012 to ∞ CPM.
Because multiple students shared the same accelerometer, in most cases six students, wear time validation was calculated by using filters. Each accelerometer was linked to a respective participant using identification numbers that were taped to the surface of the device. The identification numbers were changed for separate physical education classes. The accelerometers were also color coded for each group of students to facilitate data identification. The data was downloaded according to filters that had been previously set. Filters were set according to when each participant came to physical education class. The students had physical education class three times a week, for 45 min. The filters were set to start 3 min after class started and to stop 3 min before class ends, resulting in 39 min of physical education. This was done because this time frame more accurately represents when the students were in physical education class because of transitions to and from other classes.
2.3. Procedures
All children had previous experience wearing a physical activity monitor as part of their physical education program. At the beginning of the study children were reminded of the correct placement of the accelerometer (on waist above the right knee).
The students kept the accelerometer on during the entire physical education class and returned it to the appropriate shoebox before they left. The children had physical education three times a week for 45-min, for a total of 135 min of physical education every week. Participants wore the accelerometer for a total of 12 weeks and most weeks they wore the accelerometers three times a week. Each week the researcher collected the accelerometers and downloaded the data. The data was downloaded using the ActiLife 6.11.5 software (Pensacola, FL). Filters were set up in the ActiLife program. These filters allowed the data to be pulled out by classroom teacher and the time the students had physical education. The researcher also recorded information on an Excel sheet to help evaluate the data. On the excel sheet the researcher recorded gender, class size (small or large), context (motor skills/games, fitness), and grade level.
2.4. Contextual factors
Class size levels were determined to be small if the enrollment was < 25 students and large if the class size was 25 students or more. The physical education teacher determined if a respective lesson was motor skills/games vs. fitness, which was categorized based on the primary content/activity for a respective lesson. No physical education class was a combination of two lesson types. Although most physical education classes in the U.S. incorporates of both types of lessons, the relative time spent in each is highly variable and therefore the distribution of lesson types across the 12-week observation period in the current study was up to the discretion of the teacher. Motor skills/games consisted of practicing game specific skills (e.g., kicking, shooting, dribbling, etc.) and did not involve any direct fitness component. Fitness lessons had a direct fitness component/theme and involved activities such as distance running, sprint/interval running, circuit resistance training with the aim of improving either the cardiorespiratory endurance or muscular endurance domains of health-related fitness. Fitness testing days (e.g., one mile run/walk, Progressive Aerobic Cardiovascular Endurance Run) were also categorized as a fitness lesson. The lead author was present for all physical education classes and was in close communication with the physical education teacher.
2.5. Data analysis
MVPA and step count data were screened for outliers using boxplots and z-scores (using a ± 3.0 z-score cut-point) and checked for Gaussian distributions using k-density plots. < 5% of the data were omitted because of z-scores < − 3.0 z, thus missing data was assumed to have not significantly bias the results. The data analyses consisted of running three multi-level models: one using a continuous outcome and two using binary outcomes. The primary analysis consisted of employing general linear mixed effects models to examine the relationships among grade level (1st–5th), sex (girl, boy), class size (small, large), and lesson context (motor skills/games, fitness) on the percent of wear time in MVPA (%MVPA; continuous outcome) during physical education class. Random intercepts were used at the child and classroom level to adjust for clustering of observations within the data structure. Secondary categorical data analyses were then conducted. Two binary variables were created to evaluate the number of students achieving 33% MVPA and 50% MVPA. Multi-level generalized mixed effects models, with a logit link function, were then run using all of the contextual factors as predictors to determine odds of a child meeting the each respective MVPA cut-point. Again, random intercepts were used at the child and classroom level to adjust for clustering of observations within the data structure. All main effects and interactions were explored in each of the multi-level models. Referents used for all comparisons included 1st graders, males, motor skills/games, and small class sizes. Alpha level was set at priori p ≤ 0.025 to adjust for analysis on multiple dependent variables. SPSS v.23.0 (Armonk, NY, USA) was used to analyze the data.
3. Results
There were a total of 175 lessons across the five grade levels over 12 weeks. Approximately 64% of the lessons were motor skills/games (112/175) and approximately 54.3% of these classes were characterized as small class sizes (95/175). There were a total of 3593 student-level observations across the 12-weeks. The descriptive statistics for mean %MVPA and the percent of children meeting recommendations are presented in Table 1. The main effect results from the general linear mixed effects model are presented in Table 2. Being female and being enrolled in large class sizes related to lower levels of %MVPA. Additionally, fitness lessons related to higher %MVPA compared to motor skills/games and students enrolled in the 3rd and 4th grade related to higher %MVPA compared to students enrolled in the 1st grade. When the interactions were examined for %MVPA, there was a statistically significant interaction between lesson context and class size on %MVPA (β = 14.8%, 95% C.I. 5.7%–23.9% p < 0.001). Fig. 1 visually presents the interaction between lesson context and class size on %MVPA, which yielded the largest effect across all comparisons. During fitness lessons with small class sizes is when students achieved the most MVPA compared to motor skills/games and large class sizes.
Table 1.
Contextual factors compared to mean % moderate-to-vigorous physical activity and percentage of students meeting 33% and 50% moderate-to-vigorous physical activity during physical education (N = 281).
| Total (N = 3593) | Mean % MVPA | SD % MVPA | Percentage of sample meeting 33% MVPA | Percentage of sample meeting 50% MVPA | |
|---|---|---|---|---|---|
| Sex | |||||
| Male | 1799 | 28.7 | 10.3 | 30% | 4% |
| Female | 1794 | 26.9 | 9.5 | 23% | 2% |
| Class size | |||||
| Small | 1970 | 30.0 | 10.4 | 35% | 5% |
| Large | 1623 | 25.3 | 8.8 | 17% | 1% |
| Grade | |||||
| 1st | 867 | 26.9 | 9.7 | 24% | 2% |
| 2nd | 724 | 27.9 | 9.6 | 27% | 2% |
| 3rd | 747 | 28.6 | 10.1 | 29% | 4% |
| 4th | 653 | 28.9 | 9.9 | 27% | 3% |
| 5th | 602 | 27.9 | 10.7 | 27% | 5% |
| Lesson Context | |||||
| Motor skills | 3049 | 27.2 | 9.2 | 25% | 1% |
| Fitness | 544 | 31.7 | 13.1 | 36% | 13% |
MVPA stands for moderate-to-vigorous physical activity; SD stands for standard deviation; data were collected from the state of Utah in the U.S. during the 2015–2016 academic school year.
Table 2.
Main effect parameter estimates from the multi-level general linear mixed effects model (N = 281).
| Predictor | b-Coefficient (%MVPA) | 95% Confidence Interval | p-Value |
|---|---|---|---|
| Female | − 2.0% | − 3.3% – -0.7% | 0.002 |
| Large Class | − 4.5% | − 5.4%–-3.4% | < 0.001 |
| 2nd grade | 1.1% | − 0.7%–2.9% | 0.235 |
| 3rd grade | 1.3% | 0.4%–3.1% | 0.014 |
| 4th grade | 2.4% | 0.6%–4.3% | 0.011 |
| 5th grade | 1.1% | − 0.6%–3.3% | 0.299 |
| Fitness Lesson | 2.4% | 1.4%–3.3% | < 0.001 |
Referents are small class sizes, males, first graders, and motor skills; bold denotes statistical significance; data were collected from the state of Utah in the U.S. during the 2015–2016 academic school year.
Fig. 1.
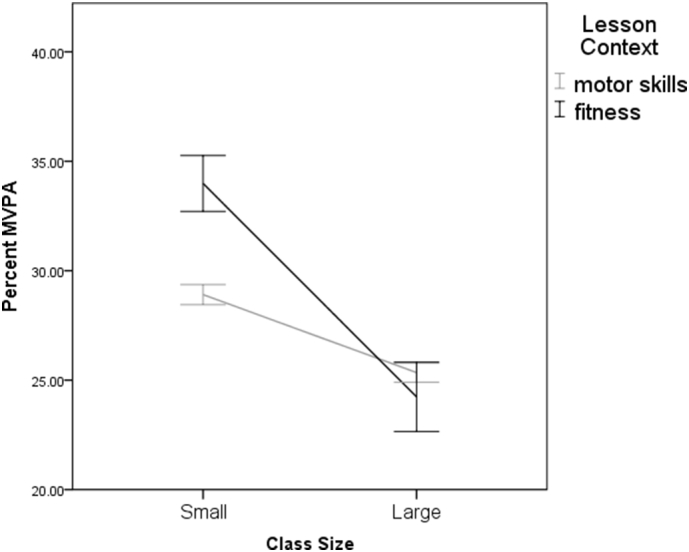
Interaction between class size and lesson context on percent of physical education wear time in MVPA. Data were collected from the state of Utah in the U.S. during the 2015–2016 academic school year.
Note: Error bars are 95% Confidence Intervals; MVPA is moderate-to-vigorous physical activity; Small Class Size is defined as < 25 students and Large Class Size is defined as 25 students or more.
The results of the generalized mixed effects models are presented in Table 3. For meeting the 33% MVPA guideline, being in a large class size related to lower odds of achievement and being enrolled in the 3rd and 4th grade related to higher odds of achievement compared to being enrolled in 1st grade. There was no lesson context main effect for 33% MVPA. For meeting the 50% MVPA guideline, being female and being enrolled in a large class size related to lower odds of achievement and fitness lessons related to higher odds of achievement compared to motor skills/games. There were no grade main effects for 50% MVPA. When the interactions were examined for 33% MVPA, there was a statistically significant interaction between sex and lesson context (OR = 0.52, 95% C.I.: 0.36–0.75, p < 0.001), suggesting that girls in fitness classes having lower odds of achieving the 33% MVPA guideline. When the interactions were examined for 50% MVPA, there were no statistically significant two-way interactions. There were also no observed statistically significant three-way interactions for the categorical outcomes.
Table 3.
Main effect parameter estimates from the multi-level generalized linear mixed effects model (logit link).
| Outcome | Predictor | OR | 95% Confidence Interval | p-value |
|---|---|---|---|---|
| Meeting 33% MVPA | Female | 0.68 | 0.47–0.99 | 0.044 |
| Large Class | 0.28 | 0.21–0.39 | < 0.001 | |
| 2nd grade | 0.94 | 0.59–1.49 | 0.810 | |
| 3rd grade | 1.75 | 1.11–2.75 | 0.015 | |
| 4th grade | 1.80 | 1.15–2.81 | 0.012 | |
| 5th grade | 0.92 | 0.57–1.45 | 0.807 | |
| Fitness Lesson | 1.24 | 0.97–1.58 | 0.083 | |
| Meeting 50% MVPA | Female | 0.52 | 0.30–0.89 | 0.019 |
| Large Class | 0.35 | 0.18–0.65 | < 0.001 | |
| 2nd grade | 1.25 | 0.58–2.70 | 0.566 | |
| 3rd grade | 1.53 | 0.75–2.17 | 0.119 | |
| 4th grade | 1.48 | 0.80–2.00 | 0.053 | |
| 5th grade | 1.24 | 0.56–2.65 | 0.555 | |
| Fitness Lesson | 9.97 | 5.97–16.64 | < 0.001 |
Referents are small class sizes, males, first graders, and motor skills; OR stands for odds ratio; MVPA stands for moderate-to-vigorous physical activity; bold denotes statistical significance; data were collected from the state of Utah in the U.S. during the 2015–2016 academic school year.
4. Discussion
This study examined what contextual factors relate to the amount of physical activity students attain during traditional elementary physical education classes. It was found that students, on average, were active anywhere from 25% to 31% MVPA (see Table 1), depending on the contextual factor. These results as well as other research shows that 33% MVPA may be a more realistic goal for elementary physical education (Scruggs, 2007, Scruggs, 2013). When the contextual factors were examined, small class sizes that used fitness lessons related to 14.8% higher MVPA during class time compared to large classes sizes using motor skills and games. This corresponds to approximately an increase of 6.75 min for a 45-min physical education lesson. Given the low relative distribution of students meeting 33% MVPA and 50% MVPA, corresponding to 14.85 min and 22.5 min of MVPA for a 45-min lesson, increasing MVPA by 6.75 min is a large improvement compared to motor skill/games lessons with large class sizes and, as evidenced by the results of the categorical data analysis, significantly increases the odds of a child meeting MVPA cut-points.
If the lesson is fitness focused and the class size is smaller than 25 students, the %MVPA students achieve during physical education classes could increase. This finding is in agreement with Bevans et al. (2010) who reported that teacher to student ratio affects PA time. On days students participated in a fitness lesson there was a 2.4% increase in the amount of MVPA (adjusted estimate), corresponding to an approximate additional 1 min of MVPA for a 45-min lesson. When class size was under 25 students they had a 4.5% increase in MVPA (adjusted estimate), corresponding to approximately an additional 2 min of MVPA for a 45-min lesson. Although these absolute values of MVPA are difficult to compare across studies because of lesson time variability, these relative increases yield strong practical significance given the proportion of students not meeting guidelines.
Most students in this sample did not meet recommended guidelines for PA during physical education. Numerous studies have found the same results that students are not meeting the national recommendation of 50% MVPA during physical education. Changing the class size so only one class of students came to physical education at a time may not be possible but it would not only result in students getting more MVPA but also help them in the classroom. As the research supports with more PA students on-task behavior improves, test scores improve, and students listen better, so academic time really is not being taken away (Castelli et al., 2007). But since this change is out of the hands of the physical educators some things that they could change is their class management strategies, amount of fitness opportunities and motivating their students.
If a physical educator is focused on providing opportunities for their students to improve their motor skills than they also could incorporate fitness into their lessons. For example, if they are doing stations there could be two fitness stations mixed in with the skills stations. Or the sport and fitness stations could be combined (Konukman et al., 2009). The students could be throwing and catching a ball and after four successful throws and catches both partners could jog a lap around the gym. Instead of stationary passing with a soccer ball, the students could do give and go passes. The physical educator could also plan a separate fitness activity during the lesson. Maybe the warm-up could focus more on fitness and be done for an extended amount of time. Or at the end of the lesson there could also be a fitness component.
A lot of students may not be aware of recommendation to be MVPA for 50% of class time. Providing students with a physical activity device that they can keep track of their step count and MVPA, could help them be aware of the PA levels. If students are able to check their progress during the class, this could help encourage them to work harder. Goals could be introduced to the students. These goals could be individual goals, class goals or even their grade could be based on how often they reach 50% MVPA.
Limitations to this study include the use of an observational and correlational research design, therefore casual associations cannot be made linking contextual factors to physical activity behaviors. Also, data were collected from one private school located from the state of Utah in the U.S., therefore the external validity evidence for this study is limited. Also, limiting the external validity is the use of a three-day per week physical education curriculum. It is unknown how well the results would generalize to one-day per week classes or five-day per week classes. Additionally, only select contextual factors were used in the current analysis, therefore it is unknown what other contextual factors may have related to %MVPA. Other factors may include the amount of play space available, if a lesson was indoors or outdoors, experience of the physical educator, and use of a teacher-centered vs. student-centered pedagogical method.
5. Conclusions
Because of longitudinal design and relative large sample, this paper gives a clear idea of how much physical activity students are receiving in elementary physical education classes and provides evidence that different contextual factors during physical education manifests different physical activity levels. Data being collected across 12 weeks and the large sample size (281 participants) aids in providing strong internal validity evidence. It was found that small class sizes (< 25 students) during fitness lessons achieved the most physical activity. These results can help physical education teachers plan their lessons differently. Despite these results, the development of motor skills should not be neglected because of its link with free-living physical activity participation and health outcomes. Physical educators and researchers should strive to manifest higher levels of PA during motor skill lessons to maximize the health and developmental benefit for the child. Given the numerous benefits of physical activity participation in children, the results can aid teachers and school administrators on developing curricula to optimize healthy behaviors during school physical education.
References
- Actigraph 2015. http://www.actigraph.nl/en/product/7/gt3x.html Retrieved from:
- Alexander S., Fusco C., Frohlich K.L. ‘You have to do 60 minutes of physical activity per day … I saw it on TV’: children's constructions of play in the context of Canadian public health discourse of playing for health. Sociol. Health Illn. 2015;37:227–240. doi: 10.1111/1467-9566.12179. [DOI] [PubMed] [Google Scholar]
- Bevans K.B., Fitzpatrick L., Sanchez B., Riley A., Forrest C. Physical education resources, class management, and student physical activity levels: a structure-process-outcome approach to evaluating physical education effectiveness. J. Sch. Health. 2010;80:573–580. doi: 10.1111/j.1746-1561.2010.00544.x. [DOI] [PMC free article] [PubMed] [Google Scholar]
- Castelli D.M., Hillman C.H., Buck S.M., Erwin H.E. Physical fitness and academic achievement in third- and fifth-grade students. J. Sport Exerc. Psychol. 2007;29:239–252. doi: 10.1123/jsep.29.2.239. [DOI] [PubMed] [Google Scholar]
- Cauderay M., Cachat F. Analysis of exercise training for treating obesity in children and adolescents: a review of recent programs. Schweizerische Zeitschrift fur Sportmedizin und Sporttraumatologie. 2015;63:36–42. [Google Scholar]
- Centers for Disease Control and Prevention The Benefits of Physical Activity. 2015. http://www.cdc.gov/physicalactivity/basics/pa-health/index.htm Retrieved from:
- Coe D.P., Pivarnik J.M., Womack C.J., Reeves M.J., Malina R.M. Effect of physical education and activity levels on academic achievement in children. Med. Sci. Sports Exerc. 2006;38:1515–1519. doi: 10.1249/01.mss.0000227537.13175.1b. [DOI] [PubMed] [Google Scholar]
- Evenson K.R., Cattellier D., Gill K., Ondrak K., McMurray R.G. Calibration of two objective measures of physical activity for children. J. Sports Sci. 2008;26:1557–1565. doi: 10.1080/02640410802334196. [DOI] [PubMed] [Google Scholar]
- Fairclough S.J., Stratton G. “Physical education makes you fit and healthy.” Physical education's contribution to young people's activity levels. Health Educ. Res. 2005;20:14–23. doi: 10.1093/her/cyg101. [DOI] [PubMed] [Google Scholar]
- Fairclough S.J., Stratton G. A review of physical activity levels during elementary school physical education. J. Teach. Phys. Educ. 2006;25:239–257. [Google Scholar]
- Greenfield J.R.F., Almond M., Clarke G.P., Edwards K.L. Factors affecting school physical education provision in England: a cross-sectional analysis. J. Public Health. 2015 doi: 10.1093/pubmed/fdv032. [DOI] [PubMed] [Google Scholar]
- Hanggi J.M., Phillips L.R.S., Rowlands A.V. Validation of the GT3X Actigraph in children and comparison with the GT1M Actigraph. J. Sci. Med. Sport. 2013;16:40–44. doi: 10.1016/j.jsams.2012.05.012. [DOI] [PubMed] [Google Scholar]
- Herman K.M., Sabiston C.M., Mathieu M.E., Tremblay A., Paradis G. Sedentary behavior in a cohort of 8- to 10-year-old children at elevated risk of obesity. Prev. Med. 2014;60:115–120. doi: 10.1016/j.ypmed.2013.12.029. [DOI] [PubMed] [Google Scholar]
- Howe C.A., Freedson P.S., Alhassan S., Feldman H.A., Osganian S.K. A recess intervention to promote moderate-to-vigorous physical activity. Int. J. Pediatr. Obes. 2012;7:82–88. doi: 10.1111/j.2047-6310.2011.00007.x. [DOI] [PubMed] [Google Scholar]
- Jimenez-Pavon D., Kelly J., Reilly J.J. Associations between objectively measured habitual physical activity and adiposity in children and adolescents: Systematic review. Int. J. Pediatr. Obes. 2010;5:35–40. doi: 10.3109/17477160903067601. [DOI] [PubMed] [Google Scholar]
- Kelly L.A., McMillan D.G., Anderson A., Fippinger M., Fillerup G., Rider J. Validity of actigraphs uniaxial and triaxial accelerometers for assessment of physical activity in adults in laboratory conditions. BMC Med. Phys. 2013;13:5. doi: 10.1186/1756-6649-13-5. [DOI] [PMC free article] [PubMed] [Google Scholar]
- Konukman F., Brusseau T.A., Darst P.W., Johnson T. Combining Fitness and Skill Tasks. JOPERD. 2009;80:8. [Google Scholar]
- Koplan J.P., Liverman C.T., Kraak V.I. Institute of Medicine (U.S.); 2005. Preventing Childhood Obesity: Health in the Balance. [PubMed] [Google Scholar]
- Levin S., McKenzie T.L., Hussey J.R., Kelder S.H., Lytle L.A. Variability of physical activity during physical education lessons across elementary school grades. Meas. Phys. Educ. Exerc. Sci. 2001;5(4):207–218. [Google Scholar]
- Mayo Clinic Exercise: 7 benefits of regular physical activity. 2016. http://www.mayoclinic.org/healthy-lifestyle/fitness/in-depth/exercise/art-20048389?pg=2 Retrieved from:
- McKenzie T.L., Marshall S.J., Sallis J.F., Conway T.L. Student activity levels, lesson context, and teacher behavior during middle school physical education. Res. Q. Exerc. Sport. 2000;71:249–259. doi: 10.1080/02701367.2000.10608905. [DOI] [PubMed] [Google Scholar]
- McKenzie T.L., Catellier D.J., Conway T. Girls' activity levels and lesson contexts in middle school PE: TAAG baseline. Med. Sci. Sports Exerc. 2006;38:1229–1235. doi: 10.1249/01.mss.0000227307.34149.f3. [DOI] [PMC free article] [PubMed] [Google Scholar]
- Nader P.L., National Institute of Child Health and Human Development Study of Early Child Care and Youth Development Network Frequency and intensity of activity of third grade children in physical education. Arch. Pediatr. Adolesc. Med. 2003;157:185–190. doi: 10.1001/archpedi.157.2.185. [DOI] [PubMed] [Google Scholar]
- Nettlefold L., McKay H.A., Warburton D.E.R., McGuire K.A., Bredin S.S.D., Naylor P.J. The challenge of low physical activity during the school day: At recess, lunch and in physical education. Br. J. Sports Med. 2011;45:813–819. doi: 10.1136/bjsm.2009.068072. [DOI] [PubMed] [Google Scholar]
- Roberts C.K., Free B., McCarthy W.J. Low aerobic fitness and obesity are associated with lower standardized test scores in children. J. Pediatr. 2010;156:711–718. doi: 10.1016/j.jpeds.2009.11.039. [DOI] [PMC free article] [PubMed] [Google Scholar]
- Rowlands A.V. Accelerometer assessment of physical activity in children: an update. Pediatr. Exerc. Sci. 2007;19:252–266. doi: 10.1123/pes.19.3.252. [DOI] [PubMed] [Google Scholar]
- Rowlands A.V., Powell S.M., Humphries R., Eston R.G. The effect of accelerometer epoch on physical activity output measures. J. Exerc. Sci. Fit. 2006;4:52–58. [Google Scholar]
- Ruch N., Scheiwiller K., Kriemler S., Mader U. Correlates of children's physical activity during physical education classes. Sportmedizin und Sporttraumatologie. 2012;60:161–165. [Google Scholar]
- Sallis J.F., McKenzie T.L., Beets M.W., Beighle A., Erwin H., Lee S. Physical Education's role in public health. Res. Q. Exerc. Sport. 2012;83:125–135. doi: 10.1080/02701367.2012.10599842. [DOI] [PMC free article] [PubMed] [Google Scholar]
- Scruggs P.W. Quantifying activity time via pedometry in fifth- and sixth-grade physical education. J. Phys. Act. Health. 2007;4:215–227. doi: 10.1123/jpah.4.2.215. [DOI] [PubMed] [Google Scholar]
- Scruggs P.W. Quantifying physical activity in physical education via pedometry: a further analysis of steps/min guidelines. J. Phys. Act. Health. 2013;10:734–741. doi: 10.1123/jpah.10.5.734. [DOI] [PubMed] [Google Scholar]
- Scruggs P.W., Beveridge S.K., Eisenman P.A., Watson D.L., Shultz B.B., Ransdell L.B. Quantifying physical activity via pedometry in elementary physical education. Med. Sci. Sports Exerc. 2003;35:1065–1071. doi: 10.1249/01.MSS.0000069748.02525.B2. [DOI] [PubMed] [Google Scholar]
- SHAPE America Comprehensive school physical activity programs: helping all students achieve 60 minutes of physical activity. 2013. http://www.shapeamerica.org/advocacy/positionstatements/pa/upload/Comprehensive-School-Physical-Activity-programs-2013.pdf Retrieved from:
- Troiano R.P., Berrigan D., Dodd K.W., Masse L.C., Tilert T., McDowell M. Physical activity in the United States measured by accelerometer. Med. Sci. Sports Exerc. 2007;40(1):181–188. doi: 10.1249/mss.0b013e31815a51b3. [DOI] [PubMed] [Google Scholar]
- Trost S.G., Loprinzi P.D., Moore R., Pfeiffer K.A. Comparison of accelerometer cut-points for predicting activity intensity in youth. Med. Sci. Sports Exerc. 2011;43:1360–1368. doi: 10.1249/MSS.0b013e318206476e. [DOI] [PubMed] [Google Scholar]
- U.S. Department of Health and Human Services Strategies to improve the quality of physical education. 2010. http://www.cdc.gov/HealthyYouth Retrieved from.
- Vale S., Santos R., Silva P., Soares M.L., Mota J. Preschool children physical activity measurement: importance of epoch length choice. Pediatr. Exerc. Sci. 2009;21:413–420. doi: 10.1123/pes.21.4.413. [DOI] [PubMed] [Google Scholar]
- Van Beurden E., Barnett L.M., Zask A., Dietrich U.C., Brooks L.O., Beard J. Can we skill and activate children through primary school physical education lessons? “Move it Groove it”–a collaborative health promotion intervention. Prev. Med. 2003;36:493–501. doi: 10.1016/s0091-7435(02)00044-0. [DOI] [PubMed] [Google Scholar]