

Summary
A major determinant of mRNA half-life is the codon-dependent rate of translational elongation. How the processes of translational elongation and mRNA decay communicate is unclear. Here we establish that the DEAD-box protein Dhh1p is a sensor of codon optimality that targets an mRNA for decay. First, we find mRNAs whose translation elongation rate is slowed by inclusion of nonoptimal codons are specifically degraded in a Dhh1p-dependent manner. Biochemical experiments show Dhh1p is preferentially associated with mRNAs with suboptimal codon choice. We find these effects on mRNA decay are sensitive to the number of slow moving ribosomes on an mRNA. Moreover, we find Dhh1p overexpression leads to the accumulation of ribosomes specifically on mRNAs (and even codons) of low codon optimality. Lastly, Dhh1p physically interacts with ribosomes in vivo. Together, these data argue that Dhh1p is a sensor for ribosome speed, targeting an mRNA for repression and subsequent decay.
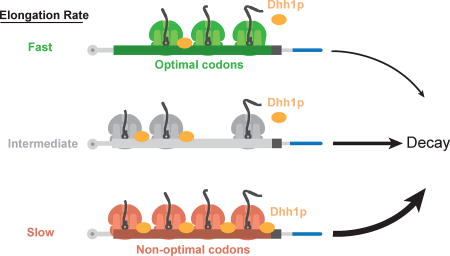
Graphical abstract
INTRODUCTION
Messenger RNA degradation represents a critical step in the regulation of gene expression. In budding yeast, most mRNAs are degraded by initial removal of the 3’ polyadenosine tail (Hsu and Stevens, 1993). This leads to subsequent cleavage of the 5’ cap structure in a process termed ‘decapping’ followed by digestion of the mRNA body by a 5’ to 3’ exoribonuclease enzyme (Muhlrad et al., 1994). While the major pathway and the enzymes catalyzing mRNA turnover have been identified (Anderson and Parker, 1998; Hsu and Stevens, 1993; Muhlrad et al., 1994; Shoemaker and Green, 2012), a mechanism to account for disparate mRNA half-lives has been elusive. Recently, we discovered that codon optimality is a major feature that contributes to determining mRNA stability (Presnyak et al., 2015). Using a genome-wide RNA decay analysis we found that stable mRNAs are enriched in optimal codons, whereas unstable mRNAs are enriched in non-optimal codons (Presnyak et al., 2015). These results establish the existence of coupling between active translation by ribosomes of an mRNA and its stability (Hu et al., 2009; Pelechano et al., 2015). Reporter studies recapitulated these striking genome-wide results (Presnyak et al., 2015). Similar effects of codon usage on mRNA stability were recently documented in bacteria and metazoans (Boel et al., 2016; Mishima and Tomari, 2016).
The idea that codon choice influences gene expression has long been understood (Dix and Thompson, 1989; Thomas et al., 1988). The inherent degeneracy of the genetic code leads to the possibility that synonymous codons are recognized distinctly by the ribosome as a function of subtle differences in tRNA availability, demand, decoding fidelity, and mRNA secondary structure propensity. All of these factors can lead to variability in codon-specific rates of translation (Drummond and Wilke, 2008; Gingold and Pilpel, 2011; Ikemura and Ozeki, 1983; Pechmann and Frydman, 2013). Codon optimality is a term coined to discuss the non-uniform recognition of each of the 61 codons by the ribosome based on supply and demand arguments (Pechmann and Frydman, 2013). Codon bias, which is the frequency at which distinct synonymous codons are present within the genome is, in part, shaped by codon optimality (Novoa and Ribas de Pouplana, 2012). Codons that are evolutionarily enriched in highly translated mRNA transcripts are often optimal codons (i.e. triplets that are decoded by tRNAs of relatively higher abundance), whereas codons that exhibit no such selective bias are typically non-optimal and are decoded by tRNAs of relatively lower abundance. Since codon bias is distinct for every genome and represents a balance between selection, mutation, and genetic drift, codon optimality is often found to be distinct between species (Bulmer et al., 1991; Hershberg and Petrov, 2008; Man and Pilpel, 2007; Rocha, 2004). In broad terms, it is generally accepted that the speed at which the ribosome decodes is affected by the subtle distinctions in tRNA concentrations between synonymous sets of codons (Dong et al., 1996; Sorensen et al., 1989; Tuller et al., 2010; Varenne et al., 1984). Thus tRNA abundance is a critical regulator of ribosome elongation rates and therefore can impact the efficiency of protein folding, protein stability, protein activity, and the coordinate expression of functionally related genes (Kim et al., 2015; Pechmann and Frydman, 2013; Sander et al., 2014; Spencer et al., 2012; Yu et al., 2015; Zhang et al., 2009).
Attempts to observe differences in elongation rate that are dependent on codon identity and optimality using ribosome profiling (Ingolia et al., 2009), however, have been challenging. While a number of studies have found a modest correlation between codon optimality and ribosome occupancy (Charneski and Hurst, 2013; Ingolia et al., 2011; Li et al., 2012; Pop et al., 2014), others have observed increased ribosome occupancy on codons with low abundance cognate tRNAs (Dana and Tuller, 2014; Gardin et al., 2014). There has been great effort to resolve these discrepancies, with recent work showing that coupling between codon optimality and ribosome occupancy can be masked by pre-treatment of cells with translational inhibitors (Hussmann et al., 2015; Weinberg et al., 2016).
The regulation of elongation rate and post-translational events (i.e. protein folding and protein activity) by codon optimality is simply a consequence of functional tRNA concentration, a “passive response”. On the contrary, the regulation of mRNA turnover by codon optimality likely represents a more active process, with the ribosome’s elongation rate under constant surveillance by component(s) of the mRNA turnover complex. Herein we focus on identifying a cellular factor that senses slow ribosomes to coordinate and couple translation and mRNA decay.
Dhh1p (DDX6) is a highly conserved and abundant DEAD-box protein previously implicated in translational repression (Carroll et al., 2011; Coller and Parker, 2005) and mRNA decay (Coller et al., 2001; Fischer and Weis, 2002; Presnyak and Coller, 2013). In budding yeast, loss of DHH1 activity results in a block in mRNA decapping, but unlike other decapping regulators, this function is dependent on the translational status of the mRNA (Coller et al., 2001; Coller and Parker 2005). Moreover, previous studies showed that direct tethering of Dhh1p to the 3’ UTR of a reporter mRNA resulted in loss of protein production but dramatic ribosome accumulation on the message. These data suggest that Dhh1p directly impacts ribosome movement or processivity (Sweet et al., 2012).
Here we demonstrate that Dhh1p is a critical factor in distinguishing between mRNAs containing optimal and non-optimal codons and targeting them for decay. mRNA binding studies show that Dhh1p is more efficiently recruited by non-optimally coded mRNAs. In addition, ribosome occupancy is specifically modulated on optimally and non-optimally coded genes (and codons) by Dhh1p. Finally, Dhh1p binds to ribosomes in vivo. Together these results suggest that Dhh1p is a sensor of slow ribosomes and communicates this information to the mRNA decay machinery to consolidate downstream output.
RESULTS
Codon optimality is a powerful determinant of mRNA decay
We have previously demonstrated that codon optimality is a major determinant of mRNA degradation in S. cerevisiae. In our previous work, we established a biological metric that indicates the overall contribution of each of the 61 codons toward mRNA stability. We referred to this metric as the codon stabilization coefficient (CSC). Because these CSC scores correlated nicely with previously established metrics for optimality (Pechmann and Frydman, 2013; dos Reis et al., 2004), we argued that mRNA stability is influenced by translational elongation rate.
An analogous metric is the tRNA Adaptation Index (TAI), which quantifies the relative cellular “supply” of cognate and near-cognate tRNAs for a given codon (dos Reis et al., 2004). However, in this study, we use a slightly different metric referred to as the species-specific TAI or sTAI (Sabi and Tuller, 2014). While these quantities are largely identical on a per-codon basis, the parameters for sTAI are derived purely through sequence information, whereas the original definition of TAI takes into account actual gene expression data. As we here characterize codon effects on gene expression and translation, we opted for the more naïve metric (sTAI) to avoid the potential pitfall of data overfitting.
Here we began our study by following up on earlier results (Presnyak et al., 2015) and creating eleven constructs that differ slightly in codon optimality, as defined by both CSC and sTAI. Importantly, all eleven constructs produce the identical polypeptide (i.e. the HIS3 protein; Figure 1A) but do so using a distinct mixture of synonymous optimal or non-optimal codons. Between these constructs, the percentage of optimal to non-optimal codons varies by only 10 percent, allowing for coverage of the complete range of optimal codon content seen within the genome (Fig. 1A). The assignment of codons within each construct was done randomly using a computer algorithm (Fig. S1A and Table S1) where the average CSC and sTAI for each construct were found to be highly correlated (Fig. S1B). We monitored mRNA decay rate using a temperature sensitive allele of RNA polymerase II (i.e. rpb1-1). Transcription was inhibited by quickly shifting cells from a permissive temperature to a restrictive temperature (from 24°C to 37°C). Time points following this shift were taken, and mRNA was analyzed by Northern blot. As shown in Fig. 1B (left panel), the mRNA half-life varies with changing optimal codon content. These data agree with our previous findings that codon optimality is a major determinant of mRNA stability (Presnyak et al., 2015).
Figure 1. Codon optimality is a powerful determinant of mRNA stability.

See also Figure S1 and Table S1. (A) Representation of the HIS3 mRNA reporter. Each reporter encodes the exact same polypeptide sequence, but is comprised of different codon composition of varying optimality. The average codon stabilization coefficient (CSC) and species-specific tRNA adaptation index (sTAI) for each construct is shown. (B) Northern blots of the HIS3 reporter series following transcriptional shut-off in a rpb1-1 strain (left panel). The right panel shows the same reporters recloned with the GAL1 inducible promoter. Shown are Northern blots following transcriptional inhibition with glucose. (C) Graphs the half-lives of the mRNA reporters in panel B.
Importantly, protein synthesis rates are sensitive to stresses such as temperature shifts. Thus, the use of the temperature-sensitive allele rpb1-1 to monitor mRNA degradation has the potential to be misleading. To address this issue, we used an independent approach to test the influence of codon optimality on mRNA decay. For this experiment, we placed the same eleven constructs in Figure 1B (left panel) under the control of the inducible GAL1 promoter. Cells were grown in galactose at 24°C to mid-log phase. Transcription was then inhibited by adding glucose but maintaining the cells at 24°C. Following the addition of glucose, time points were taken, and mRNA was analyzed by Northern blot. Here, we also observed that codon optimality has a powerful influence on mRNA decay (Fig. 1B, right panel). In fact, the mRNA half-lives observed using the GAL1 shutoff approach are nearly identical to those obtained using an rpb1-1 shut-off (Fig. 1C). In both experiments, we observe the complete range of observed decay rates (from 3 min. to 45 min.) simply by changing codon composition without altering the polypeptide sequence. Together, these results indicate that codon optimality is a major contributor to mRNA stability. Importantly, even 10% changes in codon content have powerful effects on mRNA stability.
Dhh1p stimulates the degradation of mRNAs of low codon optimality
As a known regulator of mRNA decapping and a translational repressor, two qualities that seem potentially relevant to the direct coupling between mRNA decay with codon optimality, we asked whether Dhh1p is a critical factor in mediating this connection by determining the influence of Dhh1p on the decay of RNA reporters of differing codon optimalities. For this, we utilized two reporter constructs (Fig. 2A) that encode the same polypeptide but are composed of either all optimal codons (OPT) or synonymous non-optimal (NON-OPT) codons (Presnyak et al., 2015). The reporter mRNAs were expressed under the control of the GAL1 UAS allowing us to monitor mRNA decay as described above. As shown in Figure 2B, the OPT mRNA (sTAI = 0.539) is more stable than the NON-OPT mRNA (sTAI = 0.167) in WT cells (t1/2= 17 min. vs. 3 min. respectively), consistent with our previous findings (Presnyak et al., 2015). Importantly, however, in the absence of DHH1, the OPT mRNA’s half-life is unchanged relative to WT, while the NON-OPT is substantially stabilized (Fig. 2B). Indeed, in the absence of DHH1, the stability of the NON-OPT mRNA now mirrors that of the OPT mRNA. As a control we repeated these experiments in cells lacking PAT1 (another regulator of mRNA decapping), CCR4 (the major deadenylase), or DCP2 (the catalytic subunit of the decapping enzyme). In each case, the stability of both the OPT and NON-OPT mRNA increases, as anticipated for proteins with known roles in mRNA decay, but the difference in stability of the OPT and NON-OPT constructs persists. Together, these data demonstrate that Dhh1p is a critical factor in determining the influence of codon optimality on mRNA decay.
Figure 2. Dhh1p selectively stimulates the decay of mRNAs with low codon optimality.

See also Figure S2. (A) Representation of the synthetic mRNAs (SYN) and the encoded polypeptide sequence. Optimal (OPT) or non-optimal (NON-OPT) codons encoding the same peptide were used. The artificial peptide has no similarity to any known proteins. (B) The half-lives of SYN OPT and NON-OPT mRNAs in WT and different mutant strains were obtained from GAL1 shutoff experiments. Quantitations were normalized to the amount of SCR1 RNA. *Denotes average of 3 experiments. (C) Half-lives of HIS3 reporters from Figure 1B (GAL1 UAS constructs) in WT or dhh1Δ cells. Right panel indicates fold stabilization in a dhh1Δ cells vs. WT. (D) Quantification of steady state levels of mRNAs transcripts by RNA-Seq in dhh1Δ cells (RPKM) relative to WT cells (RPKM). mRNA transcripts are binned by sTAI, a numerical proxy for overall optimality. Shown are two biological replicates. A two-tailed Mann-Whitney test shows that low optimality mRNAs (sTAI = 0.25, Med. = 1.52) are enriched relative to high optimality mRNAs (sTAI = 0.55, Med. = 0.72) upon Dhh1p depletion, U = 1668, p < 2.2×10⁻¹⁶.
We next measured the influence of Dhh1p on the decay of the eleven reporters used in Figure 1B. The reporter mRNAs were expressed in dhh1Δ cells under the control of the GAL1 UAS allowing us to determine mRNA half-life by glucose-dependent transcriptional inhibition. RNA levels were quantitated by Northern blot. As shown in Figure 2C, we observed that loss of DHH1 had the most dramatic effect on the mRNA reporters of low codon optimality (Fig. 2C; 0–50% percent optimal codons). The reporters bearing a high percentage of optimal codons were predominately unaffected by loss of DHH1. The data are consistent with our hypothesis that Dhh1p controls mRNA degradation by sensing translational elongation rate.
We extended our reporter analysis of Dhh1p to the entire genome by performing mRNA-seq in WT vs. dhh1Δ cells (Fig. 2D). Binning mRNAs by sTAI, we find that low sTAI mRNAs are preferentially stabilized in the absence of DHH1. To address possible concerns that sTAI is not directly reporting on the effects of codons on translation but is serving as a proxy for GC-content and/or mRNA structure, we looked at the correlation between sTAI and GC content (Fig. S2A) and asked whether the differential steady state levels of mRNA transcripts in WT cells vs. dhh1Δ exhibited a dependence on the GC content of the transcript. They do not (Fig. S2B). Thus, the major trend that emerges as significant from our analysis of the dhh1Δ strain relative to the WT is a correlation between sTAI and mRNA levels. Furthermore, our method for binning is a consequence of natural codon usage, i.e. most genes within the genome are relatively non optimal with a subset that are predominantly optimal. We attempted to address concerns that the observed phenotype could be entirely due to the effect of a few outlier genes with extreme values of sTAI. Thus, we performed this analysis using equivalent bin sizes rather than bins equivalently distributed across the ordinate of sTAI (Fig. S2C) where, ultimately, a similar trend emerges.
mRNA levels under constitutive overexpression of Dhh1p via a GPD promoter, however, show no such trends with respect to optimality, suggesting that availability of downstream components (decay factors) may be limiting in these cells (Fig S2D and S2E). Indeed, endogenous Dhh1p concentrations within the cell are already in large excess relative to other decapping factors (Ghaemmaghami et al., 2003). While the genome-wide data represent a steady state analysis of mRNA levels, which necessarily misses some of the texture of a kinetic analysis, the data are nevertheless strikingly consistent with the kinetic observations made with reporter mRNAs.
Dhh1p binds preferentially to mRNA of low codon optimality
The Dhh1p-dependent selective degradation of mRNAs of low sTAI predicts that Dhh1p will preferentially associate with these mRNPs. To test this, we determined the relative amount of Dhh1p associated with our OPT and NON-OPT mRNA reporters using an affinity pull-down approach (Fig. 3A). Specifically, we treated cells with a low level of formaldehyde to crosslink RNA to associated proteins. We prepared cell lysates and hybridized the mRNA samples to DNA oligonucleotides conjugated to biotin that are antisense to the common 3’ UTR of the OPT and NON-OPT reporters. Following hybridization, RNP complexes were affinity purified using magnetic streptavidin beads. Bound material was stringently washed and then elution was performed using a low salt buffer. This approach was able to greatly enrich reporter mRNAs relative to an endogenous PGK1 mRNA (Figure 3B). Moreover, analysis of Dhh1p bound to reporter mRNA by Western blot revealed a three-fold enrichment of Dhh1p on the NON-OPT mRNA relative to the OPT mRNA. As a control, we found that the concentration of Poly(A) Binding Protein (Pab1p) isolated on both mRNAs was equal (Fig. 3C); as anticipated, we found no discernible GAPDH associated with either mRNP.
Figure 3. Dhh1p preferentially binds to mRNAs with low codon optimality.

(A) Representation of the reporters and experimental design used for mRNA pulldown. A tag sequence was inserted in the 3'UTR of the SYN reporters for pulldown. (B) Northern blot for the SYN mRNAs pull-downs. PGK1 mRNA was probed as a control of specificity. o: optimal, n: non-optimal. (C) Western blot showing the amount of Dhh1p, Pab1p and GAPDH pulled down by the SYN mRNAs. Quantitations of Dhh1p were normalized to mRNA levels from eluates in b. (D) Reanalysis of previously performed CLIP-Seq on Dhh1p calculating enrichment of mRNA transcripts bound to Dhh1p relative to WT conditions, where transcripts are binned by sTAI. Shown are two biological replicates. A two-tailed Mann-Whitney test shows that low optimality mRNAs (sTAI = 0.25, Med. = 2.02) are preferentially bound to Dhh1p relative to high optimality mRNAs (sTAI = 0.55, Med. = 0.32), U = 304, p = 7.1×10⁻⁹.
We extended this reporter analysis to define the association of Dhh1p with all mRNA transcripts on a genome-wide basis. Previous CLIP studies found that Dhh1p bound throughout the 5’ and 3’ UTRs and the ORF of most genes with no discernible binding motif and little apparent enrichment in any particular region of the transcript. We used the same published Dhh1p CLIP data (Mitchell et al., 2013) and asked whether association of Dhh1p was governed by the optimality of the transcript. In both replicates of the CLIP experiment, we see that Dhh1p is preferentially bound to low sTAI genes relative to higher sTAI genes (Fig. 3D).
The number of slow moving ribosomes stimulates mRNA decay
We have previously demonstrated that the ratio of optimal to non-optimal codons is a key determinant in mRNA half-lives (Presnyak et al., 2015). And here we have shown that Dhh1p selectively binds mRNAs of low codon optimality and is critical in dictating codon-defined mRNA stability. A parsimonious explanation for these observations is that the density of slow moving ribosomes on an mRNA (dictated by codon optimality) is sensed by Dhh1p and communicated to the mRNA degradation machinery. We tested this idea by generating a series of reporters based on the highly optimal PGK1 mRNA where into each derivative we placed an identical stretch of 10 amino acids of exceptionally low sTAI (sTAI = 0.101) at increasing distances from the initiating AUG (5%, 25%, 50%, 63%, and 77% away) (Fig. 4A). Importantly, the non-optimal codon (NC) stretch is of sufficiently low sTAI that it is predicted to dramatically slow ribosomes at the site and in turn upstream; we see that protein expression is strongly and equivalently reduced for all five constructs to roughly 10% of that of the normal PGK1 mRNA (see Fig S3A). As before, we monitored the mRNA half-lives of these reporters using a GAL-transcriptional shut-off approach. We observed a striking polarity for the overall half-lives of the mRNAs that scaled with the distance of the NC stretch from the AUG. Importantly, the polarity of RNA decay was abrogated on deletion of DHH1 (Fig. 4C). The least stable mRNA reporters are those with the NC stretch the furthest from the AUG start site where the maximal number of ribosomes would likely have accumulated on the ORF. These data indicate that the number of slow moving (or stalled) ribosomes is at a minimum correlated with the half-life of the mRNA.
Figure 4. Dhh1p senses the polarity of a stretch of non-optimal codons in an optimal mRNA.

See also Figure S3. (A) Representation of PGK1 reporters with a stretch of 10 non-optimal codons at increasing distances from the initiating AUG. NC: Non-optimal Codons; NC0: no stretch, NC5, 25, 50, 63, 77: Non-optimal Codon stretch 5, 25, 50, 63, 77% away from the AUG. (B) Northern blots of the different PGK1 reporters after GAL-transcriptional shut-off, showing the remaining mRNA at the indicated time-points after shut-off. (C) Half-lives of the different PGK1 reporters calculated from the northern blots (quantitation was normalized to SCR1, loading controls not shown), in WT and dhh1Δ cells.
First, we verified that the polarity effect that we observed was dependent on mRNA translation by inserting a stem-loop inhibitory to translational initiation in the 5’ UTR (Fig. 5A); indeed, inhibition of translation by the stem loop abrogated the influence of the NC stretch on mRNA decay (Fig 5B). Second, we determined if the polarity effect resulted from ribosome events occurring upstream of the NC stretch or downstream. This idea was tested by placing a premature termination codon immediately after the NC stretch, such that once termination has occurred, ribosomes will no longer be associated downstream of the STOP codon (it follows that these ORFs are now very different in size) (Fig. 5C). In a WT yeast background, these reporters exhibit an inverse polarity for their stability, as anticipated from the impact of the nonsense mediated decay (NMD) pathway on their stability. However, when these same reporters are evaluated in a upf1Δ background, we see that the polarity of mRNA degradation is preserved (Fig 5D). These data are consistent with models suggesting that ribosomes stacked upstream of slow codon regions are critical to defining the stability of the various reporter mRNAs.
Figure 5. Dhh1p-mediated degradation is dependent on inefficient translation.

See also Figure S3. (A) A stem loop (SL) was inserted in the 5'UTR of the previously described PGK1 reporters containing non-optimal codons at variable positions to inhibit translation. (B) Northern blot for steady-state abundance of the reporters with and without SL, and relative levels on the right. SCR1 was probed as a loading control. (C), A premature termination codon (PTC) was inserted immediately after the NC stretch of the reporters to prevent ribosome association downstream of the stretch. (D) Northern blot for steady-state abundance of the reporters with and without PTC, and relative levels below. SCR1 was probed as a loading control.
Lastly, there are numerous quality control mechanisms that exist within the cell to monitor aberrant translation events (Shoemaker and Green, 2012). As it is formally possible that one of these QC pathways might recognize ribosomes stalled at non-optimal codons as aberrant, we asked whether the polarity effects that we observed resulted from the action of these pathways by performing the same analyses in different mutant backgrounds (dom34Δ, ltn1Δ, rqc1Δ, hel2Δ). Reassuringly, none of these components were observed to impact the polarity of mRNA decay observed in the reporter constructs (Fig S3B).
Collectively, these data indicate that the polarity of mRNA degradation is translation-dependent and depends on ribosome-associated events localized between the AUG start site and the NC stretch. The simplest explanation for these observations is that the number of slow moving ribosomes on an mRNA determines the level of mRNA degradation observed.
Dhh1p binds physically to the eukaryotic ribosome
While CLIP data suggest that Dhh1p may directly bind to mRNA, thus dictating downstream functional consequences, it seems possible that like other DEAD-box proteins (Geissler et al., 2012; Gingras et al., 1999), Dhh1p could also interact directly with the ribosome to mediate function. We tested this hypothesis by using a tandem-affinity tag (TAP) to purify Dhh1p from yeast cells and identify associated complexes by mass-spec. Importantly, we observed eight prominent protein bands upon purification that we identified as ribosomal proteins (Fig. 6A). The association with Dhh1p with the ribosome was RNase A insensitive, suggesting a direct ribosome association (data not shown). We next repeated our TAP purification and probed for specific RNA species by Northern blot. We observe that both the 25S and 18S rRNA co-purify with Dhh1p, while other transcripts such as the 7S RNA (SCR1) or tRNA do not. Together, these data indicate that Dhh1p physically interacts with the ribosome.
Figure 6. Dhh1p binds ribosomes and preferentially modulates ribosome occupancy on mRNAs with low codon optimality.

See also Figure S4. (A) Dhh1p-TAP purification followed by mass spectrometry (left, Coomassie blue gel staining) or Northern blots and specific probing for different rRNAs or tRNA (right). (B) Plotting the ribosome occupancy (average number of ribosomes per mRNA transcript) for mRNA transcripts under constitutive Dhh1p OE relative to WT conditions, binning transcripts by sTAI. Shown are two biological replicates. A two-tailed Mann-Whitney test shows that low optimality mRNAs (sTAI = 0.25, Med. = 1.30) have increased ribosome occupancy relative to high optimality mRNAs (sTAI = 0.55, Med. = 0.72), U = 1364, p < 2.2×10⁻¹⁶ upon Dhh1p overexpression (C) Quantifying the ribosome footprint density in the A-site under Dhh1p OE or dhh1Δ relative to WT. The identity of the codon in the A-site was determined by using 28-nt fragments as outlined previously (Ingolia et al., 2009). (D) Schematic of the reporter used in polysome occupancy assays. (E) Northern blots were used to quantify the enrichment (relative fractional occupancy) of optimal and non-optimal HA-OST4 mRNA along a polysome gradient upon tethering catalytically active and inactive Dhh1p. Reported values are averaged across three samples and presented with standard error. Shown are representative northern blots for the non-optimal and optimal mRNAs upon tethering of catalytically active and inactive Dhh1p.
Ribosome occupancy is enhanced when Dhh1p is bound
Given the connection that we have established between ribosome density and Dhh1p function in mRNA decay, we next asked whether on a global scale there is preferential effect of Dhh1p on the ribosome occupancy on mRNAs of low codon optimality. Ribosome profiling was performed in four S. cerevisiae strains, wild type, dhh1Δ and constitutively overexpressed (OE) Dhh1p(OE) and Dhh1p-DQAD(OE). The DQAD allele has been previously shown to render Dhh1p nonfunctional (Coller and Parker, 2005). While an assessment of ribosome occupancy (the average number of ribosomes on a given transcript) between the four strains failed to reveal genes or ontological categories of interest, characterizing genes binned according to their overall optimality (sTAI) revealed interesting features. In the Dhh1p(OE) strain, we see a clear pattern of increased ribosome occupancy on non-optimal genes (Fig. 6B). As a control we performed a similar analysis, measuring ribosome occupancy changes in the Dhh1p(OE) strain relative to the catalytically inactive Dhh1p protein (Dhh1p-DQAD(OE)). Again we observe enrichment of ribosomes on low optimality mRNAs, suggesting that this differential ribosome occupancy is dependent on the catalytic activity of Dhh1p (Fig. S4A).
We next took advantage of the nucleotide resolution of ribosome footprint profiling to see if increased occupancy on non-optimal genes could be resolved at the codon level. To perform this analysis, we looked at a subset of the reads from footprint profiling (28-nt fragments) in the mutant and wild type strains to characterize A-site occupancy. We find that when Dhh1p is overexpressed, relative to wild type, there is increased footprint density when non-optimal codons occupy the A site (Fig. 6C); no trends based on codon optimality are seen in the dhh1Δ strain.
We additionally profiled strains carrying tethered-reporter constructs similar to those previously characterized (Sweet et al., 2012). Here we use an mCherry reporter RNA (sTAI = 0.422) tethered through a BoxB-Lambda N system to either Dhh1p or Dhh1p-DQAD (Franklin, 1985a, b; Lazinski et al., 1989). The Dhh1p-tethered mCherry reporter mRNA exhibits 2.7-fold greater ribosome occupancy than the Dhh1p-DQAD tethered reporter (Fig. S4B) with reads distributed throughout the ORF. These data are consistent with the global analysis above and with earlier polysome profiling analysis (Sweet et al., 2012).
We next probed the connection between ribosome occupancy, Dhh1p function, and codon optimality. We employed a similar tethering experiment, but using instead a short ORF (OST4) construct designed to allow for high resolution sucrose gradient analysis (Fig. 6D). We made synonymous variants of this OST4 ORF with either high optimality (sTAI = 0.454) or low optimality (sTAI = 0.203) and evaluated its association with polysomes. With this refinement, we could see differences in ribosome occupancy on ORFs as a function of codon optimality. Consistent with our model, we see a clear increase in ribosome occupancy on the HA-OST4-NON-OPT mRNA relative to the HA-OST4-OPT mRNA, dependent on the presence of functional Dhh1p (Fig 6E).
DISCUSSION
It is well established that mRNA translation and mRNA stability are tightly coupled events, although it is unclear at a molecular level how these processes are connected. Recently, we established that codon usage strongly impacts both mRNA stability and translational elongation (Presnyak et al., 2015). In this study, we provide a mechanistic understanding of how the rates of translation are communicated to the mRNA degradation apparatus. We propose that the decapping activator and translational regulator Dhh1p is a sensor of ribosome speed across the transcriptome (Fig. 7). We hypothesize that Dhh1p dynamically samples elongation events, binding to the translating mRNPs when elongation is slow. Dhh1p’s association with the translating mRNP may act to slow ribosome movement even further, suggesting an active, rather than a passive role in coupling translation repression to decay, however, further studies are required to glean mechanistic insight. Ultimately, Dhh1p’s association with the translating mRNP leads to activation of mRNA decapping and degradation.
Figure 7. Model: Dhh1p is a general and essential sensor of ribosome speed during elongation.

In this model, codon optimality influences the transit speed of ribosomes which in turns affects the association of the decay factor Dhh1p. Ribosomes are slowed down on non-optimal stretches, recruiting Dhh1p which may slow down ribosome movement further, and leads to mRNA decapping and degradation.
Dhh1p and homologs are implicated in translational control
A role for Dhh1p in regulating translation elongation is consistent with observations from other systems. For instance, in Drosophila, translationally repressed oskar and nanos mRNAs are found on polyribosomes in a so called “masked” state; the Dhh1p-homolog Me31b is required for their masking (Braat et al., 2004; Clark et al., 2000; Nakamura et al., 2001). Similarly, the Fragile X Mental Retardation Protein (FMRP), a polysome-associated neuronal RNA binding protein that interacts with Me31b (Barbee et al., 2006), was recently found to regulate translation by inducing stalling of ribosomes on target mRNAs (Darnell et al., 2011). Given the high conservation and essential nature of Dhh1p in higher eukaryotes, it seems likely that such a critical role in modulating translational elongation is conserved throughout the eukaryotic lineage.
Dhh1p and homologs have also been implicated in the regulation of translational initiation. Recombinant Dhh1p in high concentrations inhibits 48S ribosome initiation complex formation in vitro (Coller and Parker, 2005). Moreover, multiple recent studies interested in miRNA-mediated regulation have implicated the mammalian Dhh1p homolog, DDX6, in interactions with the CCR4-NOT complex relevant to translational silencing (Chen et al., 2014; Mathys et al., 2014; Ozgur et al., 2015; Rouya et al., 2014); there is emerging consensus in this field that translational inhibition in these systems is imposed at the initiation step (Fabian and Sonenberg, 2012).
A role for Dhh1p in controlling translational initiation and elongation need not be mutually exclusive. Indeed, we have documented that Dhh1p contacts the ribosome. Thus the regulation of both elongation and initiation by Dhh1p may be a manifestation of the same molecular contacts with the ribosome itself. The seemingly distinct cellular responses may simply depend on the relative concentrations of the factor and the state of the ribosome being accessed (the kinetics and thermodynamics of the event). In higher eukaryotes, recent findings suggest that the basis for these disparate cellular roles may lie in the complex macromolecular associations that the DDX6-CCR4-NOT complex makes with downstream effector proteins (Ozgur et al., 2015). Detailed understanding of the molecular contacts of Dhh1p with the ribosome may ultimately reconcile these apparent discrepancies.
Normal mRNA decay is a response to subtle changes in translation rate
It is well established that the ribosome is centrally involved in specifying mRNA degradation on aberrant transcripts. The processes of Nonsense-Mediated Decay (NMD), No-Go Decay (NGD), and Non-Stop Decay (NSD) all are dictated by abnormal events on the ribosome within the ribosomal A site (i.e. a premature termination codon, a truncated mRNA or a string of AAA (lysine) codons) (Shoemaker and Green, 2012). Importantly, however, a direct connection between ribosome function and normal mRNA decay has not been established. Our data here provide clear evidence for an intimate connection between efficient translation of mRNAs by ribosomes and normal mRNA decay mediated by the DEAD-box protein Dhh1p. Given that the main function of an mRNA is the production of protein product through translation, such a central role for the ribosome in specifying its stability is reassuring.
STAR Methods Text
Contact for Reagent and Resource Sharing
Please direct any requests for further information or reagents to the lead contact, Jeff Coller (jmc71@case.edu).
Experimental Model and Subject Details
Yeast strains and growth conditions
Yeast strains used in this study are listed in Table S2. All strains, excepting those used for polysome and ribosome profiling, were grown at 24°C in standard synthetic media with the appropriate amino acids and either 2% glucose or 2% galactose/ 1% sucrose. Cells were harvested at mid-log phase (OD600=0.4–0.55).
Cells used in polysome profiling were grown in dropout media (CSM –Leu – Ura) and 2% Galactose/Raffinose at 30°C until mid-log ph ase (OD600=0.45–0.5). Cells used in ribosome profiling and RNA-Seq were grown at 30°C in either YPD or with CSM – Leu dropout media and with 2% Glucose for those transformed with the pAG425 plasmid and CSM –Leu – Ura and 2% Galactose/Raffinose for those transformed with both the pAG425 and pYES-DEST52 plasmids. Cells were harvested at early-log phase (OD600=0.3–0.35).
Method Details
Plasmids, oligonucleotides and strain construction
All oligonucleotides used in this study are listed in Table S3. All plasmids used in this study are listed in Table S4.
For the HIS3 constructs with 0–100% optimality (in 10% increments), oJC2724 to oJC2732 were cloned into pJC716 (Presnyak et al., 2015) using AscI and PacI restriction sites to create HIS3 constructs with 10–90% optimality, respectively. pJC716 (100% optimality), pJC719 (0% optimality, Presnyak et al., 2015), and these 10–90% optimality constructs were subsequently mutagenized using oJC2857/oJC2858 (pJC716), oJC2861/oJC2862 (40% and 50% optimality), oJC2912/oJC2913 (pJC719), oJC2914/oJC2915 (10% optimality), oJC2916/oJC2917 (20% and 30% optimality) and oJC2918/oJC2919 to oJC2924/oJC2925 (60% to 80% optimality, respectively). The resulting plasmids, pJC797 and pJC800 to pJC809, express N-terminally FLAG-tagged HIS3 with 0–100% optimality (in 10% increments). Importantly, a stretch of 23 nucleotides (GGAGTAAAAAGGTTTGGATCAGG) was maintained in all HIS3 constructs to allow for northern analysis using oligo probe oJC2564.
In order to place the 0–100% optimality HIS3 constructs under the control of the GAL1 promoter, an MluI restriction site was introduced upstream of the HIS3 5’ UTR in pJC797 and pJC800 to pJC809 using oJC3083/oJC3084. The GAL1 promoter (amplified from pFA6a-kanMX6-PGAL1 from (Longtine et al., 1998) using oJC3086/oJC3087) was subsequently cloned into these plasmids using MluI and PacI sites, resulting in the replacement of the HIS3 5’ UTR with the GAL1 promoter and the creation of plasmids pJC857 to pJC867.
To construct the PGK1NC5-HA-MS2 reporter containing 10 non-optimal codons 5% away from the initiating AUG (pJC468), DNA was first amplified from pJC296 (PGK1-pG, pRP469) (Decker and Parker, 1993) using oligonucleotides oJC558/oJC877 and oJC559/oJC876 then combined and used as the template for amplification of full-length PGK1 using oligonucleotides oJC558/oJC559. Full-length fragments were cloned into the HindIII and BamHI sites of pJC296 to give pJC399. pJC468 was obtained by inserting HA-MS2 extracted from pJC441 (PGK1-HA-MS2, Sweet et al., 2012) into BglII and HindIII of pJC399.
PGK1NC25-HA-MS2 (pJC469), PGK1NC50-HA-MS2 (pJC470) and PGK1NC63-HA-MS2 (pJC471) were constructed in a similar manner using oJC1261/oJC1244 and oJC1245/oJC559 (pJC469), oJC1261/oJC1246 and oJC1247/oJC559 (pJC470) or oJC1261/oJC1248 and oJC1249/oJC559 (pJC471) and combining the DNA with oJC1261/oJC559 to introduce into the XmaI and HindIII sites of pJC441 (PGK1-HA-MS2). PGK1NC77-HA-MS2 (pJC443) was obtained by inserting HA sequence into the AscI and PacI sites (before stop codon) of pJC425 (PGK1NC77-MS2, Sweet et al., 2012) using oJC1196/oJC1197. PGK1NC5-PTC-HA-MS2 (pJC484), PGK1NC25-PTC-HA-MS2 (pJC485), PGK1NC50-PTC-HA-MS2 (pJC486), PGK1NC63-PTC-HA-MS2 (pJC487) and PGK1NC77-PTC-HA-MS2 (pJC488) reporters were obtained by introducing a PTC after the stretch of non-optimal codons by site-directed mutagenesis of the plasmids pJC468 (using oJC1307/oJC1308), pJC469 (using oJC1309/oJC1310), pJC470 (using oJC1311/oJC1312), pJC471 (using oJC1313/oJC1314) and pJC443 (using oJC1315/oJC1316), respectively. pJC134 (SL-PGK1, stem-loop containing reporter, Hu et al., 2009) was used to create pJC442 (SL-PGK1-HA-MS2, Sweet et al., 2012). SL-PGK1NC5-HA-MS2 (pJC497) and SL-PGK1NC77-HA-MS2 (pJC498) were obtained by inserting the stretch of non-optimal codons into pJC442, by site-directed mutagenesis using oJC1370/oJC1371/oJC1372/oJC1373 (pJC497) or oJC1374/oJC1375/oJC1376/oJC1377 (pJC498).
To construct the reporters containing the tag sequence (AGATGGTGATGT TAATGGGCAC AAATTTTCTG TCAGTGGAGA GGGTGAAGGT GATGCAACAT ACGGAAAACT TACCCTTAAA TTTATTTGCA CTACTGGAAA ACTACCTGTT CCATGGC) for mRNA pulldown experiment at the 3’-UTR of the plasmids bearing SYN opt RNA (pJC672) and SYN nonopt RNA (pJC673), XhoI and AscI sites were introduced by using oJC2476/oJC2477 and oJC2478/oJC2479 to generate pJC704 and pJC705. tag sequence was amplified from pKB290 with oJC2024/oJC2480, and inserted into the XhoI and AscI site of pJC704 and pJC705 to generate pJC706 and pJC707. These plasmids were transformed into yJC1780 to make yJC2018 and yJC2019.
To construct Dhh1p-TAP for the affinity purification experiments, Dhh1p-TAP sequence was amplified from genomic DNA in YDL160C with oJC126/oJC232 to create pJC223, which was transformed into yJC151 to make yJC335. A control plasmid expressing TAP only (pJC228) was obtained by deleting Dhh1p from pJC223 after introduction of XhoI sites by site-directed mutagenesis at the AUG and stop codons of Dhh1p (using oJC242/oJC243/oJC244/oJC245). pJC228 was transformed into yJC151 to obtain yJC278.
Transcriptional shutoffs and steady state RNA Northern blot analysis
For the rpb1-1 shutoffs, cells were grown at 24°C in synthetic med ia containing 2% glucose and lacking the appropriate amino acids. Once the cells reached mid-log phase, they were shifted to 37°C to inhibit transcription, and cell aliquots were harvested at the time points indicated in Fig. 1.
For the GAL1 promoter shutoffs and steady state analysis, cells expressing the appropriate plasmids were grown at 24°C in syntheti c media with 2% galactose/ 1% sucrose to allow for expression of the reporter mRNA. For the steady state analysis, cells were harvested at OD600=0.4. For the transcriptional shutoffs, cells were shifted to synthetic media without sugar at an OD600=0.4, and then transcription was repressed by adding glucose to a final concentration of 4%. Cells were collected at the time points indicated in the figures.
Total RNA was extracted by phenol/chloroform and precipitated by 95% EtOH. 30–40 µg of RNA was separated on 1.4% agarose-formaldehyde gels, transferred to nylon membranes and probed with 32P-labeled oligonucleotides antisense to HIS3 (oJC2564), poly (G) (oJC168), MS2 binding sites (oJC1006), PGK1 (oJC986) or SCR1 (oJC168). Blots were exposed to PhosphorImager screens, scanned by Typhon 9400, and quantified with ImageQuant software.
Protein isolation and Western blot analysis
Cells were harvested at OD600=0.4 and protein was isolated by 5M Urea and solution A (125 mM Tris-HCl pH 6.8, 2% SDS). Equivalent OD280 unit of protein was separated on 10% SDS polyacrylamide gels, transferred to PVDF membrane, blotted with primary antibodies (anti-HA [BioLegend], anti-Pab1 [EnCor Biotechnology], anti-GAPDH [Cell Biolabs] and anti-Rpl5) at 4°C overnight and incubated with secondary antibodies (goat-anti-Mouse [Santa Cruz sc-2005] and goat-anti-Rabbit [Pierce 31460]) at room temperature for 1 hr. Signal was detected by chemiluminescence using Blue Ultra Autorad film (GeneMate F-2029)
mRNA pulldown
Cells (200 ml) were harvested at OD600=0.4 after crosslinking with 0.25% formaldehyde for 5 min and quenching with 125 mM glycine for 10 min. Cell pellets were lysed in 400 ul 1X polysome lysis buffer (10 mM Tris, pH 7.4, 100 mM NaCl, 30mM MgCl2, 1 mM DTT) by vortexing with glass beads. The hot needle puncture method followed by centrifugation at 2,000 rpm for 2 min at 4°C was used to remove cell debris. Equal OD units (OD260) of each lysate were diluted to a final volume of 5 ml in the hybridization reaction buffer (final concentrations 500 mM LiCl, 0.5% SDS, 50 mM EDTA, 10 mM Tris, pH 7.5, 14% formamide and Fungal protease inhibitors.) 125 µl of streptavidin Dynabeads (Invitrogen #65002) were washed three times with an equal volume of 1X B&W buffer (5 mM Tris-HCl pH7.5, 0.5 mM EDTA and 1 M NaCl) and once with 0.1 M NaCl. The beads were then incubated with 4 nM of biotinylated oligos complementary to the tag sequence (1.67 nM of each oligo oJC2071, oJC2072 and oJC2073) in 1X B&W buffer at room temperature for 15 min. After immobilization of the biotinylated oligos, beads were washed twice with 1X B&W buffer and incubated with the 5 ml cell lysate at room temperature overnight. Beads were then washed twice with Wash buffer 1 (10 mM Tris-HCl pH7.5, 1mM EDTA, 250 mM LiCl and 0.1% SDS) and three times with Wash buffer 2 (10 mM Tris-HCl pH7.5, 1mM EDTA, 100 mM LiCl). RNA was eluted by adding 93.5 µl DEPC water and heating at 70°C for 2 min. RNA and protein were precipitated and analyzed by Northern and Western Blot, respectively. Specifically, RNA was precipitated at −20°C overnight by 0.3 M NaOAc, 1µl of glycogen (ThermoFisher AM9515) and 95% EtOH, then resuspended with 500 µl LET/SDS (1% SDS in LET buffer). Crosslinking was reversed at 70°C for 15 min and RNA was extracted once with phenol/chloroform/LET followed by another round of heating at 70°C and RNA e xtraction. RNA was precipitated in 0.3 M NaOAc, 1µl of glycogen and 95% EtOH at −20°C overnight, then resuspended in 15 µl DEPC water. For protein precipitation, eluate was concentrated in SpeedVac on high heat (37°C) to 1/5 of th e original volume and precipitated with 10% TCA at −20°C overnight. Proteins wer e pelleted at 14,000 rpm for 10 min at 4°C followed by one wash with 80% Acetone . Pellets were air-dried and resuspended in 1X SDS Sample buffer. Crosslink was reversed by heating proteins at 70°C for 1 hr and proteins were denatur ed at 95°C immediately. For Figure 2, 2L liquid-culture (10 mRNA pulldown reactions) were used for each experimental group. 1/10 of sample was used for Northern RNA analysis and 9/10 of sample was used for Western protein analysis.
Tandem affinity purification
Dhh1p-TAP and associated complexes were purified from yeast cells by TAP method as described in (Rigaut et al., 1999). Briefly, cells (grown to OD600=1.2–1.3) were pelleted for 5 min, then washed and resuspended in one volume of ice cold buffer (10 mM K-HEPES pH7.9, 10 mM KCl, 1.5 mM MgCl2, O.5 mM DTT, protease inhibitors). The cells were then passed 3 times through a French-press (1,000 to 1,200 psi) and the lysate was centrifuged at 16,500 rpm for 20 min at 4°C. The supernatant was diluted in a final concent ration of 10 mM Tris-HCl pH 8.0, 150 mM NaCl, 0.1 % NP-40 (IPPI50 Buffer), 50 mg/ml heparin, and incubated with Sepharose 6B beads for 30 min at 4°C then I gG Sepharose 6 Flow for 3 hr at 4°C.The suspension was passed through a Bio-R ad Poly-Prep chromatography column then the beads were washed with 30 ml of IPPI50 Buffer and 10 ml of TEV C Buffer (-EDTA) (10 mM Tris-HCl pH 8.0, 150 mM NaCl, 0.1 % NP-40, 1 mM DTT). They were resuspended in 1 mL of TEV C Buffer (-EDTA) and incubated with 120 units of TEV (tobacco etch virus protease) overnight at 4°C. The eluate was drained into a new column and washed with TEC C-buffer. The TEV supernatant was incubated for 1 hr with calmodulin sepharose at 4°C in IPPI50 CBB Buffer (10 mM Tris-HCl ph 8.0, 150 mM NaCl, 1 mM Mg(Ac)2, 1 mM imidazole, 2 mM CaCl2, 0.1 % NP-40, 10 mM ß-mercaptoethanol). After 3 washes with IPPI50 CBB Buffer, the complexes were eluted from the beads using 0.5 ml IPPI50 CEB Buffer (10 mM Tris-HCl ph 8.0, 150 mM NaCl, 1 mM Mg(Ac)2, 1 mM imidazole, 20 mM EGTA, 0.1 % NP-40, 10 mM ß-mercaptoethanol), 6 times. Proteins were precipitated with 20 % TCA on ice for 30 min, pelleted for 30 min at 4°C, washed with acetone-0.05 N HCl, then resuspend ed in SDS sample Buffer to run on SDS-PAGE. Gels were stained with Coomassie blue. The proteins were identified by mass spectrometry. For RNA analysis, eluates were precipitated in ethanol at −20°C overnight, then RNA was extr acted with phenol/chloroform and analysed by Northern blot.
Northern blots of constructs across sucrose gradients
Samples were grown in CSM-Leu-Ura and 2% Galactose/Raffinose until mid-log phase Cells were then vacuum filtered and lysed with frozen 1x lysis buffer (10 mM Tris pH 7.4, 100 mM NaCl, 30 mM MgCl2, 0.5 mg/mL heparin, 1 (OD600=0.45–0.5). mM DTT, 100 µg/mL cycloheximide, 1% Triton X-100) in a Spex 6870 freezer mill.
For Figure 4B, 20 OD260 units were loaded on a 10%-50% (w/w) sucrose gradient prepared using a BioComp Gradient Master (1:48, 81.5°, 17 rpm) in 1x gradient buffer (20 mM Tris pH8, 150 M KCl, 5 mM MgCl2, 0.5 mM DTT 100 µg/ml CHX) and spun in a SW 41 Ti rotor for 40000 rpm at 4°C f or 3 hr. Gradients were fractionated using a Teledyne Isco Foxy R2 and RNA was extracted using two rounds phenol:chloroform:isoamyl alcohol extraction (1× fraction volume) and isopropanol precipitation (500 µL 300 mM NaOAc pH5.2, 500 µL isopropanol). RNA pellets were isolated by centrifugation at 14,000 rpm at 4°C for 30 min, were washed using 70% ethanol, and the RNA was pelleted once again. Samples were dried, resuspended in 20 µL 1x TE buffer (10 mM Tris pH8, 1 mM EDTA). 20 µL of loading buffer (0.95 mL formamide, 10 µL EDTA, 40 µL H2O, 0.025% (w/v) Bromophenol blue, 0.025% (w/v) xylene cyanol) was added to each sample. 10 µL of sample from OPT OST4 gradients and 30 µL of sample from non-OPT OST4 gradients were loaded on 1% formaldehyde-agarose gels. The gels were transferred onto Hybond-N+ nylon membranes using the BioRad 785 vacuum blotter. The membrane was probed with 32P end-labeled oligonucleotides antisense to the 3’ UTR prior to the BoxB stem loops (AR-N-16). Blots were imaged using the Typhoon FLA 9500 and quantified in ImageJ.
Preparation of footprint and RNA-seq libraries
Footprints were prepared largely according to existing methods (Guydosh and Green, 2014). Upon vacuum filtration, the cells were frozen in liquid nitrogen and ground in a Spex 6870 freezer mill along with frozen lysis buffer beads (20 mM Tris pH8, 140 mM KCl, 1.5 mM MgCl2, 1% Triton X-100, 100 µg/mL CHX).
For RNA-Seq experiments, ribosomal RNA was subtracted using RiboZero Magnetic Gold (Yeast) from Epicenter, and the remaining RNA was ligated to a universal adaptor. Upon reverse transcription, circularization, and PCR amplification, cDNA fragments were sequenced on either an Illumina HiSeq2000 or HiSeq2500 machine at facilities at UC Riverside or the Johns Hopkins Institute of Genetic Medicine.
For footprint libraries, the above steps were preceded by RNase treatment, 15 U of RNase I (Ambion) per OD260 unit of the lysate, and monosome species were separated by sucrose gradient - 10%–50% (w/w) sucrose gradient, prepared as outlined in the section ‘Northern blots of constructs across sucrose gradients.’ The extracted RNA was purified from a 15% denaturing PAGE gels between markers of the following sizes: 25–34 nt (Original Samples), 15–35 nt (Replicates), with empty lanes left between all samples to prevent cross contamination.
Read preparation and sequence alignment
All gene boundaries and annotations used in analysis are from the R64-1-1 S288C reference genome assembly (sacCer3) from the Saccharomyces Genome Database Project. A tab delimited file containing gene annotations was obtained from the UCSC Table Browser (https://genome.ucsc.edu/cgi-bin/hgTables).
De-multiplexed sequences were first processed to remove adaptor sequences (CTGTAGGCACCATCAATAGATCGGAA, Universal miRNA Cloning Linker from NEB) using the CutAdapt tool (Martin, 2011). The remaining reads were then processed to remove low-quality reads (PHRED accuracy < 97.5%).
In addition, contaminating non-coding and ribosomal RNAs were filtered. This was accomplished by alignment to the ncRNA gene database FASTA file available at the Saccharomyces Genome Database Project (http://downloads.yeastgenome.org/sequence/S288C_reference/rna/archive/rna_coding_R64-1-1_20110203.fasta.gz). This alignment was performed using Bowtie 1.1.2 (Langmead et al., 2009) using the following parameters: ‘-Sv 3 –p 4 –best’.
The remaining reads were then aligned to the yeast genome using Bowtie 1.1.2 using he following parameters: “-Sm 1 –p 4 –best –strata’. Reads were then mapped to the genome to nucleotide resolution using either 3’-end mapping of all read lengths or 5’-end mapping of 28-nt fragments. Once counts are tabulated at each nucleotide position, the values are normalized to reads per million (rpm) which involves dividing counts at each position by the total number of mapped reads. Python and R scripts used to generate the data and figures in this paper can be found on GitHub at http://github.com/greenlabjhmi/2016-Cell-Dhh1.
sTAI of all annotated genes were calculated as per previously outlined methodologies (Sabi and Tuller, 2014). A modification of the previously outlined TAI (tRNA Adaptation Index) metric (dos Reis et al., 2004), this metric does not require fitting to gene expression. All analysis of mRNA levels and ribosome occupancy looks only at genes that have greater than 128 mapped counts on average across all 18 datasets generated. All genome analysis plots are made using the ggplot2 R package, however binning by sTAI and %GC content was performed in Python. Only bins of greater than 100 counts were considered to ensure that distributions were well sampled and effects of outliers are minimized. Python analysis scripts and R plotting scripts are also available through GitHub at http://github.com/greenlabjhmi/2016-Cell-Dhh1.
Deep sequencing data for CLIP of Dhh1 (Mitchell et al., 2013) was downloaded from the GEO (Series ID GSE46142).
Quantification and Statistical Analysis
Statistical parameters are reported in the Figures and the Figure Legends. Half-lives of reporter mRNAs were obtained by quantifying the northern blots signals from biological triplicates. Concerning all genomic-wide analysis, violin plots list the number of genes in each bin as to better represent the distribution of genes across the various metrics (i.e. sTAI, GC content, etc.). Further in these analysis, replicates (where available) were pooled and change in the median of two distributions (e.g., low sTAI/high sTAI) was calculated using a two-tailed Mann-Whitney test, where statistical significance is denoted by a p-value less than 0.05. Northern blots taken across polysomes were performed in triplicate and fold enrichment of mRNA is shown with calculated standard error.
Data and Software Availability
Data Resources
The three scripts used in analysis and generation of figures for deep sequencing data are found on http://github.com/greenlabjhmi/2016-Cell-Dhh1. “Pipeline.py” is used to process raw FASTQ files and generate WIG files as outlined in the methods previously. “DataGen.py” uses the previously generated WIG files to create the processed data files required to generate the figures in the paper. These figures are then plotted using the R command “Plot.R”.
Raw data files as well as per nucleotide counts (WIG files) for the ribosome profiling and RNA sequencing analyses have been deposited in the NCBI Gene Expression Omnibus under accession number GSE81269.
Raw Dhh1p CLIP data was obtained from the NCBI Gene Expression Omnibus under accession number GSE46142.
Supplementary Material
(A) Graphs for CSC values (black bars) and sTAI values (blue line) averaged across five codon-long windows within the ORF of the HIS3 reporters. The red line represents the average sTAI across the gene for the 0% optimal HIS3 reporter. The total percent optimality is shown above each graph. Note the 5’ end of each reporter is tagged with FLAG of consistent codon composition. Moreover, an identical codon stretch is present in all 11 reporters that comprise the probe site used for Northern analysis. (B) The correlation between the average CSC and average sTAI across the 11 reporters.
(A) Species-specific tRNA adaptation index (sTAI) plotted against percent GC content for all protein encoding transcripts in yeast. (B) Quantifying steady state levels of mRNAs transcripts by RNA-Seq in dhh1Δ cells (RPKM) relative to WT cells (RPKM) where transcripts are binned by fraction GC content. Shown are two biological replicates. A two-tailed Mann-Whitney test shows that low GC content mRNAs (GC Fraction = 0.3, Med. = 1.33) are not enriched relative to high GC content mRNAs (GC Fraction = 0.55, Med. = 1.36) upon Dhh1p depletion, U = 5210, p = 0.847. (C) Quantifying steady state levels of mRNAs transcripts by RNA-Seq in dhh1Δ cells (RPKM) relative to WT cells (RPKM) where transcripts are binned by sTAI where each bin contains an identical number of genes. Shown are two biological replicates. A two-tailed Mann-Whitney test shows that low optimality mRNAs (sTAI = 0.135, Med = 1.41) are enriched relative to high optimality mRNAs (sTAI = 0.467, Med = 0.73) upon Dhh1p depletion, U = 2209, p < 2.2×10⁻¹⁶. (D) Steady state levels of mRNA transcripts by RNA-Seq in WT cells where Dhh1p is constitutively over-expressed (OE) relative to WT cells where transcripts are binned by sTAI. Shown are two biological replicates. A two-tailed Mann-Whitney test shows that low optimality mRNAs (sTAI = 0.25, Med. = 1.09) are not enriched relative to high optimality mRNAs (sTAI = 0.55, Med. = 1.07) upon Dhh1p overexpression, U = 5412, p = 0.4593. (E) Steady state levels of mRNA transcripts by RNA-Seq in WT cells where Dhh1p is constitutively over-expressed (OE) relative to WT cells where transcripts are binned by fraction GC content. Shown are two biological replicates. A two-tailed Mann-Whitney test shows that low GC content (GC Fraction = 0.3, Med. = 0.95) are not enriched relative to high GC content mRNAs (GC Fraction = 0.55, Med. = 1.06) upon Dhh1p overexpression, U = 4102, p = 0.2117.
All experiments in Fig. S3 were performed with the PGK1-HA reporters containing no stretch (NC0) or a stretch of nonoptimal codons (NC) at a given distance from the AUG (5, 25, 50, 63, 77%). (A) Protein output of the different reporters was analyzed by Western blot; relative levels are plotted on the right. Rpl5p was probed as a loading control. (B) Relative levels of the PGK1 reporters in different strains deleted for essential factors involved in the ribosome quality control pathways.
(A) Plotting the ribosome occupancy (average number of ribosomes per mRNA transcript) for mRNA transcripts under constitutive Dhh1p OE relative to constitutive Dhh1p-DQAD OE, binning transcripts by sTAI. Shown are two biological replicates. A two-tailed Mann-Whitney test shows that low optimality mRNAs (sTAI = 0.25, Med. = 1.53) have increased ribosome occupancy relative to high optimality mRNAs (sTAI = 0.55, Med. = 0.71), U = 685, p < 2.2×10⁻¹⁶ upon catalytically active Dhh1p overexpression relative to catalytically inactive Dhh1p overexpression. (B) Ribosome occupancy along a reporter HA-mCherry mRNA upon tethering catalytically active and inactive Dhh1p.
KEY RESOURCES TABLE
| REAGENT or RESOURCE | SOURCE | IDENTIFIER |
|---|---|---|
| Antibodies | ||
| Mouse monoclonal anti-HA | Biolegend | Cat#901503; RRID:AB_2565005 |
| Mouse monoclonal anti-PAB1 | EnCor Biotechnology | Cat#MCA-1G1; RRID:AB_2572370 |
| Mouse monoclonal anti-GAPDH | Cell Biolabs | Cat#AKR-001 |
| Chemicals, Peptides, and Recombinant Proteins | ||
| Cycloheximide | Sigma-Aldrich | C1988; CAS: 66-81-9 |
| Heparin | Sigma-Aldrich | H3393; CAS: 9041-08-1 |
| SuperaseIn | Ambion | AM2694 |
| RNase I | Ambion | AM2294 |
| T4 Polynucleotide Kinase | New England Biosciences | M0201L |
| T4 RNA Ligase 2, Truncated | New England Biosciences | M0242L |
| Superscript III | Invitrogen | 56575 |
| GlycoBlue | ThermoFisher | AM9515 |
| Streptavidin Dynabeads | Invitrogen | 65002 |
| Protease Inhibitor Cocktail | Sigma-Aldrich | P8215 |
| Sepharose 6B beads | Sigma-Aldrich | 6B100 |
| IgG Sepharose 6 Fast Flow | GE Healthcare | 17-0969-01 |
| AcTEV-protease | Invitrogen | 12575-015 |
| Calmodulin Sepharose | GE Healthcare | 17-0529-01 |
| Critical Commercial Assays | ||
| Ribo-Zero Gold rRNA Removal Kit (Yeast) | Illumina | MRZY1306 |
| CircLigase ssDNA Ligase | Epicentre | CL4115K |
| Deposited Data | ||
| Raw and analyzed data | This paper | GEO: GSE81269 |
| Dhh1p CLIP Sequencing | Mitchell et al, 2013 | GEO: GSE46142 |
| R64-1-1 S288C sacCer3 Genome Assembly | Saccharomyces Genome Database Project | http://downloads.yeastgenome.org/sequence/S288C_reference/genome_releases/ |
| Yeast ncRNA Gene Database | Saccharomyces Genome Database Project | http://downloads.yeastgenome.org/sequence/S288C_reference/rna/archive/rna_coding_R64-1-1_20110203.fasta.gz |
| Experimental Models: Cell Lines | ||
| Experimental Models: Organisms/Strains | ||
| See Table S2 for a list of strains used in this study | This paper | N/A |
| Recombinant DNA | ||
| See Table S4 for a list of plasmids used in this study | This paper | N/A |
| Sequence-Based Reagents | ||
| See Table S3 for a list of oligonucleotides used in this study | This paper | N/A |
| Software and Algorithms | ||
| Bowtie | Langmead et al., 2009 | http://bowtie-bio.sourceforge.net |
| ImageQuant | GE Healthcare | TL 5.2 |
| ImageJ | NIH, USA | http://imagej.nih.gov/ij |
| CutAdapt | Martin, 2011 | https://cutadapt.readthedocs.io/en/stable/ |
| Other | ||
| Analysis and scripts of deep sequencing data (Pipeline.py, DataGen.py, Plot.R) | This paper | https://github.com/greenlabjhmi/2016-Cell-Dhh1 |
Acknowledgments
We thank Wenqian Hu, Vlad Presnyak, Carrie Kovalak, Lisa Lojek, Jenna Smith, Kristian Baker, Boris Zinshteyn, Nick Guydosh, and Kristin Smith-Koutmos for productive discussions and technical assistance during this study. Funding was provided by the National Institutes of Health (J.C. and R.G.) and the Howard Hughes Medical Institute (R.G.).
Footnotes
Publisher's Disclaimer: This is a PDF file of an unedited manuscript that has been accepted for publication. As a service to our customers we are providing this early version of the manuscript. The manuscript will undergo copyediting, typesetting, and review of the resulting proof before it is published in its final citable form. Please note that during the production process errors may be discovered which could affect the content, and all legal disclaimers that apply to the journal pertain.
Author Contributions.
A.R., R.G., and J.C. wrote the manuscript. A.R., Y-H.C., N.A., and S.M. performed the experiments. All of the authors contributed to discussion and the design of the research. All authors commented on the manuscript.
References
- Anderson JS, Parker RP. The 3' to 5' degradation of yeast mRNAs is a general mechanism for mRNA turnover that requires the SKI2 DEVH box protein and 3' to 5' exonucleases of the exosome complex. EMBO J. 1998;17:1497–1506. doi: 10.1093/emboj/17.5.1497. [DOI] [PMC free article] [PubMed] [Google Scholar]
- Barbee SA, Estes PS, Cziko AM, Hillebrand J, Luedeman RA, Coller JM, Johnson N, Howlett IC, Geng C, Ueda R, et al. Staufen- and FMRP-containing neuronal RNPs are structurally and functionally related to somatic P bodies. Neuron. 2006;52:997–1009. doi: 10.1016/j.neuron.2006.10.028. [DOI] [PMC free article] [PubMed] [Google Scholar]
- Boel G, Letso R, Neely H, Price WN, Wong KH, Su M, Luff JD, Valecha M, Everett JK, Acton TB, et al. Codon influence on protein expression in E. coli correlates with mRNA levels. Nature. 2016;529:358–363. doi: 10.1038/nature16509. [DOI] [PMC free article] [PubMed] [Google Scholar]
- Braat AK, Yan N, Arn E, Harrison D, Macdonald PM. Localization-dependent oskar protein accumulation; control after the initiation of translation. Dev Cell. 2004;7:125–131. doi: 10.1016/j.devcel.2004.06.009. [DOI] [PubMed] [Google Scholar]
- Bulmer M, Wolfe KH, Sharp PM. Synonymous nucleotide substitution rates in mammalian genes: implications for the molecular clock and the relationship of mammalian orders. Proc Natl Acad Sci U S A. 1991;88:5974–5978. doi: 10.1073/pnas.88.14.5974. [DOI] [PMC free article] [PubMed] [Google Scholar]
- Carroll JS, Munchel SE, Weis K. The DExD/H box ATPase Dhh1 functions in translational repression, mRNA decay, and processing body dynamics. J Cell Biol. 2011;194:527–537. doi: 10.1083/jcb.201007151. [DOI] [PMC free article] [PubMed] [Google Scholar]
- Charneski CA, Hurst LD. Positively charged residues are the major determinants of ribosomal velocity. PLoS Biol. 2013;11:e1001508. doi: 10.1371/journal.pbio.1001508. [DOI] [PMC free article] [PubMed] [Google Scholar]
- Chen Y, Boland A, Kuzuoglu-Ozturk D, Bawankar P, Loh B, Chang CT, Weichenrieder O, Izaurralde E. A DDX6-CNOT1 complex and W-binding pockets in CNOT9 reveal direct links between miRNA target recognition and silencing. Mol Cell. 2014;54:737–750. doi: 10.1016/j.molcel.2014.03.034. [DOI] [PubMed] [Google Scholar]
- Clark IE, Wyckoff D, Gavis ER. Synthesis of the posterior determinant Nanos is spatially restricted by a novel cotranslational regulatory mechanism. Curr Biol. 2000;10:1311–1314. doi: 10.1016/s0960-9822(00)00754-5. [DOI] [PubMed] [Google Scholar]
- Coller J, Parker R. General translational repression by activators of mRNA decapping. Cell. 2005;122:875–886. doi: 10.1016/j.cell.2005.07.012. [DOI] [PMC free article] [PubMed] [Google Scholar]
- Coller JM, Tucker M, Sheth U, Valencia-Sanchez MA, Parker R. The DEAD box helicase, Dhh1p, functions in mRNA decapping and interacts with both the decapping and deadenylase complexes. RNA. 2001;7:1717–1727. doi: 10.1017/s135583820101994x. [DOI] [PMC free article] [PubMed] [Google Scholar]
- Dana A, Tuller T. The effect of tRNA levels on decoding times of mRNA codons. Nucleic Acids Res. 2014;42:9171–9181. doi: 10.1093/nar/gku646. [DOI] [PMC free article] [PubMed] [Google Scholar]
- Darnell JC, Van Driesche SJ, Zhang C, Hung KY, Mele A, Fraser CE, Stone EF, Chen C, Fak JJ, Chi SW, et al. FMRP stalls ribosomal translocation on mRNAs linked to synaptic function and autism. Cell. 2011;146:247–261. doi: 10.1016/j.cell.2011.06.013. [DOI] [PMC free article] [PubMed] [Google Scholar]
- Decker CJ, Parker R. A turnover pathway for both stable and unstable mRNAs in yeast: evidence for a requirement for deadenylation. Genes Dev. 1993;7:1632–1643. doi: 10.1101/gad.7.8.1632. [DOI] [PubMed] [Google Scholar]
- Dix DB, Thompson RC. Codon choice and gene expression: synonymous codons differ in translational accuracy. Proc Natl Acad Sci U S A. 1989;86:6888–6892. doi: 10.1073/pnas.86.18.6888. [DOI] [PMC free article] [PubMed] [Google Scholar]
- Dong H, Nilsson L, Kurland CG. Co-variation of tRNA abundance and codon usage in Escherichia coli at different growth rates. J Mol Biol. 1996;260:649–663. doi: 10.1006/jmbi.1996.0428. [DOI] [PubMed] [Google Scholar]
- dos Reis M, Savva R, Wernisch L. Solving the riddle of codon usage preferences: a test for translational selection. Nucleic Acids Res. 2004;32:5036–5044. doi: 10.1093/nar/gkh834. [DOI] [PMC free article] [PubMed] [Google Scholar]
- Drummond DA, Wilke CO. Mistranslation-induced protein misfolding as a dominant constraint on coding-sequence evolution. Cell. 2008;134:341–352. doi: 10.1016/j.cell.2008.05.042. [DOI] [PMC free article] [PubMed] [Google Scholar]
- Fabian MR, Sonenberg N. The mechanics of miRNA-mediated gene silencing: a look under the hood of miRISC. Nat Struct Mol Biol. 2012;19:586–593. doi: 10.1038/nsmb.2296. [DOI] [PubMed] [Google Scholar]
- Fischer N, Weis K. The DEAD box protein Dhh1 stimulates the decapping enzyme Dcp1. EMBO J. 2002;21:2788–2797. doi: 10.1093/emboj/21.11.2788. [DOI] [PMC free article] [PubMed] [Google Scholar]
- Franklin NC. Conservation of genome form but not sequence in the transcription antitermination determinants of bacteriophages lambda, phi 21 and P22. J Mol Biol. 1985a;181:75–84. doi: 10.1016/0022-2836(85)90325-0. [DOI] [PubMed] [Google Scholar]
- Franklin NC. "N" transcription antitermination proteins of bacteriophages lambda, phi 21 and P22. J Mol Biol. 1985b;181:85–91. doi: 10.1016/0022-2836(85)90326-2. [DOI] [PubMed] [Google Scholar]
- Gardin J, Yeasmin R, Yurovsky A, Cai Y, Skiena S, Futcher B. Measurement of average decoding rates of the 61 sense codons in vivo. Elife. 2014;3 doi: 10.7554/eLife.03735. [DOI] [PMC free article] [PubMed] [Google Scholar]
- Geissler R, Golbik RP, Behrens SE. The DEAD-box helicase DDX3 supports the assembly of functional 80S ribosomes. Nucleic Acids Res. 2012;40:4998–5011. doi: 10.1093/nar/gks070. [DOI] [PMC free article] [PubMed] [Google Scholar]
- Ghaemmaghami S, Huh WK, Bower K, Howson RW, Belle A, Dephoure N, O'Shea EK, Weissman JS. Global analysis of protein expression in yeast. Nature. 2003;425:737–741. doi: 10.1038/nature02046. [DOI] [PubMed] [Google Scholar]
- Gingold H, Pilpel Y. Determinants of translation efficiency and accuracy. Mol Syst Biol. 2011;7:481. doi: 10.1038/msb.2011.14. [DOI] [PMC free article] [PubMed] [Google Scholar]
- Gingras AC, Raught B, Sonenberg N. eIF4 initiation factors: effectors of mRNA recruitment to ribosomes and regulators of translation. Annu Rev Biochem. 1999;68:913–963. doi: 10.1146/annurev.biochem.68.1.913. [DOI] [PubMed] [Google Scholar]
- Guydosh NR, Green R. Dom34 rescues ribosomes in 3' untranslated regions. Cell. 2014;156:950–962. doi: 10.1016/j.cell.2014.02.006. [DOI] [PMC free article] [PubMed] [Google Scholar]
- Hershberg R, Petrov DA. Selection on codon bias. Annu Rev Genet. 2008;42:287–299. doi: 10.1146/annurev.genet.42.110807.091442. [DOI] [PubMed] [Google Scholar]
- Hsu CL, Stevens A. Yeast cells lacking 5'-->3' exoribonuclease 1 contain mRNA species that are poly(A) deficient and partially lack the 5' cap structure. Mol Cell Biol. 1993;13:4826–4835. doi: 10.1128/mcb.13.8.4826. [DOI] [PMC free article] [PubMed] [Google Scholar]
- Hu W, Sweet TJ, Chamnongpol S, Baker KE, Coller J. Co-translational mRNA decay in Saccharomyces cerevisiae. Nature. 2009;461:225–229. doi: 10.1038/nature08265. [DOI] [PMC free article] [PubMed] [Google Scholar]
- Hussmann JA, Patchett S, Johnson A, Sawyer S, Press WH. Understanding Biases in Ribosome Profiling Experiments Reveals Signatures of Translation Dynamics in Yeast. PLoS Genet. 2015;11:e1005732. doi: 10.1371/journal.pgen.1005732. [DOI] [PMC free article] [PubMed] [Google Scholar]
- Ikemura T, Ozeki H. Codon usage and transfer RNA contents: organism-specific codon-choice patterns in reference to the isoacceptor contents. Cold Spring Harb Symp Quant Biol. 1983;47(Pt 2):1087–1097. doi: 10.1101/sqb.1983.047.01.123. [DOI] [PubMed] [Google Scholar]
- Ingolia NT, Ghaemmaghami S, Newman JR, Weissman JS. Genome-wide analysis in vivo of translation with nucleotide resolution using ribosome profiling. Science. 2009;324:218–223. doi: 10.1126/science.1168978. [DOI] [PMC free article] [PubMed] [Google Scholar]
- Ingolia NT, Lareau LF, Weissman JS. Ribosome profiling of mouse embryonic stem cells reveals the complexity and dynamics of mammalian proteomes. Cell. 2011;147:789–802. doi: 10.1016/j.cell.2011.10.002. [DOI] [PMC free article] [PubMed] [Google Scholar]
- Kim SJ, Yoon JS, Shishido H, Yang Z, Rooney LA, Barral JM, Skach WR. Protein folding. Translational tuning optimizes nascent protein folding in cells. Science. 2015;348:444–448. doi: 10.1126/science.aaa3974. [DOI] [PubMed] [Google Scholar]
- Langmead B, Trapnell C, Pop M, Salzberg SL. Ultrafast and memory-efficient alignment of short DNA sequences to the human genome. Genome Biol. 2009;10:R25. doi: 10.1186/gb-2009-10-3-r25. [DOI] [PMC free article] [PubMed] [Google Scholar]
- Lazinski D, Grzadzielska E, Das A. Sequence-specific recognition of RNA hairpins by bacteriophage antiterminators requires a conserved arginine-rich motif. Cell. 1989;59:207–218. doi: 10.1016/0092-8674(89)90882-9. [DOI] [PubMed] [Google Scholar]
- Li GW, Oh E, Weissman JS. The anti-Shine-Dalgarno sequence drives translational pausing and codon choice in bacteria. Nature. 2012;484:538–541. doi: 10.1038/nature10965. [DOI] [PMC free article] [PubMed] [Google Scholar]
- Longtine MS, McKenzie A, 3rd, Demarini DJ, Shah NG, Wach A, Brachat A, Philippsen P, Pringle JR. Additional modules for versatile and economical PCR-based gene deletion and modification in Saccharomyces cerevisiae. Yeast. 1998;14:953–961. doi: 10.1002/(SICI)1097-0061(199807)14:10<953::AID-YEA293>3.0.CO;2-U. [DOI] [PubMed] [Google Scholar]
- Man O, Pilpel Y. Differential translation efficiency of orthologous genes is involved in phenotypic divergence of yeast species. Nat Genet. 2007;39:415–421. doi: 10.1038/ng1967. [DOI] [PubMed] [Google Scholar]
- Martin M. Cutadapt removes adapter sequences from high-throughput sequencing reads. EMBnetjournal. 2011;17 [Google Scholar]
- Mathys H, Basquin J, Ozgur S, Czarnocki-Cieciura M, Bonneau F, Aartse A, Dziembowski A, Nowotny M, Conti E, Filipowicz W. Structural and biochemical insights to the role of the CCR4-NOT complex and DDX6 ATPase in microRNA repression. Mol Cell. 2014;54:751–765. doi: 10.1016/j.molcel.2014.03.036. [DOI] [PubMed] [Google Scholar]
- Mishima Y, Tomari Y. Codon Usage and 3' UTR Length Determine Maternal mRNA Stability in Zebrafish. Mol Cell. 2016;61:874–885. doi: 10.1016/j.molcel.2016.02.027. [DOI] [PubMed] [Google Scholar]
- Mitchell SF, Jain S, She M, Parker R. Global analysis of yeast mRNPs. Nat Struct Mol Biol. 2013;20:127–133. doi: 10.1038/nsmb.2468. [DOI] [PMC free article] [PubMed] [Google Scholar]
- Muhlrad D, Decker CJ, Parker R. Deadenylation of the unstable mRNA encoded by the yeast MFA2 gene leads to decapping followed by 5'-->3' digestion of the transcript. Genes Dev. 1994;8:855–866. doi: 10.1101/gad.8.7.855. [DOI] [PubMed] [Google Scholar]
- Nakamura A, Amikura R, Hanyu K, Kobayashi S. Me31B silences translation of oocyte-localizing RNAs through the formation of cytoplasmic RNP complex during Drosophila oogenesis. Development. 2001;128:3233–3242. doi: 10.1242/dev.128.17.3233. [DOI] [PubMed] [Google Scholar]
- Novoa EM, Ribas de Pouplana L. Speeding with control: codon usage, tRNAs, and ribosomes. Trends Genet. 2012;28:574–581. doi: 10.1016/j.tig.2012.07.006. [DOI] [PubMed] [Google Scholar]
- Ozgur S, Basquin J, Kamenska A, Filipowicz W, Standart N, Conti E. Structure of a Human 4E-T/DDX6/CNOT1 Complex Reveals the Different Interplay of DDX6-Binding Proteins with the CCR4-NOT Complex. Cell Rep. 2015;13:703–711. doi: 10.1016/j.celrep.2015.09.033. [DOI] [PubMed] [Google Scholar]
- Pechmann S, Frydman J. Evolutionary conservation of codon optimality reveals hidden signatures of cotranslational folding. Nat Struct Mol Biol. 2013;20:237–243. doi: 10.1038/nsmb.2466. [DOI] [PMC free article] [PubMed] [Google Scholar]
- Pelechano V, Wei W, Steinmetz LM. Widespread Co-translational RNA Decay Reveals Ribosome Dynamics. Cell. 2015;161:1400–1412. doi: 10.1016/j.cell.2015.05.008. [DOI] [PMC free article] [PubMed] [Google Scholar]
- Pop C, Rouskin S, Ingolia NT, Han L, Phizicky EM, Weissman JS, Koller D. Causal signals between codon bias, mRNA structure, and the efficiency of translation and elongation. Mol Syst Biol. 2014;10:770. doi: 10.15252/msb.20145524. [DOI] [PMC free article] [PubMed] [Google Scholar]
- Presnyak V, Alhusaini N, Chen YH, Martin S, Morris N, Kline N, Olson S, Weinberg D, Baker KE, Graveley BR, et al. Codon optimality is a major determinant of mRNA stability. Cell. 2015;160:1111–1124. doi: 10.1016/j.cell.2015.02.029. [DOI] [PMC free article] [PubMed] [Google Scholar]
- Presnyak V, Coller J. The DHH1/RCKp54 family of helicases: an ancient family of proteins that promote translational silencing. Biochim Biophys Acta. 2013;1829:817–823. doi: 10.1016/j.bbagrm.2013.03.006. [DOI] [PMC free article] [PubMed] [Google Scholar]
- Rigaut G, Shevchenko A, Rutz B, Wilm M, Mann M, Seraphin B. A generic protein purification method for protein complex characterization and proteome exploration. Nat Biotechnol. 1999;17:1030–1032. doi: 10.1038/13732. [DOI] [PubMed] [Google Scholar]
- Rocha EP. Codon usage bias from tRNA's point of view: redundancy, specialization, and efficient decoding for translation optimization. Genome Res. 2004;14:2279–2286. doi: 10.1101/gr.2896904. [DOI] [PMC free article] [PubMed] [Google Scholar]
- Rouya C, Siddiqui N, Morita M, Duchaine TF, Fabian MR, Sonenberg N. Human DDX6 effects miRNA-mediated gene silencing via direct binding to CNOT1. RNA. 2014;20:1398–1409. doi: 10.1261/rna.045302.114. [DOI] [PMC free article] [PubMed] [Google Scholar]
- Sabi R, Tuller T. Modelling the efficiency of codon-tRNA interactions based on codon usage bias. DNA Res. 2014;21:511–526. doi: 10.1093/dnares/dsu017. [DOI] [PMC free article] [PubMed] [Google Scholar]
- Sander IM, Chaney JL, Clark PL. Expanding Anfinsen's principle: contributions of synonymous codon selection to rational protein design. J Am Chem Soc. 2014;136:858–861. doi: 10.1021/ja411302m. [DOI] [PMC free article] [PubMed] [Google Scholar]
- Shoemaker CJ, Green R. Translation drives mRNA quality control. Nat Struct Mol Biol. 2012;19:594–601. doi: 10.1038/nsmb.2301. [DOI] [PMC free article] [PubMed] [Google Scholar]
- Sorensen MA, Kurland CG, Pedersen S. Codon usage determines translation rate in Escherichia coli. J Mol Biol. 1989;207:365–377. doi: 10.1016/0022-2836(89)90260-x. [DOI] [PubMed] [Google Scholar]
- Spencer PS, Siller E, Anderson JF, Barral JM. Silent substitutions predictably alter translation elongation rates and protein folding efficiencies. J Mol Biol. 2012;422:328–335. doi: 10.1016/j.jmb.2012.06.010. [DOI] [PMC free article] [PubMed] [Google Scholar]
- Sweet T, Kovalak C, Coller J. The DEAD-box protein Dhh1 promotes decapping by slowing ribosome movement. PLoS Biol. 2012;10:e1001342. doi: 10.1371/journal.pbio.1001342. [DOI] [PMC free article] [PubMed] [Google Scholar]
- Thomas LK, Dix DB, Thompson RC. Codon choice and gene expression: synonymous codons differ in their ability to direct aminoacylated-transfer RNA binding to ribosomes in vitro. Proc Natl Acad Sci U S A. 1988;85:4242–4246. doi: 10.1073/pnas.85.12.4242. [DOI] [PMC free article] [PubMed] [Google Scholar]
- Tuller T, Waldman YY, Kupiec M, Ruppin E. Translation efficiency is determined by both codon bias and folding energy. Proc Natl Acad Sci U S A. 2010;107:3645–3650. doi: 10.1073/pnas.0909910107. [DOI] [PMC free article] [PubMed] [Google Scholar]
- Varenne S, Buc J, Lloubes R, Lazdunski C. Translation is a non-uniform process. Effect of tRNA availability on the rate of elongation of nascent polypeptide chains. J Mol Biol. 1984;180:549–576. doi: 10.1016/0022-2836(84)90027-5. [DOI] [PubMed] [Google Scholar]
- Weinberg DE, Shah P, Eichhorn SW, Hussmann JA, Plotkin JB, Bartel DP. Improved Ribosome-Footprint and mRNA Measurements Provide Insights into Dynamics and Regulation of Yeast Translation. Cell Rep. 2016;14:1787–1799. doi: 10.1016/j.celrep.2016.01.043. [DOI] [PMC free article] [PubMed] [Google Scholar]
- Yu CH, Dang Y, Zhou Z, Wu C, Zhao F, Sachs MS, Liu Y. Codon Usage Influences the Local Rate of Translation Elongation to Regulate Co-translational Protein Folding. Mol Cell. 2015;59:744–754. doi: 10.1016/j.molcel.2015.07.018. [DOI] [PMC free article] [PubMed] [Google Scholar]
- Zhang G, Hubalewska M, Ignatova Z. Transient ribosomal attenuation coordinates protein synthesis and co-translational folding. Nat Struct Mol Biol. 2009;16:274–280. doi: 10.1038/nsmb.1554. [DOI] [PubMed] [Google Scholar]
Associated Data
This section collects any data citations, data availability statements, or supplementary materials included in this article.
Supplementary Materials
(A) Graphs for CSC values (black bars) and sTAI values (blue line) averaged across five codon-long windows within the ORF of the HIS3 reporters. The red line represents the average sTAI across the gene for the 0% optimal HIS3 reporter. The total percent optimality is shown above each graph. Note the 5’ end of each reporter is tagged with FLAG of consistent codon composition. Moreover, an identical codon stretch is present in all 11 reporters that comprise the probe site used for Northern analysis. (B) The correlation between the average CSC and average sTAI across the 11 reporters.
(A) Species-specific tRNA adaptation index (sTAI) plotted against percent GC content for all protein encoding transcripts in yeast. (B) Quantifying steady state levels of mRNAs transcripts by RNA-Seq in dhh1Δ cells (RPKM) relative to WT cells (RPKM) where transcripts are binned by fraction GC content. Shown are two biological replicates. A two-tailed Mann-Whitney test shows that low GC content mRNAs (GC Fraction = 0.3, Med. = 1.33) are not enriched relative to high GC content mRNAs (GC Fraction = 0.55, Med. = 1.36) upon Dhh1p depletion, U = 5210, p = 0.847. (C) Quantifying steady state levels of mRNAs transcripts by RNA-Seq in dhh1Δ cells (RPKM) relative to WT cells (RPKM) where transcripts are binned by sTAI where each bin contains an identical number of genes. Shown are two biological replicates. A two-tailed Mann-Whitney test shows that low optimality mRNAs (sTAI = 0.135, Med = 1.41) are enriched relative to high optimality mRNAs (sTAI = 0.467, Med = 0.73) upon Dhh1p depletion, U = 2209, p < 2.2×10⁻¹⁶. (D) Steady state levels of mRNA transcripts by RNA-Seq in WT cells where Dhh1p is constitutively over-expressed (OE) relative to WT cells where transcripts are binned by sTAI. Shown are two biological replicates. A two-tailed Mann-Whitney test shows that low optimality mRNAs (sTAI = 0.25, Med. = 1.09) are not enriched relative to high optimality mRNAs (sTAI = 0.55, Med. = 1.07) upon Dhh1p overexpression, U = 5412, p = 0.4593. (E) Steady state levels of mRNA transcripts by RNA-Seq in WT cells where Dhh1p is constitutively over-expressed (OE) relative to WT cells where transcripts are binned by fraction GC content. Shown are two biological replicates. A two-tailed Mann-Whitney test shows that low GC content (GC Fraction = 0.3, Med. = 0.95) are not enriched relative to high GC content mRNAs (GC Fraction = 0.55, Med. = 1.06) upon Dhh1p overexpression, U = 4102, p = 0.2117.
All experiments in Fig. S3 were performed with the PGK1-HA reporters containing no stretch (NC0) or a stretch of nonoptimal codons (NC) at a given distance from the AUG (5, 25, 50, 63, 77%). (A) Protein output of the different reporters was analyzed by Western blot; relative levels are plotted on the right. Rpl5p was probed as a loading control. (B) Relative levels of the PGK1 reporters in different strains deleted for essential factors involved in the ribosome quality control pathways.
(A) Plotting the ribosome occupancy (average number of ribosomes per mRNA transcript) for mRNA transcripts under constitutive Dhh1p OE relative to constitutive Dhh1p-DQAD OE, binning transcripts by sTAI. Shown are two biological replicates. A two-tailed Mann-Whitney test shows that low optimality mRNAs (sTAI = 0.25, Med. = 1.53) have increased ribosome occupancy relative to high optimality mRNAs (sTAI = 0.55, Med. = 0.71), U = 685, p < 2.2×10⁻¹⁶ upon catalytically active Dhh1p overexpression relative to catalytically inactive Dhh1p overexpression. (B) Ribosome occupancy along a reporter HA-mCherry mRNA upon tethering catalytically active and inactive Dhh1p.