Significance
Do glassy dynamics depend strongly on local structure? In bulk systems, a quantitative answer to this question exists and is affirmative. The dynamical behavior of nanometrically thin glassy films is strikingly different from bulk systems, and it is natural to ask whether this difference stems from local structural differences. Using machine learning techniques, we show that altered dynamics near an interface do not stem from changes of local structure near the interface. Rather, the dynamics depend on the simultaneous occurrence of two independent processes, one that depends on structure but not position within the film, and an Arrhenius process that does not depend on structure but depends sensitively on position.
Keywords: machine learning, glass, thin film
Abstract
Nanometrically thin glassy films depart strikingly from the behavior of their bulk counterparts. We investigate whether the dynamical differences between a bulk and thin film polymeric glass former can be understood by differences in local microscopic structure. Machine learning methods have shown that local structure can serve as the foundation for successful, predictive models of particle rearrangement dynamics in bulk systems. By contrast, in thin glassy films, we find that particles at the center of the film and those near the surface are structurally indistinguishable despite exhibiting very different dynamics. Next, we show that structure-independent processes, already present in bulk systems and demonstrably different from simple facilitated dynamics, are crucial for understanding glassy dynamics in thin films. Our analysis suggests a picture of glassy dynamics in which two dynamical processes coexist, with relative strengths that depend on the distance from an interface. One of these processes depends on local structure and is unchanged throughout most of the film, while the other is purely Arrhenius, does not depend on local structure, and is strongly enhanced near the free surface of a film.
Confinement of glassy materials to nanometric length scales leads to striking changes to their microscopic dynamics and consequently to their material properties (1). Direct observations in both experiments and simulations find exponentially more particle rearrangements near the free surface of a film (2–5), as well as position-dependent aging rates within the film (6, 7). A key question is whether enhanced dynamics near a free surface (or suppressed dynamics near a substrate) are connected with changes in the local structural environment of the rearranging particles.
A direct connection between a particle’s local structural environment and its propensity to rearrange has been established in bulk glasses in the last several years (8–12). In these systems, machine learning methods have proven remarkably successful in identifying optimal linear combinations of local structural features—termed “softness” and denoted for particle —to predict particle rearrangements (13). For Lennard-Jones (LJ) mixtures, softness can be represented as a weighted integral over the local radial distribution function (14). This measure has been shown to be over an order of magnitude more predictive of rearrangements than measures such as the local potential energy or coordination number (Supporting Information and ref. 14) and has yielded new insight into the physics of glassy systems (15, 16). In particular, it was shown that, for a system at temperature , the probability that a particle of softness at time will rearrange at time has the form
| [1] |
where and . The constants , , , and are independent of and ; it follows that is purely Arrhenius and is independent of softness (15). depends on softness but is purely Arrhenius at each value of . As a result, the average softness, , is directly predictive of the relaxation time of supercooled liquids (15) and aging bulk glasses (16). Non-Arrhenius relaxation arises from changes in with temperature. We take this decomposition of the non-Arrhenius behavior of the supercooled system into a collection of locally Arrhenius processes to be a strong indication not only that is a strong predictive quantity but that it is capturing important features of glassy physics. In bulk systems, it is therefore now clear that dynamical slowing down near the glass transition is intimately associated with structural changes.
Here we show that softness provides a useful, quantitative framework to analyze glassy thin films. As for the binary LJ mixture, we show that the probability of rearrangement has the form of Eq. 1 in every layer of the film. However, the enhancement of dynamics near the surface stems solely from ; does not depend on position in the film. We confirm that our results are robust to the specifics of the softness calculation. Indeed, we find that, for a very general set of quantities that characterize the local structural environment surrounding a particle, there is no combination of these quantities that can distinguish between parts of the film with very different dynamics. The enhanced dynamics near a free glassy surface are therefore fundamentally different from the dynamics in the rest of the film: Near free surfaces, relaxation is dominated by mechanisms that are independent of local structure.
Methods
Our model systems are composed of short-chain polymers, specifically Kremer–Grest chains, each with beads of diameter . The nonbonded interaction is an attractive, truncated LJ potential, and the intrachain bonds are stiff harmonic springs. This model has a bulk glass (dynamic cross-over) transition temperature of as determined by constant cooling rate experiments (7); defining the transition as the temperature at which the bulk relaxation time reaches leads to (17). Following the protocols in refs. 7, 17, and 18, which characterized many structural and dynamical properties of thin glassy films as a function of thickness, temperature, and age for this model, we prepared both freestanding films and films on frozen amorphous substrates with thickness of order in a box of fixed volume, V. For the supported films, the substrate was taken to be a slice of an independently equilibrated sample of the same polymer model at ; these chains were frozen in place, and the polymer–substrate interactions were taken to be identical to the polymer–polymer interactions. Here, is normal to the film surface. The systems were simulated using the HOOMD-blue package (19, 20) in the NVT ensemble with a time step of , where is the LJ unit of time. All configurations were prepared at an initial reduced temperature of and cooled at a constant rate of to the desired temperature; the aging time refers to simulation time subsequent to the end of this cooling procedure. While this cooling rate is very fast relative to experimental quenches, and the time scales accessible in simulations are short when expressed in physical units, we are nevertheless able to observe key features such as glassy dynamics and altered interfacial mobility in our thin film simulations. Additional details can be found in Supporting Information.
Although we have chosen a particular polymer model for this study, we expect that our findings generically apply to fragile glass formers. At the time scales of segmental relaxation that govern glassy dynamics, polymeric and small-molecule glasses are fundamentally similar (1). The softness results we obtain in the center of the film are qualitatively in excellent accord with earlier results for bulk Kob–Andersen (KA) systems (14–16), so chain connectivity is not responsible for differences in the behavior of thin films and bulk systems that we observe [although important polymeric effects are known to exist in glassy films, particularly for high-molecular-weight samples (21)]. We find that, in thin-film KA systems, the two sphere sizes tend to segregate near the interface, and it is difficult to determine whether the changing dynamics near the interface is a direct result of these structural changes or not. By studying a model system where this is not an issue, we are able to determine that altered microscopic structure is not necessary for altered interfacial dynamics.
The machine learning approach we use, support vector machine (SVM) with a linear kernel, is physically transparent, corresponding to a straightforward classification problem. We begin by following the methodology of ref. 15, and first study . The goal is to find a combination of local structural features that distinguishes particles that are likely to rearrange in the future from those that are unlikely to rearrange. We begin by recording many particle trajectories, either from within of the center of mass of an aged thin freestanding film at or from a bulk system at the same temperature. We identify particle rearrangements using a “hop” indicator function, (22). To define for a particle at time , we first specify two time intervals and ; the hop indicator function can then be expressed as
| [2] |
where and denote averages over and intervals. From the trajectories of the particles, we identify a “training set” of 2,000 particles that are about to rearrange, such that in the subsequent frame, and 2,000 particles that have not rearranged for a long time, where for many hundred . We have verified that selecting the training set particles either from bulk simulations of the model or from the center of simulated films does not influence the results that follow. We note, however, that the definition of could obscure the contribution of smoother particle motions to structural relaxation.
Given this training set, we then measure many different quantifications of the local structure for each of the particles in our training set, and embed each particle in a high-dimensional space (where each dimension corresponds to one of the measures of local structure). We characterize the local environment of each particle in the training set using a number, , of “structure functions,” , where indexes the structure function type. In ref. 15, we showed that we could limit our structure functions to local, coarse-grained versions of the pair correlation function,
| [3] |
where is the distance between particles and , is the set of particles near particle with , and . The machine learning algorithm then simply tries to classify the “soft” (likely to rearrange) and “hard” (unlikely to rearrange) particles in the training set by finding the linear combination of structure functions that best separates the two populations of particles.
To find the optimal linear combination of structure functions, we embed the particles in our training set in the space of structure functions, , and find the hyperplane in that best separates the two classes (a nonlinear kernel would find the best hypersurface). Softness is the signed distance to the plane: , where is the hyperplane normal and is the bias; the physical meaning is captured in , and we use to simply set the average value of softness at some reference temperature. We have shown that, in the supercooled regime, 90% of the rearranging particles in bulk LJ mixtures have (15).
One difference in protocol compared with ref. 15 is that here we use snapshots of thermalized configurations of the particles, rather than looking at energy-minimized “inherent structures.” We thus avoid spurious rearrangements due to thermal contraction from the finite temperature glass to the zero-temperature state of the film, at the cost of some loss of predictive accuracy due to fluctuations of particles within their cages, which contribute to fluctuations in . Nevertheless, we find that our predictive accuracy remains high, with more than of rearranging particles identified as soft (i.e., with ) (14, 15) for bulk systems as well as for particles in the center of the film. We have verified that our qualitative conclusions are insensitive to choices made, such as using the choice of additional structure functions (bond-angle-dependent functions (13) or spherical harmonics coarse-grained in the radial direction).
We previously found that, in bulk systems, increasing the range over which these structure functions extend does not significantly increase the correlations that we find between structure and dynamics, suggesting that, at least in the bulk, the nonlocal contributions to particle relaxation are small (or that these structure functions are poor at distinguishing interesting structural features at farther distances). We note that it is straightforward to apply our approach directly to, e.g., granular and colloidal experimental systems (13), and it is, in fact, more straightforward to compute the than to calculate, e.g., the local free volume of a particle.
Results
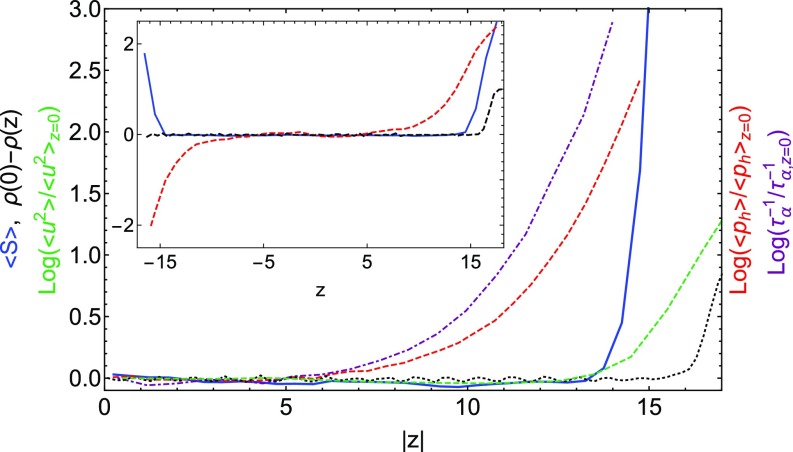
We compare the dynamical properties of thin films with spatially resolved values of particle softness. Fig. 1 shows several quantities as a function of position in the film, where at the center of the film. We plot the density relative to its value at the center of the film, (black dotted line); the upturn at corresponds to the downturn in the density at the edge of the film. The softness, defined so that the average softness vanishes at the center of the film (blue solid line), remains flat until it comes within 2.5 of the edge of the film. Recall that the cutoff distance for structure functions that enter into softness is 2.5; the upturn in softness therefore reflects the drop-off in density at the edge of the film.
Fig. 1.
From left to right, the curves show (purple dot-dashed curve), (red dashed curve), (solid blue curve), where DW is the local Debye–Waller (DW) factor (green dashed curve), and density profile (black dotted curve). All data are for a freestanding thin film at and (). (Inset) Spatial profile of mean softness (blue solid curve), log of normalized (red dashed curve), and density profile (black dashed curve) for a supported film at and ().
We have also plotted two measures of the long-time dynamics in the film, the logarithms of the averaged hop indicator (red dashed line in Fig. 1) and the relaxation time (purple dot-dashed line). We extract from the decay of the overlap function (23) within each layer. These show a notable enhancement even quite far from the edge of the film, down to about .
We call particular attention to the regime between and in Fig. 1. In this regime, we find that the mean softness is flat even while the dynamics speed up by an order of magnitude; in a bulk system, these large differences in dynamics would correspond to a shift in average softness to , well outside any noise in our measurement of the mean softness. These results show clearly that the enhanced surface dynamics are not associated with a change of softness.
Some studies have found that the local DW factor—the mean-squared displacement of particles at a time comparable to —provides a good correlator of longer-time mobility in both bulk samples and thin films (24, 25). We find that this does not hold in our model; consistent with the finding of ref. 3, the length scale associated with an average enhancement of the local DW factor (green short-dashed line in Fig. 1) remains short (of order 2 to 3) even as the enhanced mobility (red short-dashed and purple dot-dashed lines) extends deep into the film. Additionally, we have directly quantified the accuracy of using the local DW factor to predict rearrangements according to the measure described in Methods; using an optimal cutoff on the value of the DW factor, we find that only of rearranging particles are correctly identified in the bulk system. This is less than the predictive accuracy of softness of 80%, which is particularly surprising in light of the fact that the DW factor is computed using a subset of the dynamical information used to define rearrangements via . We take this as strong evidence of the robustness of our measurements of local structure and their connection to glassy rearrangement dynamics.
Fig. 1, Inset, reports results for a film at that is supported by an amorphous substrate. Here the dynamics are exponentially suppressed near the solid interface and enhanced at the free surface. However, the value of shows no indication of a difference in the local structural environment of the particles; again it remains flat, except within of the surfaces. To treat both sides symmetrically, we do not include substrate particles in calculating the structure functions; the upturn in softness is therefore associated with the loss of particle density on both sides. We note that amorphous walls have been used to detect point-to-set-like length scales (5, 26), but these structural length scales are short enough ( in KA mixtures) to fall inside the range of the structure functions, and are buried in our analysis by the effects of density loss for particles near the substrate.
Fig. 1 thus tells us that the enhanced/suppressed dynamics near a free/solid surface decay from the surface with a length scale that is not reflected in the softness: The softness is flat throughout the film except very close to the edge, where it rises due to the decrease in the density of the film there.
One possible explanation for this discrepancy between dynamics and structure in the film is facilitation. Enhanced dynamics at the very edge of the film could lead to enhanced dynamics deeper into the film as rearrangements facilitate other rearrangements. To test this idea, we turn to the “softness propagator” introduced in our earlier study of bulk binary LJ systems (15). Consider a set of particles that all have softness at and calculate , the distribution of of these particles at a time . This propagator describes the process by which the softness of a particle evolves due to rearrangements of nearby particles; for example, particles with softness less than zero evolve toward higher softness with time as nearby rearrangements alter local structure. Eventually, the distribution must approach the equilibrium distribution of at sufficiently long times . The propagator therefore captures the physics of facilitation. Here we compute averages over this propagator,
| [4] |
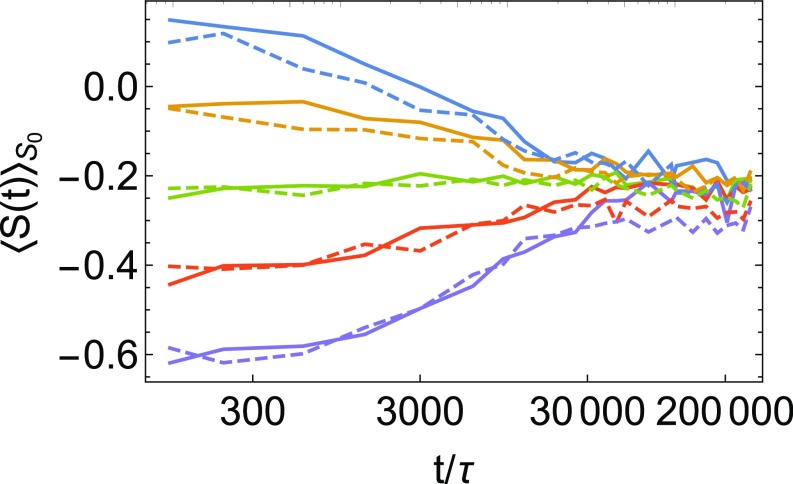
In bulk KA systems, the average softness of particles with initial softness evolves toward the mean of the softness distribution on approximately the scale of the -relaxation time (16) for all . Here we compute this quantity in a layer-resolved way, with the results shown in Fig. 2. To collect sufficient statistics, we average over particles, and we define “center” and “edge” by taking slices of the film of width . While there are modest systematic differences in how quickly softness relaxes toward the mean of the distribution, these are very small compared with the almost order of magnitude difference in the mean relaxation time of particles in these two slices of the film. From the facilitation picture, one would expect in a given layer to decay on the time scale of the relaxation time in that layer. Fig. 2 shows that this is not the case: decays on the scale of the relaxation time of the bulk system for particles anywhere in the film, even those near the surface. We therefore see no evidence of facilitation: Although particles near the surface are rearranging at a considerably higher rate than in the bulk, particularly for soft particles, those rearrangements are not facilitating changes of softness nearby at an enhanced rate. The enhanced rearrangements near the surface are apparently ineffective in changing softness (or, equivalently, the structure).
Fig. 2.
Time evolution of softness for particles, in bins of softness, for different layers of a , film. Solid lines correspond to averages over particles with , and dashed lines correspond to particles in the range . At , all particles whose softness values are of are included in the average.
Facilitation might alternately arise if there were stronger spatial correlations in softness near the surface, so that soft particles were more likely to lie near other soft particles. As a first effort to detect these subtler effects, we introduce a different class of structure functions. Since, in the bulk, softness itself is a good predictor of mobility, we first compute the softness of every particle as described above. We then compute the local softness densities at different distances from each particle,
| [5] |
These structure functions capture radial features of the softness field itself. Inclusion of these structure functions slightly increases our predictive accuracy (Fig. S3), but nevertheless fails to distinguish positions within the film. Again, this result suggests that a straightforward facilitation picture does not explain enhanced dynamics near a free surface. While we have shown that the above structure functions are not useful for understanding thin film dynamics, we speculate that adding these functions to the usual set in the bulk might allow generalized versions of softness to predict the intermediate time and length scale phenomena associated with dynamical heterogeneities, which appear to be well described by simple facilitated models (22, 27).
Fig. S3.
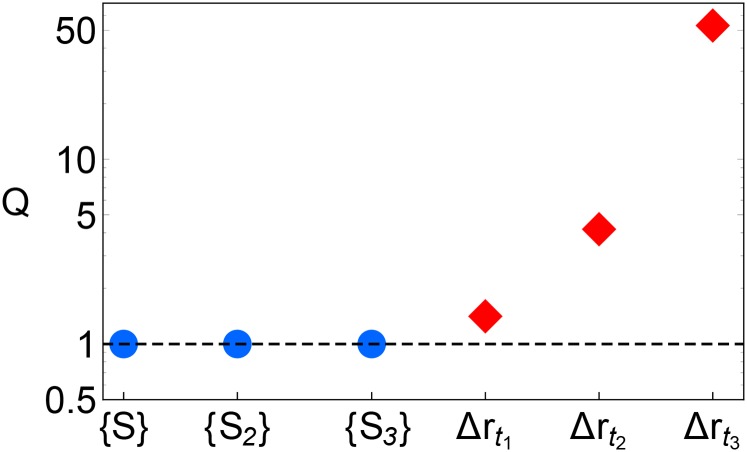
-function scores obtained trying to distinguish 2,500 particles near the center versus the edge of the thin film, as a function of the set of structure functions used. The three circles correspond to using only local structural information: are the standard softness, , and .The three diamonds correspond to adding dynamical information (logarithmically spaced data on the magnitude of particle displacement, , out to a maximum time of .
Taken together, our results imply that the rapidly changing dynamics near interfaces cannot be attributed to local structural changes. We therefore ask the simpler question of whether the local structural environment of a particle depends in any way on the particle’s position in the film. To answer this, we directly perform supervised learning on the position of a particle using SVM with linear and Gaussian kernels as well as feed-forward neural networks with up to six fully connected layers (see Supporting Information for details), focusing on the freestanding films described above ( and ). Instead of training on whether particles are rearranging or not, we construct a training set consisting of “central” particles (with ) and edge particles (with , i.e., close to the edge but still more than from the density fluctuations near the film boundary). The relaxation time in the central layer is , while that in the edge layer is . Can we distinguish between these two sets of particles using local structure alone?
To capture many different aspects of the local structural environment, we expand our set of structure functions beyond the purely radial ones used above. We include isotropic spherical harmonic bond orientational order functions, (15, 28). We also use a collection of spherical harmonics, , using as the axis of symmetry. This is potentially quite important, as the structure functions should reflect the symmetry of the underlying system itself. We compute the and for even (up to ) in shells of thickness ; explicit definitions are given in Supporting Information. Training on 2,500 particles from each class, we find cross-validation accuracies of ; that is, we are completely unable to distinguish particles in different layers of the film using this very general set of radial and angular structure functions. Thus, not only softness but any measure of local structure is independent of position everywhere in the film except within the cutoff distance of its edge.
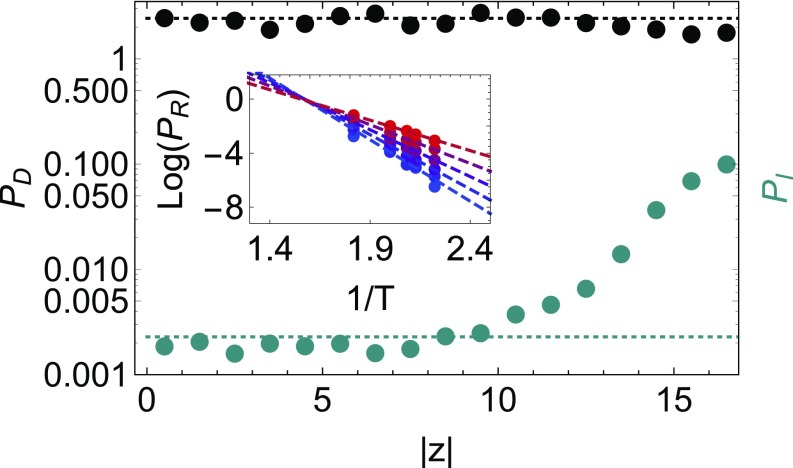
We now show that, although softness itself does not explain enhanced dynamics near a free surface, formulating the problem in terms of softness yields valuable insight. We have first verified that Eq. 1 holds for thermalized particle configurations in our polymer system in the bulk, suggesting that the physics is quite general. This is shown in Fig. 3, Inset, where there is a clear exponential dependence of relaxation time on inverse temperature for different values of .
Fig. 3.
Values of (upper, black points) and (lower, teal points) as a function of position within a freestanding thin film at and , derived from the curves in Supporting Information. Dashed lines correspond to the bulk values of these quantities obtained by fitting vs for for bulk samples prepared at different and zero pressure (shown in Inset, with the blue-to-red (bottom-to-top) scale going from to ). Although there are small deviations of the softness-dependent terms very close to the edge of the film, these are small compared with the large enhancement of the softness-independent terms. This enhancement persists on a length scale matching the enhancement of dynamics seen in Fig. 1.
As shown in Supporting Information, we find that the probability of rearrangement for different softness also displays an Arrhenius temperature dependence in every layer of the film. Fig. 3 uses a layer-by-layer analysis to plot the softness-dependent and softness-independent contributions to the rearrangement probability as a function of position within the film. We find that is completely insensitive to film position (consistent with the inability of softness to distinguish position within the film), whereas is strongly affected by the interfaces. As shown in Fig. S7, the increase in near the free surface can be attributed to both a decreasing energy barrier , and a decreasing multiplicity as defined in Eq. 1 (Supporting Information); that increases despite the competing effects of and indicates the importance of the drastically reduced energy barriers near the free surface. Importantly, the length over which this change occurs is not generic—it depends on both film temperature and aging—and therefore does not correspond to a simple multiplicative reduction in the barrier height as a function of distance from the interface. This clearly demonstrates the cross-over from one relaxation mechanism to the other. That energy barriers can be strongly affected by interfaces and result in a “fluid” phase even well below is consistent with recent experimental work on glassy film dewetting (29).
Fig. S7.
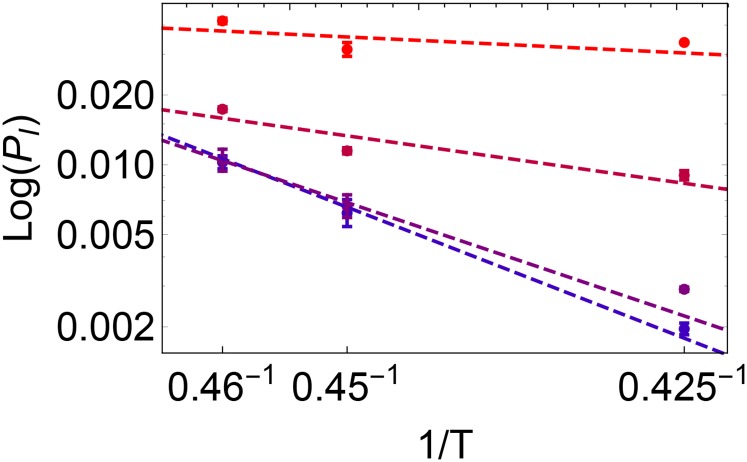
The vs inverse temperature. From bottom to top (blue to red), the curves correspond to data in different layers of the film (with respect to the center): , , , and . The error bars for each point are the larger of either (i) the SE of the mean when combining multiple ages together or (ii) the SE of the fit used to extract from the data.
We note that and depend on the cutoff length characterizing the structure functions chosen, since we know that structure functions with a range somewhat larger than our maximum cutoff here do add slightly to the predictive value of softness in the bulk (15). However, the extremely modest dependencies we expect are not enough to account for the dramatic changes observed in, e.g., Fig. 3.
Discussion
In conclusion, we have applied machine learning methods to show that the relaxation dynamics in glassy thin films are characterized by two independent processes, one that depends on local structure but not position in the film and one that is purely Arrhenius and depends on position in the film but not softness. Moreover, there is no detectable correlation between structure and enhanced or suppressed dynamics near the surfaces of thin glassy films. This is true even after radically enlarging the space of local structure quantities we consider to very general classes of two-point and multipoint quantities. Although we cannot consider all possible structural quantities, our results strongly suggest that the local structure is the same everywhere except very close to the edge of the film.
Note that, in other simulation models of glass formers, it is well known that some structural features can persist farther away from the surface into the film (e.g., density oscillations or species segregation in multicomponent LJ fluids). Our results show that long-ranged dynamic mobility gradients can exist even in the absence of any such structural features, suggesting that the altered dynamics near interfaces are likely not primarily structural in nature.
We note that we are limited to using structure functions with a truncated spatial range . One might ask whether our conclusion that local structure is uniform throughout the film is an artifact of having chosen a value of that is too small to characterize the structure of a cooperatively rearranging region. If that were the case, our results would imply that the core of the cooperatively rearranging region, of size , would have to be independent of position in the film. Thus, any dependence on position would have to come from the structure (but not the density) of the outer corona of the cooperatively rearranging region. This seems highly unlikely.
Existing theoretical models of the behavior of thin glassy films start from a diverse set of assumptions, considering configurational entropy, facilitated dynamics, and the effect of changing elastic moduli on the barriers to local rearrangements (24, 30–35). Our results strongly favor theoretical descriptions that do not rely on structural differences to propagate the effect of the interface into the film. Moreover, the results in Figs. 1 and 2 show that one cannot simply conclude that enhanced dynamics are a consequence of facilitation: Even in thin films, there is a strong connection between local structure and dynamics, but interfaces provide an additional source or sink of mobility that somehow does not affect the rate at which local structure (softness) relaxes.
The behavior of thin glassy films has often been interpreted in terms of a two-population model, in which there is a glassy, immobile layer near the center of the film and a liquid-like mobile layer near the free surfaces (1, 36–38). This interpretation is supported by observations of probe molecules embedded in films (39, 40). Our results show that the two populations are indistinguishable, from a structural point of view. We note that previous studies have observed a decoupling between some measures of local structure, for instance the local free volume (25), and thin film dynamics. Our approach does not just add an additional data point in this direction; it rules out whole classes of potential local structural descriptors: Any local feature that could be written as a linear, or even nonlinear, combination of the structure functions used in this work is invalidated by this study.
Instead, our results show that the two populations are distinguished by two different and uncorrelated mechanisms of relaxation, which must coincide in order for rearrangements to occur. One of these processes, , depends on structure, and the other process, , does not. If these processes could independently cause rearrangements, then we would expect instead of ; our observations are consistent with the latter form, not the former. This surprising finding is buttressed by the decoupling between the physical relaxation time scale and the softness relaxation time scale observed in Fig. 2. Interfaces primarily affect dynamics through . It is tempting to speculate that is related to recent observations of a decoupling between surface diffusion and activated relaxation events in glass thin films (41, 42).
Simulation Details
We perform molecular dynamics simulations of a commonly used coarse-grained model polymer (43) prepared in thin film geometries. Our film systems have total particles of diameter , composed of monodisperse chains of length (our bulk systems used ). The nonbonded interactions between particles and are specified by
| [S1] |
for and for . Here sets the energy scale, and we take the range of the nonbonded interactions to be . For the bonded interactions, we use a very stiff harmonic potential,
| [S2] |
where . In this paper, we report results in reduced LJ simulation units, e.g., the temperature and the time , where and are defined in laboratory units, and is the mass of a particle. For this model, the bulk glass transition temperature is estimated to be , arrived at by measuring the specific volume during constant-cooling-rate simulations from above to below . All of our simulations were run in the NVT ensemble at a time step of using the HOOMD-blue simulation package (19, 20).
The films were prepared by first prepacking noninteracting random walks with the correct single-chain statistics in a simulation cell with the dimensions of the desired film (15, 44). By treating two of the three dimensions as periodic and the other () dimension as a reflecting wall, at this step, we are able to start with a configuration of chains that will not be greatly perturbed when the direction of the box is expanded to expose the surfaces of the film to vacuum. We then use a collection of chain-altering Monte Carlo moves that simultaneously reduce the density fluctuations of the prepacked chains and respect the single-chain statistics imposed by the model potentials and by the thin film geometry. From these noninteracting chain configurations, the box was expanded in the direction to allow for a freestanding film, the LJ and bonded interactions were slowly turned on, and molecular dynamics using the potentials and parameters above were begun. All configurations were prepared at an initial reduced temperature of and cooled at a constant rate of to the desired temperature; the aging time refers to simulation time since the end of this cooling procedure. For the supported films, we first took the configuration of a thick () slab of particles from the center of a freestanding film at and . We permanently fixed the positions of these particles and then brought an equilibrated freestanding film at in contact with this frozen layer, and then repeated the cooling procedure described above.
Definitions of Structural Features
Here we detail the definitions of the structure functions and used in the main text. For the first, we follow Steinhardt et al. (28) and define the function as
| [S3] |
where
| [S4] |
From the above, it is clear that is the average value of the spherical harmonics, , for every particle in a shell near particle , and forms a rotationally invariant combination of the . For our structure functions, we choose and to be shells of width where the inner radius starts at 1.0, 1.5, and 2.0 (all in units of ). We chose parameters in the set .
To define the structure functions, we directly compute spherical harmonics using as the special axis of symmetry,
| [S5] |
where, for convenience, we work in the basis where the themselves are real. We again use the set , and consider all .
We note that, in addition to the machine learning tests discussed in the main text, we also attempted more intricate tests by expanding our set of labels to (i) , , (ii) , , (iii) , , and (iv) , . That is, we took preidentified soft and hard particles from different sections of the film. Using the same generalized set of structure functions, the difference between any pair of hard and soft populations is easily detectable. On the other hand, trying to distinguish the position-based labels from each other leads to very low but positive predictive accuracy (cross-validation accuracies of % were obtained). This is consistent with the idea that, in different layers of the film, particles above and below fixed cutoffs correspond to particles with different mean softness cutoffs. Thus, this weak predictive accuracy is consistent with our finding that the structure itself is the same throughout the film.
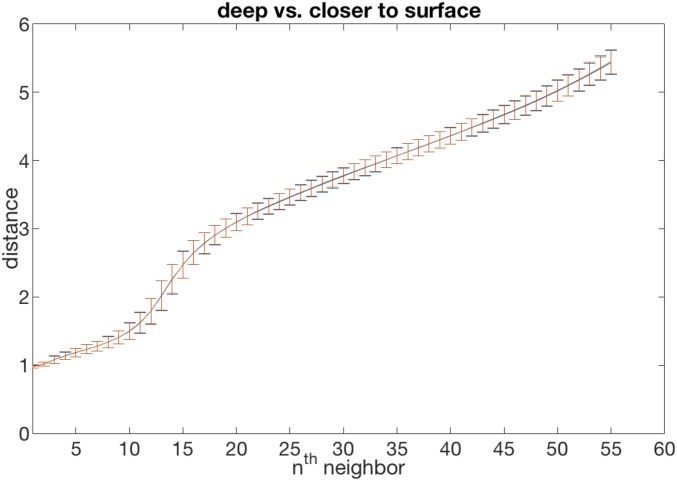
We have applied several classification algorithms on the center vs. edge datasets. This includes SVMs with linear and radial basis function kernels, as well as feed-forward neural networks with up to six fully connected layers. We applied these classification algorithms using both the symmetry functions described above and those in the main text, as well as with a very “raw” set of structural descriptors, , corresponding to distance of the nearest neighbor of particle . This raw set of descriptors was shown to work when classifying soft and hard particles drawn from bulk systems. The mean distances and their standard deviations are shown in Fig. S1 for center and edge particles, in blue and red, respectively. We have also confirmed that adding features such as the neighbor distances along vs. in the plane does not give us any predictive power.
Fig. S1.
Mean distances and variances of the nearest neighbor of a given particle for particles near the film center (blue) and closer to the edge (red).
Further Quantification of the Predictive Accuracy of Softness in Thin Films
We further quantify the predictive accuracy of softness in thin films by using the function proposed in ref. 14 for an arbitrary structural quantity, ,
| [S6] |
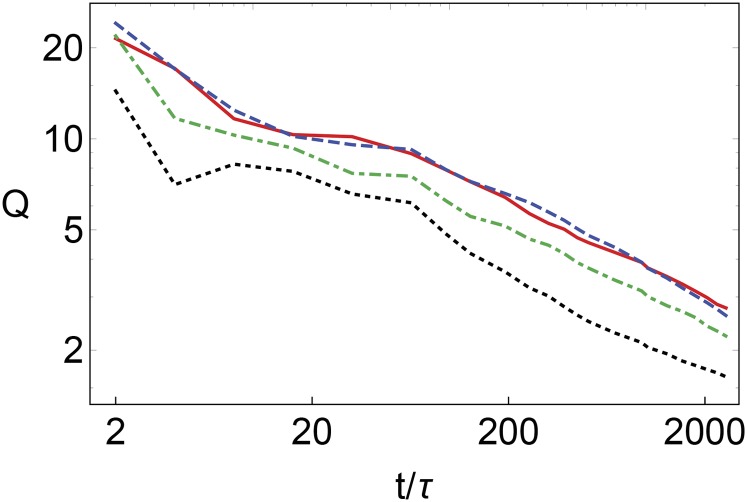
i.e., the ratio of the probability of rearrangement for particles with measure a SD above and below the mean, as a function of time since was measured. For context, we report for inherent structures of bulk KA mixtures at and density using different features to try to predict rearrangements: , where is the coordination number; , where is the local energy; and , where is softness (14). Fig. S2 reports for softness evaluated on several different layers in a thin film. We note that decays in a nearly scale-free way over more than three decades of time, a range that covers roughly an order of magnitude less than the relaxation time at the center of the film. Even in the intermediate layers of the film, retains a surprisingly high predictive power well beyond the time scale rearrangements that the softness field was trained on. However, as one moves away from the center of the film, shifts downward, indicating that the overall ability of softness to predict rearrangements decreases.
Fig. S2.
for freestanding thin film at and . The solid red, dashed blue, dash-dotted green, and dotted black curves are, respectively, averages over particles with , , , and .
We now move to testing whether different structural features can predict the position of particles within the film. As discussed in the main text, we create a training set of particles drawn from either the center of the film or closer to the edge (but still far from the regime with interfacial fluctuations of the density). Fig. S3 reports, in blue circles, the -function score obtained by using different combinations of structural features (obtained by replacing in the definition of Eq. S6 by the probability of being identified correctly as being in the center of the film). In the figure, corresponds to softness, as defined in the main text, using only radial structure functions. The second set, , corresponds to adding angular information contained in both the angularly averaged spherical harmonics and also those that select out the film normal as a special axis of symmetry. The final set, , additionally takes into account spatial correlations in the standard softness field. All three blue circles sit at , indicating a complete lack of predictive power.
In contrast, we stress that dynamical information can predict position within the film, as we would expect. Structure functions that correspond simply to the average magnitude of particle displacement at logarithmically sampled times less than allow increasingly accurate predictions of particle position as the maximum time interval grows. (The prediction accuracy should level off once the time interval is comparable to the relaxation time in the edge layer.) The results for the predictive power of these dynamical features are also summarized in Fig. S3 in terms of their functions (and elaborated on below). We note that the predictive value of short-time dynamical information is quite small, indicating that the nature of short-time fluctuations is not qualitatively different close to the film interface.
Training on Dynamical Features
Our definition of the dynamical structure function, , is the set of instantaneously measured displacement magnitudes, , for the times less than in the set of approximately logarithmically spaced data, . Aside from the details of the time intervals considered, we note that this is a subset of the data that would be used to compute the alpha relaxation time from the decay of the overlap function (27),
| [S7] |
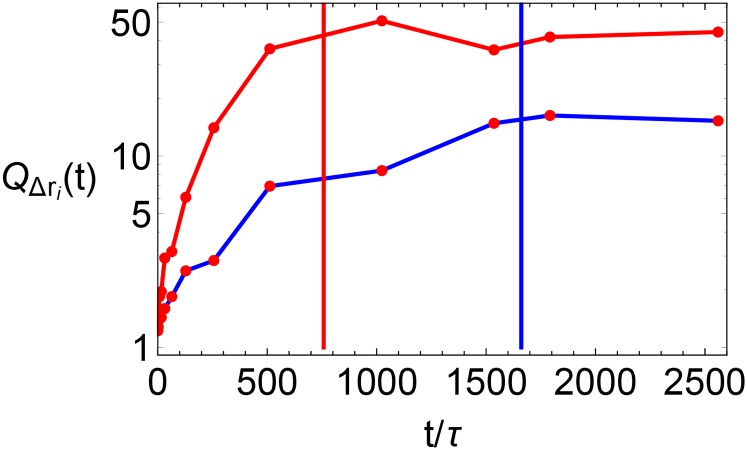
The relaxation time is defined as a particular transformation (a thresholding) of the data, and the machine learning algorithm corresponds to a different nonlinear transformation of the data. Thus, one might expect to be able to detect the same time scales by machine learning, namely for the different layers being compared. This indeed seems to be the case. The three data points in Fig. 3 rise dramatically with increasing time, but one does not expect this rapid growth to continue indefinitely. Fig. S4 shows the score for distinguishing edge from central particles in the , thin films as a function of the time used in and the position of the edge particle population. Our data are insufficient to see the longer time scale of the central particles, but we see that, for two different layers, there is a cross-over in the behavior of at a time proportional to the relaxation time in each layer of the film.
Fig. S4.
-function scores obtained trying to distinguish 2,500 particles near the center of the film vs particles with (red upper curve) and vs particles with (blue lower curve). Vertical dashed lines are proportional to the as measured by the decay of the overlap function.
Probability of Rearrangements
In addition to the function described above, one can directly calculate the relationship between the probability of a particle rearranging () and its softness for different layers in the film. In ref. 15, we showed that the probability of rearrangements, , could be accurately expressed as ; this was confirmed in bulk systems by the collapse of when plotted against for many temperatures. The energy scale was shown to depend nearly linearly on , , and the prefactor varied with .
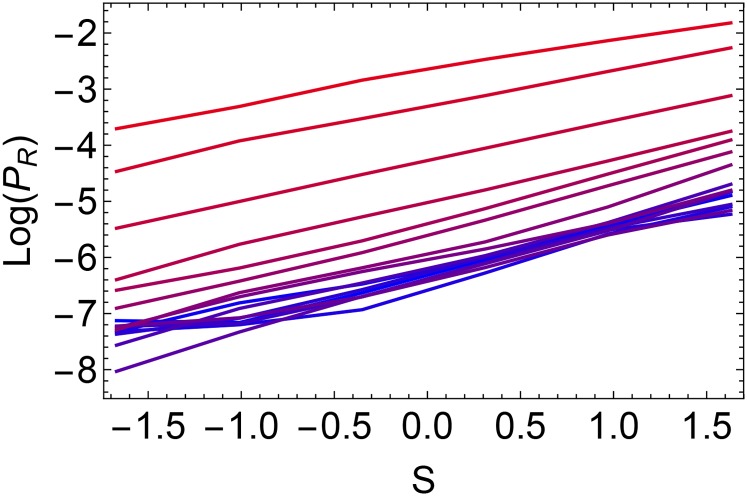
In Fig. S5, we report the for different layers in the film, again using the configuration with and . Note that, on the logarithmic scale, the results for different layers are related by nearly vertical shifts. The results in the main text comparing and with their bulk counterparts were derived from these data.
Fig. S5.
Probability of rearrangement as a function of softness for different layers of a , film. The curves are averages over particles with (blue to red) for .
Softness-Independent Energy Barriers in Thin Films
In Fig. 3, we showed the value of and for a thin film at and . In the center of the film, the value of was similar to the value extract by fitting bulk data.
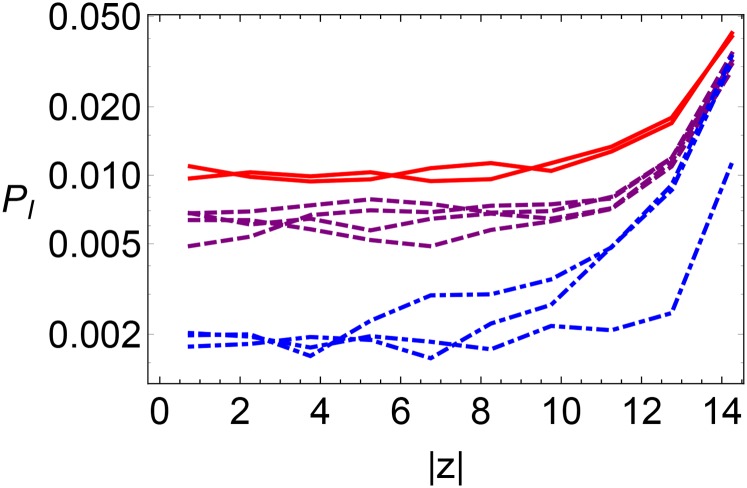
Fig. S6 shows the values of for more films at different temperatures and ages. Note that, at the edge of the film, the latest ages at each temperature have converged. At the center of the film, it is possible that will change with age, but the dependence is very slight and does not show systematic trends with age. We average the values of for a given temperature at the ages over which the value of is no longer evolving (or at the latest age if it is still evolving) to plot as a function of in Fig. S7 for four different layers ranging from purple to red for positions varying from the center of the film to near the edge. The results are approximately consistent with straight-line fits at each layer position, as expected from Eq. 1. The increase of near the edge of the film results from a decrease in both the energy barrier associated with the Arrhenius process , and the multiplicity .
Fig. S6.
as a function of film position for films at different ages. The red solid curves correspond to films at and . The purple dashed curves correspond to films at and , and the blue dot-dashed curves correspond to films at and .
Acknowledgments
We thank Robert Riggleman and Amit Shavit for helpful discussions and for sharing data on their thin film configurations. This work was supported by the Advanced Materials Fellowship of the American Philosophical Society (to D.M.S.), the University of Pennsylvania MRSEC DMR-1120901 (to D.M.S. and A.J.L.), the US Department of Energy, Office of Basic Energy Sciences, Division of Materials Sciences and Engineering under Award DE-FG02-05ER46199 (to S.S.S. and A.J.L.), and the Simons Foundation Grants 454945 and 327939 (to A.J.L.). The Tesla K40 used for this research was donated by the NVIDIA Corporation.
Footnotes
The authors declare no conflict of interest.
This article is a PNAS Direct Submission.
This article contains supporting information online at www.pnas.org/lookup/suppl/doi:10.1073/pnas.1703927114/-/DCSupplemental.
References
- 1.Ediger MD, Forrest JA. Dynamics near free surfaces and the glass transition in thin polymer films: A view to the future. Macromolecules. 2014;47:471–478. [Google Scholar]
- 2.Fakhraai Z, Forrest JA. Measuring the surface dynamics of glassy polymers. Science. 2008;319:600–604. doi: 10.1126/science.1151205. [DOI] [PubMed] [Google Scholar]
- 3.Lang RJ, Simmons DS. Interfacial dynamic length scales in the glass transition of a model freestanding polymer film and their connection to cooperative motion. Macromolecules. 2013;46:9818–9825. [Google Scholar]
- 4.Scheidler P, Kob W, Binder K. Cooperative motion and growing length scales in supercooled confined liquids. Europhys Lett. 2002;59:701–707. [Google Scholar]
- 5.Hocky GM, Berthier L, Kob W, Reichman DR. Crossovers in the dynamics of supercooled liquids probed by an amorphous wall. Phys Rev E. 2014;89:052311. doi: 10.1103/PhysRevE.89.052311. [DOI] [PubMed] [Google Scholar]
- 6.Pye JE, Rohald KA, Baker EA, Roth CB. Physical aging in ultrathin polystyrene films: Evidence of a gradient in dynamics at the free surface and its connection to the glass transition temperature reductions. Macromolecules. 2010;43:8296–8303. [Google Scholar]
- 7.Shavit A, Riggleman RA. Physical aging, the local dynamics of glass-forming polymers under nanoscale confinement. J Phys Chem B. 2014;118:9096–9103. doi: 10.1021/jp502952n. [DOI] [PubMed] [Google Scholar]
- 8.Berthier L, Jack RL. Structure and dynamics of glass formers: Predictability at large length scales. Phys Rev E. 2007;76:041509. doi: 10.1103/PhysRevE.76.041509. [DOI] [PubMed] [Google Scholar]
- 9.Widmer-Cooper A, Perry H, Harrowell P, Reichman DR. Irreversible reorganization in a supercooled liquid originates from localized soft modes. Nat Phys. 2008;4:711–715. [Google Scholar]
- 10.Royall CP, Williams SR, Ohtsuka T, Tanaka H. Direct observation of a local structural mechanism for dynamic arrest. Nat Mater. 2008;7:556–561. doi: 10.1038/nmat2219. [DOI] [PubMed] [Google Scholar]
- 11.Manning ML, Liu AJ. Vibrational modes identify soft spots in a sheared disordered packing. Phys Rev Lett. 2011;107:108302. doi: 10.1103/PhysRevLett.107.108302. [DOI] [PubMed] [Google Scholar]
- 12.Schoenholz SS, Liu AJ, Riggleman RA, Rottler J. Understanding plastic deformation in thermal glasses from single-soft-spot dynamics. Phys Rev X. 2014;4:031014. [Google Scholar]
- 13.Cubuk ED, et al. Identifying structural flow defects in disordered solids using machine-learning methods. Phys Rev Lett. 2015;114:108001. doi: 10.1103/PhysRevLett.114.108001. [DOI] [PubMed] [Google Scholar]
- 14.Cubuk ED, Schoenholz SS, Kaxiras E, Liu AJ. Structural properties of defects in glassy liquids. J Phys Chem B. 2016;120:6139–6146. doi: 10.1021/acs.jpcb.6b02144. [DOI] [PubMed] [Google Scholar]
- 15.Schoenholz SS, Cubuk ED, Sussman DM, Kaxiras E, Liu AJ. A structural approach to relaxation in glassy liquids. Nat Phys. 2016;12:469–471. [Google Scholar]
- 16.Schoenholz SS, Cubuk ED, Kaxiras E, Liu AJ. Relationship between local structure and relaxation in out-of-equilibrium glassy systems. Proc Natl Acad Sci USA. 2017;114:263–267. doi: 10.1073/pnas.1610204114. [DOI] [PMC free article] [PubMed] [Google Scholar]
- 17.Shavit A, Riggleman RA. Influence of backbone rigidity on nanoscale confinement effects in model glass-forming polymers. Macromolecules. 2013;46:5044–5052. [Google Scholar]
- 18.Sussman DM. Spatial distribution of entanglements in thin free-standing films. Phys Rev E. 2016;94:012503. doi: 10.1103/PhysRevE.94.012503. [DOI] [PubMed] [Google Scholar]
- 19.Anderson JA, Lorenz CD, Travesset A. General purpose molecular dynamics simulations fully implemented on graphics processing units. J Comput Phys. 2008;227:5342–5359. [Google Scholar]
- 20. University of Michigan (2017) HOOMD-blue. Available at glotzerlab.engin.umich.edu/hoomd-blue/. Accessed September 7, 2017.
- 21.Roth CB, Pye JE, Baglay RR. Polymer Glasses. CRC; Boca Raton, FL: 2016. Correlating glass transition and physical aging in thin polymer films; pp. 181–204. [Google Scholar]
- 22.Candelier R, Dauchot O, Biroli G. Building blocks of dynamical heterogeneities in dense granular media. Phys Rev Lett. 2009;102:088001. doi: 10.1103/PhysRevLett.102.088001. [DOI] [PubMed] [Google Scholar]
- 23.Keys AS, Abate AR, Glotzer SC, Durian DJ. Measurement of growing dynamical length scales and prediction of the jamming transition in a granular material. Nat Phys. 2007;3:260–264. [Google Scholar]
- 24.Hanakata PZ, Douglas JF, Starr FW. Interfacial mobility scale determines the scale of collective motion and relaxation rate in polymer films. Nat Commun. 2014;5:4163. doi: 10.1038/ncomms5163. [DOI] [PubMed] [Google Scholar]
- 25.Hanakata PZ, Betancourt BAP, Douglas JF, Starr FW. A unifying framework to quantify the effects of substrate interactions, stiffness, and roughness on the dynamics of thin supported polymer films. J Chem Phys. 2015;142:234907. doi: 10.1063/1.4922481. [DOI] [PubMed] [Google Scholar]
- 26.Kob W, Roldán-Vargas S, Berthier L. Non-monotonic temperature evolution of dynamic correlations in glass-forming liquids. Nat Phys. 2012;8:164–167. [Google Scholar]
- 27.Keys AS, Hedges LO, Garrahan JP, Glotzer SC, Chandler D. Excitations are localized and relaxation is hierarchical in glass-forming liquids. Phys Rev X. 2011;1:021013. [Google Scholar]
- 28.Steinhardt PJ, Nelson DR, Ronchetti M. Bond-orientational order in liquids and glasses. Phys Rev B. 1983;28:784–805. [Google Scholar]
- 29.Zhang Y, et al. Long-range correlated dynamics in ultra-thin molecular glass films. J Chem Phys. 2016;145:114502. doi: 10.1063/1.5038174. [DOI] [PubMed] [Google Scholar]
- 30.Stevenson JD, Wolynes PG. On the surface of glasses. J Chem Phys. 2008;129:234514. doi: 10.1063/1.3041651. [DOI] [PMC free article] [PubMed] [Google Scholar]
- 31.Léonard S, Harrowell P. Macroscopic facilitation of glassy relaxation kinetics: Ultrastable glass films with frontlike thermal response. J Chem Phys. 2010;133:244502. doi: 10.1063/1.3511721. [DOI] [PubMed] [Google Scholar]
- 32.Chandler D, Garrahan JP. Dynamics on the way to forming glass: Bubbles in space-time. Annu Rev Phys Chem. 2010;61:191–217. doi: 10.1146/annurev.physchem.040808.090405. [DOI] [PubMed] [Google Scholar]
- 33.Tito NB, Lipson JEG, Milner ST. Lattice model of mobility at interfaces: Free surfaces, substrates, and bilayers. Soft Matter. 2013;9:9403–9413. [Google Scholar]
- 34.Mirigian S, Schweizer KS. Theory of activated glassy relaxation, mobility gradients, surface diffusion, and vitrification in free standing thin films. J Chem Phys. 2015;143:244705. doi: 10.1063/1.4937953. [DOI] [PubMed] [Google Scholar]
- 35.Salez T, Salez J, Dalnoki-Veress K, Raphaël E, Forrest JA. Cooperative strings and glassy interfaces. Proc Natl Acad Sci USA. 2015;112:8227–8231. doi: 10.1073/pnas.1503133112. [DOI] [PMC free article] [PubMed] [Google Scholar]
- 36.Yang Z, Fujii Y, Lee FK, Lam CH, Tsui OKC. Glass transition dynamics and surface layer mobility in unentangled polystyrene films. Science. 2010;328:1676–1679. doi: 10.1126/science.1184394. [DOI] [PubMed] [Google Scholar]
- 37.Meyers GF, Dekoven BM, Seitz JT. Is the molecular surface of polystyrene really glassy? Langmuir. 1992;8:2330–2335. [Google Scholar]
- 38.Chai Y, et al. A direct quantitative measure of surface mobility in a glassy polymer. Science. 2014;343:994–999. doi: 10.1126/science.1244845. [DOI] [PubMed] [Google Scholar]
- 39.Paeng K, Swallen SF, Ediger MD. Direct measurement of molecular motion in freestanding polystyrene thin films. J Am Chem Soc. 2011;133:8444–8447. doi: 10.1021/ja2022834. [DOI] [PubMed] [Google Scholar]
- 40.Glor EC, Fakhraai Z. Facilitation of interfacial dynamics in entangled polymer films. J Chem Phys. 2014;141:194505. doi: 10.1063/1.4901512. [DOI] [PubMed] [Google Scholar]
- 41.Zhang Y, Fakhraai Z. Decoupling of surface diffusion and relaxation dynamics of molecular glasses. Proc Natl Acad Sci USA. 2017;114:4915–4919. doi: 10.1073/pnas.1701400114. [DOI] [PMC free article] [PubMed] [Google Scholar]
- 42.Chowdhury M, Priestley RD. Discrete mobility on the surface of glasses. Proc Natl Acad Sci USA. 2017;114:4854–4856. doi: 10.1073/pnas.1704886114. [DOI] [PMC free article] [PubMed] [Google Scholar]
- 43.Kremer K, Grest GS. Dynamics of entangled polymer melts: A molecular-dynamics simulation. J Chem Phys. 1990;92:5057. [Google Scholar]
- 44.Auhl R, Everaers R, Grest GS, Kremer K, Plimpton SJ. Equilibration of long chain polymer melts in computer simulations. J Chem Phys. 2003;119:12718. [Google Scholar]


