

Significance
The malaria parasite Plasmodium falciparum actively invades host cells, using a mechanism that relies on the interaction of the motor protein myosin and actin filaments which serve as tracks. We determined the structure of stabilized P. falciparum actin 1 filaments at near-atomic resolution using single-particle electron cryomicroscopy. The high resolution of the structure allowed us to identify important positions in the filament that are essential for the temporal and spatial control of actin polymerization and play a pivotal role in host cell invasion, and thus infectivity. In general, our study provides important insights into the structural design of actin filaments.
Keywords: F-actin, Plasmodium, cryo-EM, jasplakinolide, malaria
Abstract
During their life cycle, apicomplexan parasites, such as the malaria parasite Plasmodium falciparum, use actomyosin-driven gliding motility to move and invade host cells. For this process, actin filament length and stability are temporally and spatially controlled. In contrast to canonical actin, P. falciparum actin 1 (PfAct1) does not readily polymerize into long, stable filaments. The structural basis of filament instability, which plays a pivotal role in host cell invasion, and thus infectivity, is poorly understood, largely because high-resolution structures of PfAct1 filaments were missing. Here, we report the near-atomic structure of jasplakinolide (JAS)-stabilized PfAct1 filaments determined by electron cryomicroscopy. The general filament architecture is similar to that of mammalian F-actin. The high resolution of the structure allowed us to identify small but important differences at inter- and intrastrand contact sites, explaining the inherent instability of apicomplexan actin filaments. JAS binds at regular intervals inside the filament to three adjacent actin subunits, reinforcing filament stability by hydrophobic interactions. Our study reveals the high-resolution structure of a small molecule bound to F-actin, highlighting the potential of electron cryomicroscopy for structure-based drug design. Furthermore, our work serves as a strong foundation for understanding the structural design and evolution of actin filaments and their function in motility and host cell invasion of apicomplexan parasites.
Actin is a highly conserved protein abundantly expressed in almost all eukaryotic cells. In concert with a multitude of actin-binding proteins (ABPs), it is involved in many important biological processes, including cell motility, muscle contraction, and vesicle trafficking (1). After the discovery and first purification of actin from muscle by Straub in 1942 (2), it took almost 50 years until the first crystal structure of monomeric globular actin (G-actin) in complex with DNase I was solved (3). Since then, structural models of filamentous actin (F-actin) have been determined either from medium-resolution electron cryomicroscopy (cryo-EM) maps (4, 5) or by interpreting X-ray fiber diffraction data (6), each of which has certain limitations. The introduction of new direct electron detectors finally enabled the determination of near-atomic structures of mammalian F-actin by cryo-EM (7, 8).
Unicellular eukaryotic apicomplexan parasites, such as species of the genera Plasmodium, Cryptosporidium, and Toxoplasma, require actin for efficient host cell invasion (9, 10). Apicomplexan actin is part of a molecular machine called the glideosome. Myosin A, in combination with several glideosome-associated proteins, interacts with actin to create the force needed for gliding. Details of the underlying mechanism, however, are only partly understood (11, 12). While most apicomplexan parasites express only one actin isoform, Plasmodium falciparum has two different actins (13, 14). Plasmodium actin 1 is expressed throughout the life cycle and is closely related to the single actin isoform found in other apicomplexan parasites (15). It shares 93% of its sequence with the actin of Toxoplasma gondii (16). Plasmodium actin 2 is only present in life cycle stages involved in transmission through the mosquito, including the gametocytes and sporozoites (15, 17, 18), and cannot be substituted by actin 1 in gametogenesis (19). Both Plasmodium actin isoforms are among the most divergent identified in one organism, sharing less than 80% of their sequence with each other as well as with opisthokont (animal and yeast) and plant actins (14).
Monomeric P. falciparum actin 1 (PfAct1) shares its fold with mammalian G-actin (19). Despite this similarity, there are small but appreciable structural deviations, especially at the binding interface of ABPs and the nucleotide-binding pocket. Furthermore, the contact sites important for filament formation contain notable deviations, particularly within the DNase-1–binding loop (D-loop) which is essential for polymerization (4).
Although all apicomplexan parasites express actin, it has been difficult to directly visualize actin filaments in vivo. Besides one recent study that reported an actin-based cytoskeleton in maturing P. falciparum gametocytes using superresolution microscopy (20), studies of other stages of the parasites describe shorter filamentous structures in equilibrium with high concentrations of G-actin (21–25). Stabilization of Plasmodium actin filaments using high concentrations of the actin-filament stabilizing agent jasplakinolide (JAS) inhibits parasite growth and impairs host cell invasion (26). Thus, it has been proposed that the unstable nature of apicomplexan actin filaments is essential for parasite survival (9). These in vivo findings are supported by several in vitro studies, in which isolated apicomplexan actins ineffectively polymerized into labile, short filaments (9, 19, 27).
PfAct1 filaments can be stabilized also in vitro with JAS (19, 28), a cyclic peptide originally isolated from the marine sponge Jaspis johnstoni (29). Similar to the competitively binding phalloidin, which has a weaker effect on parasite actin (30), JAS dramatically reduces the critical concentration of actin subunits necessary to drive polymerization and stabilizes filaments (28, 31). JAS-stabilized PfAct1 filaments are suitable for electron microscopy studies, as shown by negative staining (30) and cryo-EM reconstructions of PfAct1 filaments (19). Despite the limited resolution of the maps, it was shown that the helical rotation angle of JAS-stabilized PfAct1 filaments (−167.5°) slightly deviates from the one of canonical mammalian skeletal muscle F-actin (−166.6°), indicating possible different interactions of the actin subunits within the filament (19, 30). Biochemical studies on PfAct1 and T. gondii actin filaments indicated that the D-loop, as well as an interface once called hydrophobic plug (4) [subsequently referred to as “plug” because of its hydrophilic nature (5,7)], have an impact on the filament stability (9, 19). However, the structural basis of filament instability of PfAct1, which plays a pivotal role in host cell invasion, and thus infectivity, remains poorly characterized, largely because high-resolution structures of PfAct1 filaments were missing.
Here, we report the near-atomic structure of JAS-stabilized PfAct1 filaments at an average resolution of 3.8 Å, determined by cryo-EM. We identify several small but crucial differences compared with canonical actins at inter- and intrastrand contact sites as the probable cause for the instability of the parasite actin filament. Small differences are sufficient to weaken key interactions at the plug and D-loop regions. We further show that JAS binds at regular intervals inside the filament to three adjacent F-actin subunits, occupying a hydrophobic groove that matches its shape. It reinforces intra- and interstrand contacts and, in addition, directly compensates for weak spots in PfAct1 filaments.
Results and Discussion
Structure Determination.
Without stabilizing agents, only short, irregular filaments and aggregates of PfAct1 are observed in negative-stain electron microscopy (9, 19). To exclude the possibility that the staining procedure, including a pH shift to pH 4–5 and drying of the sample, disrupts existing but labile filaments, we vitrified nonstabilized PfAct1 filaments and analyzed them by cryo-EM (Fig. S1). Although we screened different conditions, we could only identify short, irregular filaments and fragments, indicating that the staining procedure is not the cause for the instability of the PfAct1 filaments. Because these short, irregular filaments and fragments are not suitable for data collection and processing, we stabilized PfAct1 filaments with JAS for cryo-EM, as described previously (19, 30). This resulted in long, straight filaments, in which single actin subunits could already be distinguished on the micrograph level, illustrating their regular arrangement within a double-stranded helix (Fig. S2A).
Fig. S1.

Inhomogeneity of nonstabilized PfAct1 filaments does not allow structural analysis by cryo-EM. (A) Representative cryo-EM micrograph of filamentous PfAct1 in the absence of JAS. The image was bandpass-filtered to enhance the contrast. (Scale bar, 250 nm.) (B) Contrast-enhanced close-up view showing short irregular filament-like assemblies. (Scale bar, 100 nm.)
Fig. S2.

Cryo-EM refinement and resolution of PfAct1. (A) Representative digital micrograph at −2.4-μm defocus. (Scale bar, 50 nm.) (B) Side and top view (Inset) of the final angular distribution after 3D refinement (SI Materials and Methods). (C) FSC curve between maps from two independently refined half-datasets. The FSC0.143 criterion indicates an average resolution of 3.8 Å. (D) Color-coded local resolution estimated by SPHIRE (54). Note that the resolution drops gradually toward the ends of the filament.
We collected a cryo-EM dataset and processed it using a single-particle–based approach with external constraints and a priori values that account for the filament character (details are provided in Materials and Methods). The constrained refinement converged into a homogeneous Gaussian distribution of projection angles around the equator (Fig. S2B). In the case of filaments, the reported average resolution is often affected by the edges, which are prone to processing artifacts, and the internal flexibility of the protein (32). This is also true for the 3D reconstruction of PfAct1 filaments (Fig. 1A). Although the average resolution is 3.8 Å, the local resolution of the central fraction is between 3.2 Å and 3.6 Å (Fig. S2 C and D). Based on the observed resolution gradient, we built an atomic model for the central part of the filament only, containing five actin subunits (Fig. 1 A and B). We could clearly identify map density corresponding to ADP and the coordinated cation, most probably Mg2+ (Fig. 1C). The coordination within the nucleotide-binding site of filamentous PfAct1 is remarkably similar to that of canonical F-actin (Fig. S3). In addition, JAS could be assigned to map densities residing at the center of the filament, intercalating between actin subunits (Fig. 1 A and D). The orientation of JAS within the map is unambiguous, although the bromine moiety is underrepresented, most likely due to radiation damage (Fig. 1D).
Fig. 1.

Structure of JAS-stabilized PfAct1 filament. (A) Cryo-EM reconstruction of PfAct1 (gray, with five central subunits in blue, cyan, and magenta) stabilized by JAS (yellow). (B) Side view of subunit D (density: gray, atomic model: cyan) with bound ADP (blue) illustrating the SD organization of actin. A close-up view of ADP-Mg2+ (C) and a slightly tilted top view of JAS (D) are shown with respective densities. (Scale bar, 1.5 nm.)
Fig. S3.

Comparison of the nucleotide-binding site of filamentous PfAct1 and α-actin. (A) Overview of one subunit of filamentous PfAct1. Coordination of ADP-Mg2+ in the nucleotide-binding pocket of PfAct1 (B, blue) and α-actin (C, green) [PDB accession code 5JLF (32)]. Interactions are highlighted by dashed lines. Close-up view of the density map of ADP-Mg2+ from PfAct1 (D) and α-actin (E) [EMDB accession code 8162 (32)].
Filament Architecture and Interfaces in PfAct1.
Filamentous JAS-stabilized PfAct1 arranges in a polar double-stranded helix (Fig. 1A) and shares its general filament architecture with mammalian F-actin (7). As reported previously (19, 30), however, the helical rotation angle (also known as the helical twist, dφ) of JAS-stabilized PfAct1 is −(167.5 ± 0.1)°, deviating from the value for canonical actin of −166.6° by ∼1°. The helical rise, dz, of (27.42 ± 0.02) Å is similar to canonical actin. Previously, the helical symmetry was refined using a single-particle–based helical reconstruction approach (19). In our case, since we built our atomic model into a nonsymmetrized (C1) electron density map at 3.8 Å resolution, we could determine the helical symmetry parameters of the filament in an alternative way and just overlay the subunits of the model. In general, the values describing the helical symmetry directly depend on the pixel size, which is difficult to determine accurately. A standard method to measure the pixel size of a given microscope setup is to use a calibration specimen with known dimensions. Depending on the specimen, the inaccuracy of the derived value can be as large as 1–5%. Since the pixel size has a noteworthy impact on the helical symmetry parameters, it is best to compare parameters retrieved from the same microscope setup. For a direct comparison, we therefore determined the helical symmetry parameters of an atomic model of canonical F-actin, originating from a dataset that was collected on the same microscope using comparable settings (results will be published elsewhere). The dz of this model is (27.4 ± 0.1) Å, and the dφ is −(166.6 ± 0.1)°. These values correspond well with the helical symmetry parameters of F-actin that have been independently determined by different groups (6, 8). We conclude from this that the calibration of our electron microscope is accurate and the twist of PfAct1 filaments is indeed ∼1° larger than in previously determined canonical F-actin structures.
The interface of the two strands within the filament changes slightly due to the altered twist. However, when examining the structures in more detail, we did not observe striking differences that might have an effect on the stability of the filament. All major interactions at the interfaces are present (Fig. S4). Only the position of the D-loop is clearly shifted relative to the position in canonical F-actin (Fig. 2). However, the hydrophobic interaction at this site with the adjacent actin subunit is not affected, and therefore cannot account for the inherent instability of PfAct1 filaments (Fig. S4 C and D). The different position of the D-loop, which is also the least conserved region of PfAct1, is likely not the cause for the different helical twist. Namely, the D-loop in Plasmodium actin 2 is nearly identical in sequence with PfAct1, yet actin 2 filaments have the conventional twist (19). Conversely, the repositioning of the D-loop could be a consequence of the larger twist. On the other hand, replacement of the D-loop in PfAct1 with that of mammalian actin leads to more stable filaments, which, however, still have the twist of 167.5° (19). Thus, if and how the position of the D-loop and the unusual helical twist in PfAct1 filaments are correlated remain to be investigated.
Fig. S4.

Interstrand and intrastrand interactions. (A) Interaction of the plug with two neighboring subunits. The central actin subunit is depicted in magenta, and adjacent ones are depicted in blue and cyan. Main interactions between subunits are highlighted by dotted lines. (B) Same view as in A showing the surface of the central subunit colored by electrostatic Coulomb potentials ranging from −10 kcal⋅mol−1 (red) to +10 kcal⋅mol−1 (blue). Front (C) and side (D) views of the D-loop interacting with the adjacent intrastrand subunit are shown. Models and surfaces are colored from high (yellow) to low (white) hydrophobicity.
Fig. 2.

Structurally deviating D-loop in PfAct1. (A) Backbone of the central subunit colored by the root mean square deviation (RMSD) between PfAct1 and α-actin [PDB ID code 5JLF (32)], illustrating a significant deviation within the D-loop. (B) Superimposed electron density maps of PfAct1 (gray) and α-actin (yellow) [EMDB accession code 8162 (32)]. (C) Backbone of corresponding atomic models in blue and green, respectively [α-actin: PDB accession code 5JLF (32)]. The observed differences within the D-loop originate most likely from P42 in PfAct1 at the position of Q41 in α-actin that introduces a kink.
The subdomain (SD) organization of filamentous PfAct1 (Fig. 1B) resembles that of the recent structure of canonical F-actin in the ADP state (7). All major intra- and interstrand interfaces reported for canonical F-actin are structurally conserved in PfAct1. These include the plug region in SD3, which is involved in mainly electrostatic interactions between the two strands (Fig. S4 A and B). The D-loop in SD2 connects by hydrophobic interactions to a complementarily shaped groove in SD3 of an adjacent subunit within the same strand. This contact is furthermore enforced by Y170, which inserts into the D-loop, resembling a lock-and-key interaction (Fig. S4 C and D). In addition, there are two hydrophobic contact sites that have not been described previously. The first interface consists mainly of V288 in SD3, which enters a shape-complementary groove in SD4 of the adjacent intrastrand subunit (Fig. S5A). The second one is in close vicinity and is made up of residues 195–202 of SD4, which interact with SD1 of the opposing interstrand subunit (Fig. S5B).
Fig. S5.

Additional hydrophobic intra- and interstrand contact sites. (A) In PfAct1 V288 in SD3 of the upper subunits insets into a hydrophobic groove in SD4 of the lower intrastrand subunit, resembling a lock-and-key interaction. (B) Hydrophobic residues in SD4 interact with SD1 of the opposing subunit, mediating the interstrand contact. Surfaces are colored from high (yellow) to low (white) hydrophobicity.
Conformational Change upon Transition Between Globular and Filamentous PfAct1.
The canonical actin monomer undergoes a conformational change upon polymerization. During the transition from G-actin to F-actin, SD1 and SD2 rotate by ∼20° relative to SD3 and SD4, resulting in a flattening of the protomer (6, 7). When comparing the globular conformation (19) with the filamentous conformation of PfAct1, we observed that it underwent a similar conformational change (Fig. S6). During the transition from globular PfAct1 to its filamentous form, the monomer rotates by ∼11.5° (Fig. S6 C and D). The rotation is noticeably smaller than in canonical actin. However, in the crystal structure of globular PfAct1, the SDs are already rotated by ∼7° relative to canonical G-actin. This could be an intrinsic feature of PfAct1 and could be responsible for the higher hydrolysis rate in the G-form compared with canonical G-actin (19). On the other hand, it could also indicate a certain degree of flexibility of monomeric actin. In this line, a recent study on MamK, an actin homolog from bacteria, revealed monomers with different interdomain angles within one crystal (33). Such a difference in conformation or higher degree of flexibility could also reflect a different dependence between ATP hydrolysis and polymerization in the early-branched actins (19). In addition, the smaller difference in conformation between the free actin monomer and the subunit in the filament may contribute to the instability of the filaments by favoring depolymerization.
Fig. S6.

G- to F-actin transition of PfAct1. Front (A) and side (B) views of an atomic model of globular α-actin illustrate the SD organization of actin [PDB ID code 1J6Z (63)]. (C) Taking globular α-actin as a reference, SD1 and SD2 of globular PfAct1 are rotated by ∼7° relative to SD3 and SD4 [PDB ID code 4CBU (19)]. (D) Additional rotation of ∼11.5° of SD1 and SD2 upon polymerization further flattens the monomer. Note that the rotation of SD1 and SD2 of filamentous PfAct1 relative to globular α-actin is ∼18.5° in contrast to the 20° reported for filamentous α-actin (6, 7). In all subfigures, SD1 and SD2 are depicted in red and SD3 and SD4 are depicted in blue, respectively.
JAS-Binding Mode.
JAS binds at regular intervals inside the filament connecting three actin subunits that span both strands (Figs. 1A and 3A and Movie S1). It therefore mediates additional intra- and interstrand contacts. This is in agreement with previous molecular modeling studies (34). However, the proposed binding site and orientation of JAS differ substantially. JAS snugly fits into a complementarily shaped groove formed by the interface of SD4 of one subunit and SD3 of the adjacent intrastrand subunit. Its cyclic ring stacks onto a plateau formed by residues 198–202 of SD4 of the first subunit. The aromatic side chains of JAS enter between the two strands, separating SD4 of the same subunit and SD1 of the opposing interstrand subunit (Fig. 3 and Movie S1).
Fig. 3.

Interaction of JAS with PfAct1. (A) JAS (yellow) binds noncovalently to three actin subunits (magenta, blue, and cyan) strengthening both interstrand and intrastrand contacts. (B) Tilted top view of JAS and amino acids involved in the interaction.
The interactions between JAS and the PfAct1 filament are of a hydrophobic nature. Hydrophobic and weakly soluble in water (29, 35), JAS binds to prominent hydrophobic patches inside the actin filament (Fig. S7). Interestingly, the hydrophobic patches are highly conserved in sequence, explaining the universal stabilizing effect of JAS on many F-actins, including those from green algae and higher plants (19, 28) (Fig. S8). It has been reported that JAS influences at least the dynamic properties, thermal stability, and ATP hydrolysis rate of actin (36, 37). The structures of JAS-stabilized PfAct1 and canonical F-actin, however, are remarkably similar. It would therefore be tempting to speculate that JAS does not alter the filament architecture. Structures of alternatively stabilized PfAct1 filaments and JAS-stabilized canonical actin, however, will be needed to prove this.
Fig. S7.

Hydrophobic JAS-binding site. Side (A and B) and tilted top (C) views of the hydrophobic JAS-binding site formed by three actin subunits. (D) Same views as in A–C (I, II, and IV) and an additional bottom view (III) of JAS illustrating the hydrophobic nature of the molecule. Surfaces are colored from high (yellow) to low (white) hydrophobicity. Dashed lines indicate boundaries of actin subunits.
Fig. S8.

Conservation of the hydrophobic JAS-binding site. (A–C) Same views of the JAS-binding site as in Fig. S7 A–C. Surfaces are colored by conservation based on a sequence alignment of actins from different species (SI Materials and Methods) from 100% (purple) to 30% (turquois). Labeled residues correspond to PfAct1. Note that the prominent hydrophobic patches of the JAS-binding site are conserved. Dashed lines indicate boundaries of actin subunits.
Comparison of JAS-Stabilized PfAct1 and Canonical Actin Filaments.
To understand which residues are responsible for the inherent instability of PfAct1 filaments and how it is overcome by the binding of JAS, we compared the atomic model of JAS-stabilized PfAct1 with the atomic model of canonical F-actin in detail [Protein Data Bank (PDB) ID code 5JLF] (7, 32). Note that the sequence of PfAct1 is shifted by one amino acid relative to skeletal muscle α-actin from Oryctolagus cuniculus. A comparison of the backbone of both models revealed that the only large difference between them is the position of the D-loop (Fig. 2 and Fig. S9). This is surprising, since the protein sequences also differ in many other regions between PfAct1 and canonical actin (Fig. S9B). The D-loop of filamentous PfAct1 is clearly shifted outward relative to the one of canonical actin (Fig. 2B). This shift is possibly due to a substitution of Q41 to proline that introduces a kink (Fig. 2C). Although this shift has no direct influence on the interface (Fig. S4 C and D), it might still slightly destabilize the intrastrand contact at this site and weaken the overall stability of the filament. In this line, a D-loop mutant, in which the complete D-loop of PfAct1 was exchanged for that of canonical actin, formed filaments also in the absence of any stabilizing agent (19).
Fig. S9.

Structural and sequence comparison of PfAct1 and α-actin. (A) Backbone of the central subunit colored by the RMSD between PfAct1 and α-actin. The position of the D-loop deviates significantly. (B) Color-coded sequence alignment illustrating the relatively low sequence identity of PfAct1 and α-actin [α-actin: PDB accession code 5JLF (32)].
Interestingly, while the tip of the D-loop interacts hydrophobically with the adjacent intrastrand subunit in both actins (Fig. S4), the outward-facing base of the D-loop is negatively charged in PfAct1 and neutral to positive in canonical F-actin (Fig. S10). Although this may not have any effect on the stability of the filament itself, the change of charge likely has an impact on the interactions of PfAct1 with ABPs, particularly coronin and myosin. Both bind to F-actin at the position of or in close vicinity to the D-loop (32, 38, 39).
Fig. S10.

Altered charge in the D-loop region of PfAct1. The intrastrand contact of PfAct1 (A–C) and α-actin [PDB accession code 5JLF (32)] (D–F) is primarily mediated by the D-loop. (A and D) The main key-and-lock interaction, which is based on hydrophobic interactions, is found in both filaments (also Fig. 4). (B, C, E, and F) Surface charges of the D-loop differ between PfAct1 and canonical F-actin. Actin is depicted as a surface colored by electrostatic Coulomb potential, ranging from −10 kcal⋅mol−1 (red) to +10 kcal⋅mol−1 (blue), or as a ribbon in the color of the respective subunit.
A detailed inspection of the other interfaces revealed additional small but important differences within the plug region and the JAS-binding site of PfAct1 that probably affect the stability of the filament. The plug region is the major interstrand contact in F-actin and relies on electrostatic complementary surface potentials (5, 7). The general arrangement of the plug and the interaction with the adjacent actin subunit are conserved in JAS-stabilized PfAct1 filaments (Fig. 4 and Fig. S4 A and B). The interaction is weaker, however, in PfAct1 because a substitution of M269 in canonical F-actin by K270 in PfAct1 results in an inversion of the electrostatic potential and, consequently, repulsion at this site and weakening of the interaction (Fig. 4 A, B, D, and E). Although the double-point mutation G200S/K270M for PfAct1 did not result in long filaments in the absence of any stabilizing agent (19), previous studies on actin from T. gondii demonstrated that a point mutation of K270 to methionine increased the stability of filaments in the presence of a low amount of phalloidin (9). This indicates that this site is indeed important for filament stability. However, its optimization alone is not sufficient to compensate for the instability induced by weaker interactions at other sites.
Fig. 4.

Weaker interaction of the plug in PfAct1. Comparison of the plug region of PfAct1 (A–C) and α-actin (D–F) [PDB accession code 5JLF (32)]. (D–F) Electrostatic interactions involving R39, H40, and M269 stabilize the interstrand contact of α-actin. (A–C) Substitution of these residues to lysine, asparagine, and lysine, respectively, weakens this interface in PfAct1. Actin is depicted as surface colored by electrostatic Coulomb potential ranging from −10 kcal⋅mol−1 (red) to +10 kcal⋅mol−1 (blue) or as a ribbon in the color of the respective subunit.
At the position of amino acids R39 and H40 in the plug region of canonical F-actins, there is a lysine and an asparagine in PfAct1, respectively. Since lysine is less bulky than arginine, this results in an opening of the groove, in which glutamate E271 from the opposing subunit enters, weakening the key-and-lock interaction (Fig. 4 A, C, D, and F). Asparagine, instead of histidine, deteriorates the electrostatic interactions at this site. Both residues are located at the base of the D-loop, indicating that not only weaknesses at the tip of the D-loop but also those at its lower part can account for filament instability. This also explains the relatively strong stabilizing effect of the above-mentioned D-loop mutant, in which the complete D-loop of PfAct1 was exchanged for that of canonical actin (19).
We found two additional interfaces that are probably destabilized in PfAct1 filaments compared with canonical F-actin (Figs. 5 and 6). In canonical F-actin, a hydrophobic key-and-lock interaction of I287 located in SD3 with a shape-complementary groove in SD4 strengthens the intrastrand contact (Fig. 5A). In PfAct1, this isoleucine is replaced by valine, which is still hydrophobic but less bulky. Consequently, it does not match the shape of the groove and is a greater distance away from the hydrophobic interface (Fig. 5B). By binding to both interstrand subunits, JAS reinforces the interaction that is weakened in PfAct1, explaining its stabilizing effect (Fig. 5C).
Fig. 5.

Destabilized intrastrand contact near JAS-binding site in PfAct1. (A) In α-actin, I287 insets into a groove of the adjacent intrastrand subunit resembling a lock-and-key interaction. (B) In PfAct1, isoleucine is replaced by valine, resulting in a weaker intrastrand interaction. (C) JAS (gray) binds close to this intrastrand contact, reinforcing the interface. Surfaces are colored from high (yellow) to low (white) hydrophobicity. Dashed lines indicate boundaries of actin subunits.
Fig. 6.

Destabilized interstrand contact near JAS-binding site in PfAct1. (A) Interstrand contact of α-actin is mediated by the hydrophobic residues V201 and T194 (Fig. 5A). (B) Hydrophobicity is reduced in PfAct1 due to substitutions to serine and histidine, respectively, resulting in a destabilized interface (Fig. 5B). (C) JAS (gray) binds at this interface and strengthens the interstrand contact. Surfaces are colored from high (yellow) to low (white) hydrophobicity, and ribbons are depicted in the color of the respective subunit.
A prominent hydrophobic patch on SD4 spans the inward-directed surface of canonical F-actin and interacts with a hydrophobic region on SD1 of the opposing interstrand subunit (Figs. 5A and 6A). While the opposing surface is the same in PfAct1, the surface of SD4 is less hydrophobic. This is mainly due to a substitution of T194 and V201 by histidine and serine, respectively. In addition, S199 is replaced by a glycine (G200) that is less bulky, and thus reduces the surface available for the interaction as well as consequently weakening the interaction at this site (Figs. 5B and 6B). Supporting this observation, phalloidin-stabilized F-actin from T. gondii could be further stabilized by replacing G200 by serine (9). In PfAct1, however, the double-point mutation G200S/K270M did not result in stable filaments (19), indicating that stabilizing the filament only at one position cannot compensate for the instabilities in other regions as discussed above. Interestingly, JAS binds exactly at the interface between SD1 and SD4 (Fig. 6C). Since it is hydrophobic itself, it most likely compensates for the loss of hydrophobicity at this interface, and thereby stabilizes the interstrand contact.
To support our structural observations, we performed an in silico analysis of the energy landscape at the binding interfaces. The contribution of a certain side chain to an interaction can be evaluated by calculating the free energy change, ΔΔG, arising from a mutation to alanine. We used Robetta to calculate an in silico alanine scan (40, 41) for PfAct1 and α-actin (Fig. S11). As expected from the comparison of the structures, the energy change at the plug interface is more prominent for α-actin (Fig. S11D), indicating a stronger interaction than in PfAct1 (Fig. S11A). The hydrophobic key-and-lock interaction near the JAS-binding site (Fig. 5 and Fig. S5) is also weaker for PfAct1 (Fig. S11 B and E), whereas the D-loop interface of PfAct1 resembles the one of α-actin (Fig. S11 C and F).
Fig. S11.

Change of free energy, ΔΔG, at important interfaces due to in silico alanine mutations. Comparison of ΔΔG of PfAct1 (A–C) and α-actin (D–F) [PDB accession code 5JLF (32)]. The interactions at the plug region as well as at the intrastrand contact near the JAS-binding site are weaker in PfAct1 (A and B) than in α-actin (D and E). The D-loop interface of PfAct1 (C) closely resembles the one of α-actin (F). Ribbons are depicted transparently in the color of the respective subunit. (G) Table summarizing the change of ΔΔG in kcal⋅mol−1. Residues are grouped by interface. Side chains are colored by ΔΔG, ranging from 0 kcal⋅mol−1 (white), to 2 kcal⋅mol−1 (red), to +3.8 kcal⋅mol−1 (wine red). Positive values correspond to an increase in free energy, and negative values arise from repelling interactions.
Concluding Remarks
The overall structure of PfAct1 filaments is very similar to that of canonical F-actin. However, several small but important differences at the intra- and interstrand interfaces can be pinpointed as being associated with the inherent filament instability (Table S1). This also highlights the high sensitivity of F-actin to small alterations at important interfaces. JAS not only directly compensates for these weak spots but also stabilizes the filament in general by mediating additional inter- and intrastrand contacts. Our findings deepen our understanding of actin filaments in general and lay the structural foundation for further biochemical studies evaluating the impact of specific residues. It is hoped that this will expand the current model of motility and host cell invasion by Plasmodium and apicomplexan parasites in general. It is likely that PfAct1 filaments are stabilized in vivo by other proteins. A temporally regulated stabilization of filaments by, for example, coronin, glideosome-associated connector (42), or myosin could lead to longer filaments when required during the parasite life cycle. Thus, further work is needed to elucidate the exact binding modes of these F-actin–binding proteins on parasite actin filaments.
Table S1.
Residues weakening the filament stability of PfAct1
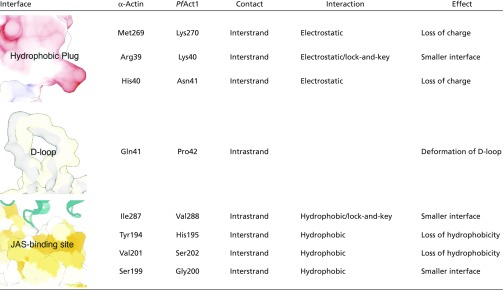 |
Residues are grouped by interface and compared with their respective analog in α-actin.
Importantly, our structure of a small molecule bound to F-actin also highlights the potential of cryo-EM for structure-based drug design directed to F-actin. Studying small molecules in complex with F-actin at atomic resolution is of particular interest. The high similarity of actins from different species requires the exact tailoring of drugs to avoid nonspecific binding. PfAct1 itself could be considered a possible target, taking into account the importance of gliding motility for the life cycle of Plasmodium.
Materials and Methods
Details are provided in SI Materials and Methods.
PfAct1 Expression, Purification, and Polymerization.
PfAct1 was expressed and purified essentially as described previously (19) and polymerized for 16 h at 20 °C by adding F-buffer components to a final composition of 10 mM Hepes (pH 7.5), 0.2 mM CaCl2, 50 mM KCl, 4 mM MgCl2, 5 mM DTT, and 0.5 mM ATP. In JAS-stabilized samples, JAS (Sigma) was included at a 1:1 molar ratio to actin during polymerization.
Grid Preparation and Image Acquisition for JAS-Stabilized PfAct1.
An initial sample check and empirical adjustment of the protein concentration were performed using a standard negative staining protocol described previously (7). For cryosample preparation, the protein sample was first incubated on a previously glow-discharged carbon grid (C-Flats 2/1; Protochips), manually blotted, and finally plunged into liquid ethane for vitrification using a cryoplunger Cp3 (Gatan). Following sample optimization, the final dataset was collected on an FEI Titan Krios transmission electron microscope corrected for spherical aberration (Cs) and equipped with a Falcon2 direct detector (FEI) and an XFEG (FEI) operated at 300 kV.
Image Processing.
Images were manually inspected and drift-corrected using Unblur and Summovie (43). Selection of particles was performed manually with sxhelixboxer in SPARX (44), and CTFFIND4 (45) was used for contrast transfer function (CTF) estimation. An initial 3D reference was created from a homology model of PfAct1 (discussed below) using CHIMERA (46) and SPARX. The refinement and postprocessing were performed with RELION 1.4 (47) in combination with additional restraints to account for the filament character.
Model Building and Refinement.
A homology model of filamentous PfAct1 was created using Modeler (48) with canonical F-actin [PDB ID code 5JLF (32)] as a reference structure. This model was flexibly fitted using iModFit (49) before it was refined in real space using PHENIX (50). Further refinement was performed manually using Coot (51) to minimize model bias. An initial model of JAS was generated using Grade.globalphasing (52) and manually refined in Coot. The final refinement and validation were performed using REFMAC (53). The data statistics are summarized in Table S2.
Table S2.
Data collection and refinement statistics
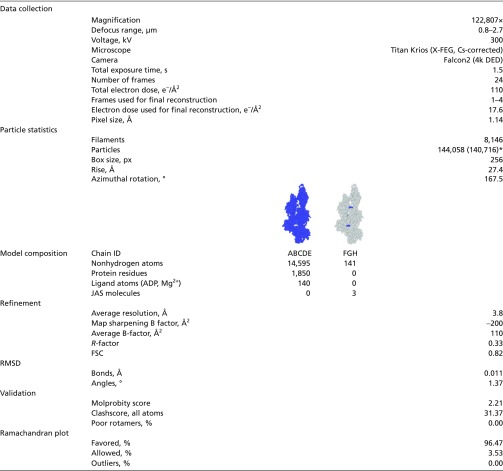 |
Refinement statistics are given after the last step of refinement. Helical symmetry parameters were estimated after C1 refinement (SI Materials and Methods).
Number in parentheses is the count after discarding outliers (SI Materials and Methods).
SI Materials and Methods
PfAct1 Expression, Purification, and Polymerization.
PfAct1 was expressed and purified essentially as described previously (19) and polymerized for 16 h at 20 °C by adding F-buffer components to a final composition of 10 mM Hepes (pH 7.5), 0.2 mM CaCl2, 50 mM KCl, 4 mM MgCl2, 5 mM DTT, and 0.5 mM ATP. In JAS-stabilized samples, JAS (Sigma) was included at a 1:1 molar ratio to actin during polymerization.
Grid Preparation and Screening of Nonstabilized PfAct1.
A freshly polymerized, nonstabilized PfAct1 sample of 1.5 μL was applied to a previously glow-discharged carbon grid (Holey carbon film R2/1; Quantifoil). After 30 s of incubation, the grid was manually blotted from the backside using filter paper (Whatman no. 5) for 6–8 s, before plunging it into liquid ethane for vitrification using a cryoplunger Cp3 (Gatan). Grids were screened using a Tecnai G Spirit electron microscope (FEI) operated at 120 kV and equipped with a TVIPS TemCam F416 detector and a single-tilt cryotransfer holder 626 (Gatan).
Grid Preparation and Image Acquisition for JAS-Stabilized PfAct1.
An initial sample check and empirical adjustment of the protein concentration were performed using a standard negative staining protocol described before (7). For cryosample preparation, a protein sample of 2 μL containing 0.04% Tween 20 was incubated for 30 s on a previously glow-discharged carbon grid (C-Flats 2/1; Protochips). After manual blotting from the backside using filter paper (Whatman no. 5) for 4 s, the grid was plunged into liquid ethane for vitrification using a cryoplunger Cp3 (Gatan) at 97% humidity. Prescreening and cryosample optimization were performed on a JEOL JEM 3200FSC electron microscope operated at 300 kV and equipped with a field emission gun and an omega in-column energy filter. The final dataset was collected on a Cs-corrected FEI Titan Krios transmission electron microscope equipped with an XFEG (FEI) at 300 kV. Images were recorded on a Falcon2 direct detector (FEI) using the automated data collection software EPU (FEI) at a pixel size of 1.14 Å. Four images were acquired per grid hole, each consisting of 24 frames with a total dose and exposure time of 110 e−/Å2 and 1.5 s, respectively. The defocus value was varied within a range of 0.8 to 2.7 μm (Table S2).
Image Processing.
Unaligned frame averages of all 3,870 collected images were manually inspected and judged in terms of ice and protein quality, drift, and resolution. Only the best 1,634 images were motion-corrected and summed using Unblur and Summovie (43). To reduce the effect of radiation damage, sums of dose-weighted frames and unweighted sums with a total dose of 27 e−/Å2 (frames 1–6) and 18 e−/Å2 (frames 1–4) were also created. CTF estimation was performed using CTFFIND4 (45) on unweighted full-dose sums. Filaments were manually selected with sxhelixboxer in SPARX (44) and split into segments with a box size of 256 pixels (px) and a boxing distance of 37 px (85% overlap). Filaments that contained less than six segments were discarded, resulting in a total of 144,058 segments, each containing 1.5 unique asymmetric subunits.
An initial reference for the 3D refinement was generated using CHIMERA (46) by fitting a homology model of PfAct1 (discussed below) into an electron density map of JAS-stabilized PfAct1 at a resolution of 7 Å, which was obtained from prescreening data processed with SPARX as previously described (7). An electron density map was created from the model and filtered to 20 Å resolution using SPARX. The first refinement was performed on dose-weighted, binned particles (pixel size = 1.52 Å, box size = 192 px) using 3D auto-refinement in RELION 1.4 (47), starting with an angular sampling angle of 3.7° and limiting the tilt angle to (90 ± 1)° by using the additional option: –limit_tilt 89. This restriction dramatically speeds up the initial refinement and accounts for the relative tilt of the filaments on the grid, which is 90° in the case of an ice layer as thin as the filament diameter. Within a consecutive local auto-refinement, the angular sampling angle was reduced to 0.9° while the tilt constraint was removed. These settings, in combination with a reference from the previous run filtered to 7 Å, ensure a relaxation of the tilt angle around the equator, resulting in a distribution that represents the expected orientation of filaments within a thin ice layer (smooth Gaussian distribution around a tilt angle of 90°).
Up to this point, the sample was treated as an elongated single particle; thus, the helical symmetry was not exploited. To further increase the resolution, mean values of the in-plane rotation angle (psi) and tilt angle (theta) were calculated per subfilament spanning 15 subunits. Both parameters should not significantly deviate within a filament, taking into account the geometric restrictions imposed by the helical symmetry. Hence, mean values were set as prior values per subfilament, while outlier segments and filaments were discarded, resulting in a subdataset containing 140,716 particles. For the subsequent local 3D refinement, particles were replaced by unbinned particles (pixel size = 1.14 Å, box size = 256 px) with a total dose of 27 e−/Å2 and relevant refinement parameters rescaled accordingly. The local refinement used the rescaled former map filtered to 5.5 Å as a reference and an angular sampling angle of 0.9° as well as the additional options: –sigma_tilt 1 and –sigma_psi 1. Finally, the last iteration of this refinement was repeated replacing all particles by the ones with a total dose of 18 e−/Å2, yielding the highest resolution and a smooth Gaussian distribution of projection angles (Fig. S2B).
As the edges of the filament tend to negatively influence projection matching, a smooth mask created from the filament density in combination with a sphere with a radius of ∼45% of the box size was used during all refinement steps. Furthermore, all refinements were performed without application of any symmetry.
Postprocessing in RELION 1.4, using a mask containing the complete filament, resulted in an average resolution of 3.84 Å in accordance with the Fourier shell correlation 0.143 (FSC0.143) criterion. The local resolution was evaluated using sxlocres, implemented in SPHIRE (54). Although there is an obvious resolution gradient within the filament (Fig. S2D), using a smooth mask, containing only a central fraction of the filament during postprocessing, did not improve the nominal resolution but introduced artifacts visible in the FSC curve.
Model Building and Refinement.
A sequence alignment of PfAct1 and α-actin from Oryctolagus cuniculus was performed using Clustal Omega (55). Subsequently, a homology model of filamentous PfAct1 was created using Modeler (48) with canonical F-actin [PDB ID code 5JLF (32)] as a reference structure. The achieved model was flexibly fitted into the electron density of the central actin subunit using iModFit (49). On that basis, a model consisting of the central five actin subunits (referred to as a pentamer, chains A–E) was created using CHIMERA (46). Initial real-space refinement was conducted with PHENIX.real_space_refine (50) applying noncrystallographic symmetry (NCS) and secondary structure restraints based on the crystal structure of globular PfAct1 [PDB ID code 4CBU (19)]. Further refinement was performed manually using Coot (51) to minimize model bias. Model building of the N and C termini was only partially possible due to flexibility and limited resolution; hence, the model only contains residues 8–377. The D-loop was refined into a density sum of two subunits that had the most details in this region. Nevertheless, the placement of most side chains was not feasible; thus, only the backbone of the corresponding residues was refined, and the side chains were placed in the most likely orientation.
An initial model and constraint file for JAS (chemical abstracts service no. 102396-24-7) was generated using Grade.globalphasing (52), inputting the simplified molecular input line entry specification (SMILES) provided by the ZINC database (56). Afterward, the model was rigid-body-fitted into the corresponding density of the central JAS molecule and merged with the pentameric actin model using CHIMERA. A preliminary manual refinement of JAS was performed in Coot in accordance with the previously created constraints. Finally, the refined JAS model was rigid-body-fitted into the density of the central three JAS molecules (chains F–H) using CHIMERA. A comparison of the electron density map with the previous structure of F-actin in the ADP state gave clear evidence of the presence of ADP in the current structure (Fig. S3). ADP (PDB ID code 5JLF) was thus transferred and fitted into the pentameric model of PfAct1 with the help of CHIMERA. To fix introduced clashes, the merged model was refined in real space using PHENIX under the application of protein and ligand restraints.
The final refinement and validation were performed using REFMAC (53). Besides NCS and ligand restraints, additional chain, helix, and sheet restraints generated with PROSMART (57) were applied. Refinement settings were iteratively optimized by displacing all atoms randomly by 0.5 Å to avoid overrefinement. The optimal settings yielded a high agreement of the FSC of the model with both half-maps, while only one-half was used for the refinement. Finally, the model without atom displacement was refined into the postprocessed density map using the previously optimized settings. As the resolution of the central density was superior, the corresponding JAS model was rigid-body-fitted into the two adjacent densities using CHIMERA. MOLPROBITY (58) was used for model evaluation and analysis. The data statistics are summarized in Table S2.
Structure Analysis and Visualization.
Only the central JAS and three actin subunits were used for the visualization of models and density maps in CHIMERA, as they include all important contact sites. Map sharpening was optimized for visualization purposes. For all surface representations, a model protonated with H++ (59) at pH 7.5 was displayed. Electrostatic surface potentials ranging from −10 kcal⋅mol−1 to +10 kcal⋅mol−1 were calculated with CHIMERA. Protein surfaces were colored by hydrophobicity using “define attribute” inputting amino acid-specific scores (60). The hydrophobicity of JAS was evaluated with the help of PLATINUM (61), which exploits the concept of molecular hydrophobicity potential.
For the analysis of the G-actin to F-actin transition, hinge regions and global rotation angles were detected using DynDom (62), and a model of globular PfAct1 [PDB ID code 4CBU (19)], canonical G-actin [PDB ID code 1J6Z (63)], or canonical F-actin (PDB ID code 3J8A (7)] was directly compared with the central subunit of filamentous PfAct1.
Determination of Helical Symmetry Parameters.
CHIMERA was used to overlay the atomic model of interest with an F-actin model from fiber diffraction data [PDB ID code 2ZWH (6)] to align it precisely with the symmetry axis. The option “match ShowMatrix” was used afterward to superimpose different chains within the model. The outputted shift and rotation angle was directly converted into the corresponding value for the helical rise and twist according to the relative distance of subunits. All unique matches of the central five subunits were considered when calculating an average helical rise and twist as well as an error of the mean.
Conservation of the Hydrophobic JAS-Binding Site in F-Actin.
Sequences of actins from a broad range of eukaryotes were aligned using Clustal Omega (55). This alignment included actin from apicomplexan parasites [Plasmodium falciparum (P86287), Plasmodium berghei (Q4YU79), and Toxoplasma gondii (P53476)]; from vertebrates [Oryctolagus cuniculus (P68135), Homo sapiens (P68133), and Gallus gallus (P68139)]; from insects [Drosophila melanogaster (P83967)]; from amoeba [Hartmannella cantabrigiensis (Q6WE48)]; from fungi [Saccharomyces cerevisiae (P60010)]; from algae [Chlamydomonas reinhardtii (P53498)]; and from plants [Arabidopsis thaliana (P0CJ46)] [the corresponding UniProt ID (64) is stated in parentheses]. The surface of PfAct1 was colored by conservation using the option “render by attribute” in CHIMERA.
In Silico Analysis of the Energy Landscape at Binding Interfaces.
An alanine screening of PfAct1 and α-actin [PDB ID code 5JLF (32)] was performed using Robetta (40, 41). To simulate the binding of the central chain (A), this chain was selected as partner 1, while the other chains (BCDE) were accounted as partner 2. The calculated change of free energy, ΔΔG, was transferred to the occupancy column in the PDB file to enable easy visualization in CHIMERA. Side chains were colored using the option “render by attribute.” As the screening focused on chain A, only this chain was used for figure preparation.
Supplementary Material
Acknowledgments
We thank O. Hofnagel for his valuable assistance in electron microscopy and F. Merino for the lively exchange regarding image processing. S.P. and J.v.d.E. are fellows of Studienstiftung des deutschen Volkes. This work was supported by the Max Planck Society (S.R.); the European Council under the European Union’s Seventh Framework Programme (FP7/2007–2013) (Grant 615984 to S.R.); the Academy of Finland (Grants 257537, 265112, and 292718 to I.K.); and the Emil Aaltonen, Sigrid Jusélius, and Jane and Aatos Erkko Foundations (I.K.).
Footnotes
The authors declare no conflict of interest.
This article is a PNAS Direct Submission.
Data deposition: The electron density map after postprocessing has been deposited in the Electron Microscopy Data Bank (EMDB accession code 3805). The final model containing five actin subunits and three jasplakinolide molecules was submitted to the Protein Data Bank, www.pdb.org (PDB ID code 5OGW).
This article contains supporting information online at www.pnas.org/lookup/suppl/doi:10.1073/pnas.1707506114/-/DCSupplemental.
References
- 1.Pollard TD. Actin and actin-binding proteins. Cold Spring Harb Perspect Biol. 2016 doi: 10.1101/cshperspect.a018226. [DOI] [PMC free article] [PubMed] [Google Scholar]
- 2.Straub FB. Actin. Stud Inst Med Chem Univ Szeged. 1942;II:3–15. [Google Scholar]
- 3.Kabsch W, Mannherz HG, Suck D, Pai EF, Holmes KC. Atomic structure of the actin: DNase I complex. Nature. 1990;347:37–44. doi: 10.1038/347037a0. [DOI] [PubMed] [Google Scholar]
- 4.Holmes KC, Popp D, Gebhard W, Kabsch W. Atomic model of the actin filament. Nature. 1990;347:44–49. doi: 10.1038/347044a0. [DOI] [PubMed] [Google Scholar]
- 5.Fujii T, Iwane AH, Yanagida T, Namba K. Direct visualization of secondary structures of F-actin by electron cryomicroscopy. Nature. 2010;467:724–728. doi: 10.1038/nature09372. [DOI] [PubMed] [Google Scholar]
- 6.Oda T, Iwasa M, Aihara T, Maéda Y, Narita A. The nature of the globular- to fibrous-actin transition. Nature. 2009;457:441–445. doi: 10.1038/nature07685. [DOI] [PubMed] [Google Scholar]
- 7.von der Ecken J, et al. Structure of the F-actin-tropomyosin complex. Nature. 2015;519:114–117. doi: 10.1038/nature14033. [DOI] [PMC free article] [PubMed] [Google Scholar]
- 8.Galkin VE, Orlova A, Vos MR, Schröder GF, Egelman EH. Near-atomic resolution for one state of F-actin. Structure. 2015;23:173–182. doi: 10.1016/j.str.2014.11.006. [DOI] [PMC free article] [PubMed] [Google Scholar]
- 9.Skillman KM, et al. Evolutionarily divergent, unstable filamentous actin is essential for gliding motility in apicomplexan parasites. PLoS Pathog. 2011;7:e1002280. doi: 10.1371/journal.ppat.1002280. [DOI] [PMC free article] [PubMed] [Google Scholar]
- 10.Drewry LL, Sibley LD. Toxoplasma actin is required for efficient host cell invasion. MBio. 2015;6:e00557. doi: 10.1128/mBio.00557-15. [DOI] [PMC free article] [PubMed] [Google Scholar]
- 11.Heintzelman MB. Gliding motility in apicomplexan parasites. Semin Cell Dev Biol. 2015;46:135–142. doi: 10.1016/j.semcdb.2015.09.020. [DOI] [PubMed] [Google Scholar]
- 12.Kumpula E-P, Kursula I. Towards a molecular understanding of the apicomplexan actin motor: On a road to novel targets for malaria remedies? Acta Crystallogr F Struct Biol Commun. 2015;71:500–513. doi: 10.1107/S2053230X1500391X. [DOI] [PMC free article] [PubMed] [Google Scholar]
- 13.Wesseling JG, de Ree JM, Ponnudurai T, Smits MA, Schoenmakers JG. Nucleotide sequence and deduced amino acid sequence of a Plasmodium falciparum actin gene. Mol Biochem Parasitol. 1988;27:313–320. doi: 10.1016/0166-6851(88)90051-5. [DOI] [PubMed] [Google Scholar]
- 14.Wesseling JG, Smits MA, Schoenmakers JG. Extremely diverged actin proteins in Plasmodium falciparum. Mol Biochem Parasitol. 1988;30:143–153. doi: 10.1016/0166-6851(88)90107-7. [DOI] [PubMed] [Google Scholar]
- 15.Wesseling JG, et al. Stage-specific expression and genomic organization of the actin genes of the malaria parasite Plasmodium falciparum. Mol Biochem Parasitol. 1989;35:167–176. doi: 10.1016/0166-6851(89)90119-9. [DOI] [PubMed] [Google Scholar]
- 16.Dobrowolski JM, Niesman IR, Sibley LD. Actin in the parasite Toxoplasma gondii is encoded by a single copy gene, ACT1 and exists primarily in a globular form. Cell Motil Cytoskeleton. 1997;37:253–262. doi: 10.1002/(SICI)1097-0169(1997)37:3<253::AID-CM7>3.0.CO;2-7. [DOI] [PubMed] [Google Scholar]
- 17.Deligianni E, et al. Critical role for a stage-specific actin in male exflagellation of the malaria parasite. Cell Microbiol. 2011;13:1714–1730. doi: 10.1111/j.1462-5822.2011.01652.x. [DOI] [PubMed] [Google Scholar]
- 18.Andreadaki M, et al. Genetic crosses and complementation reveal essential functions for the Plasmodium stage-specific actin2 in sporogonic development. Cell Microbiol. 2014;16:751–767. doi: 10.1111/cmi.12274. [DOI] [PubMed] [Google Scholar]
- 19.Vahokoski J, et al. Structural differences explain diverse functions of Plasmodium actins. PLoS Pathog. 2014;10:e1004091. doi: 10.1371/journal.ppat.1004091. [DOI] [PMC free article] [PubMed] [Google Scholar]
- 20.Hliscs M, et al. Organization and function of an actin cytoskeleton in Plasmodium falciparum gametocytes. Cell Microbiol. 2015;17:207–225. doi: 10.1111/cmi.12359. [DOI] [PubMed] [Google Scholar]
- 21.Webb SE, et al. Contractile protein system in the asexual stages of the malaria parasite Plasmodium falciparum. Parasitology. 1996;112:451–457. doi: 10.1017/s0031182000076915. [DOI] [PubMed] [Google Scholar]
- 22.Kudryashev M, Lepper S, Baumeister W, Cyrklaff M, Frischknecht F. Geometric constrains for detecting short actin filaments by cryogenic electron tomography. PMC Biophys. 2010;3:6. doi: 10.1186/1757-5036-3-6. [DOI] [PMC free article] [PubMed] [Google Scholar]
- 23.Sidén-Kiamos I, Louis C, Matuschewski K. Evidence for filamentous actin in ookinetes of a malarial parasite. Mol Biochem Parasitol. 2012;181:186–189. doi: 10.1016/j.molbiopara.2011.11.002. [DOI] [PubMed] [Google Scholar]
- 24.Angrisano F, et al. A GFP-actin reporter line to explore microfilament dynamics across the malaria parasite lifecycle. Mol Biochem Parasitol. 2012;182:93–96. doi: 10.1016/j.molbiopara.2011.11.008. [DOI] [PubMed] [Google Scholar]
- 25.Angrisano F, et al. Spatial localisation of actin filaments across developmental stages of the malaria parasite. PLoS One. 2012;7:e32188. doi: 10.1371/journal.pone.0032188. [DOI] [PMC free article] [PubMed] [Google Scholar]
- 26.Mizuno Y, et al. Effect of jasplakinolide on the growth, invasion, and actin cytoskeleton of Plasmodium falciparum. Parasitol Res. 2002;88:844–848. doi: 10.1007/s00436-002-0666-8. [DOI] [PubMed] [Google Scholar]
- 27.Schmitz S, et al. Malaria parasite actin filaments are very short. J Mol Biol. 2005;349:113–125. doi: 10.1016/j.jmb.2005.03.056. [DOI] [PubMed] [Google Scholar]
- 28.Bubb MR, Senderowicz AM, Sausville EA, Duncan KL, Korn ED. Jasplakinolide, a cytotoxic natural product, induces actin polymerization and competitively inhibits the binding of phalloidin to F-actin. J Biol Chem. 1994;269:14869–14871. [PubMed] [Google Scholar]
- 29.Crews P, Manes LV, Boehler M. Jasplakinolide, a cyclodepsipeptide from the marine sponge, Jaspis SP. Tetrahedron Lett. 1986;27:2797–2800. [Google Scholar]
- 30.Schmitz S, et al. Malaria parasite actin polymerization and filament structure. J Biol Chem. 2010;285:36577–36585. doi: 10.1074/jbc.M110.142638. [DOI] [PMC free article] [PubMed] [Google Scholar]
- 31.Bubb MR, Spector I, Beyer BB, Fosen KM. Effects of jasplakinolide on the kinetics of actin polymerization. An explanation for certain in vivo observations. J Biol Chem. 2000;275:5163–5170. doi: 10.1074/jbc.275.7.5163. [DOI] [PubMed] [Google Scholar]
- 32.von der Ecken J, Heissler SM, Pathan-Chhatbar S, Manstein DJ, Raunser S. Cryo-EM structure of a human cytoplasmic actomyosin complex at near-atomic resolution. Nature. 2016;534:724–728. doi: 10.1038/nature18295. [DOI] [PubMed] [Google Scholar]
- 33.Löwe J, He S, Scheres SHW, Savva CG. X-ray and cryo-EM structures of monomeric and filamentous actin-like protein MamK reveal changes associated with polymerization. Proc Natl Acad Sci USA. 2016;113:13396–13401. doi: 10.1073/pnas.1612034113. [DOI] [PMC free article] [PubMed] [Google Scholar]
- 34.Tannert R, et al. Synthesis and structure-activity correlation of natural-product inspired cyclodepsipeptides stabilizing F-actin. J Am Chem Soc. 2010;132:3063–3077. doi: 10.1021/ja9095126. [DOI] [PubMed] [Google Scholar]
- 35.Zabriskie TM, et al. Jaspamide, a modified peptide from a Jaspis sponge, with insecticidal and antifungal activity. J Am Chem Soc. 1986;108:3123–3124. [Google Scholar]
- 36.Visegrády B, Lorinczy D, Hild G, Somogyi B, Nyitrai M. The effect of phalloidin and jasplakinolide on the flexibility and thermal stability of actin filaments. FEBS Lett. 2004;565:163–166. doi: 10.1016/j.febslet.2004.03.096. [DOI] [PubMed] [Google Scholar]
- 37.Vig A, et al. The effect of toxins on inorganic phosphate release during actin polymerization. Eur Biophys J. 2011;40:619–626. doi: 10.1007/s00249-010-0659-y. [DOI] [PubMed] [Google Scholar]
- 38.Ge P, Durer ZAO, Kudryashov D, Zhou ZH, Reisler E. Cryo-EM reveals different coronin binding modes for ADP- and ADP-BeFx actin filaments. Nat Struct Mol Biol. 2014;21:1075–1081. doi: 10.1038/nsmb.2907. [DOI] [PMC free article] [PubMed] [Google Scholar]
- 39.Fujii T, Namba K. Structure of actomyosin rigour complex at 5.2 Å resolution and insights into the ATPase cycle mechanism. Nat Commun. 2017;8:13969. doi: 10.1038/ncomms13969. [DOI] [PMC free article] [PubMed] [Google Scholar]
- 40.Kortemme T, Baker D. A simple physical model for binding energy hot spots in protein-protein complexes. Proc Natl Acad Sci USA. 2002;99:14116–14121. doi: 10.1073/pnas.202485799. [DOI] [PMC free article] [PubMed] [Google Scholar]
- 41.Kortemme T, Kim DE, Baker D. Computational alanine scanning of protein-protein interfaces. Sci STKE. 2004;2004:pl2. doi: 10.1126/stke.2192004pl2. [DOI] [PubMed] [Google Scholar]
- 42.Jacot D, et al. An apicomplexan actin-binding protein serves as a connector and lipid sensor to coordinate motility and invasion. Cell Host Microbe. 2016;20:731–743. doi: 10.1016/j.chom.2016.10.020. [DOI] [PubMed] [Google Scholar]
- 43.Grant T, Grigorieff N. Measuring the optimal exposure for single particle cryo-EM using a 2.6 Å reconstruction of rotavirus VP6. Elife. 2015;4:e06980. doi: 10.7554/eLife.06980. [DOI] [PMC free article] [PubMed] [Google Scholar]
- 44.Hohn M, et al. SPARX, a new environment for Cryo-EM image processing. J Struct Biol. 2007;157:47–55. doi: 10.1016/j.jsb.2006.07.003. [DOI] [PubMed] [Google Scholar]
- 45.Rohou A, Grigorieff N. CTFFIND4: Fast and accurate defocus estimation from electron micrographs. J Struct Biol. 2015;192:216–221. doi: 10.1016/j.jsb.2015.08.008. [DOI] [PMC free article] [PubMed] [Google Scholar]
- 46.Pettersen EF, et al. UCSF Chimera–A visualization system for exploratory research and analysis. J Comput Chem. 2004;25:1605–1612. doi: 10.1002/jcc.20084. [DOI] [PubMed] [Google Scholar]
- 47.Scheres SHW. RELION: Implementation of a Bayesian approach to cryo-EM structure determination. J Struct Biol. 2012;180:519–530. doi: 10.1016/j.jsb.2012.09.006. [DOI] [PMC free article] [PubMed] [Google Scholar]
- 48.Sali A, Blundell TL. Comparative protein modelling by satisfaction of spatial restraints. J Mol Biol. 1993;234:779–815. doi: 10.1006/jmbi.1993.1626. [DOI] [PubMed] [Google Scholar]
- 49.Lopéz-Blanco JR, Chacón P. iMODFIT: Efficient and robust flexible fitting based on vibrational analysis in internal coordinates. J Struct Biol. 2013;184:261–270. doi: 10.1016/j.jsb.2013.08.010. [DOI] [PubMed] [Google Scholar]
- 50.Adams PD, et al. The Phenix software for automated determination of macromolecular structures. Methods. 2011;55:94–106. doi: 10.1016/j.ymeth.2011.07.005. [DOI] [PMC free article] [PubMed] [Google Scholar]
- 51.Emsley P, Lohkamp B, Scott WG, Cowtan K. Features and development of Coot. Acta Crystallogr D Biol Crystallogr. 2010;66:486–501. doi: 10.1107/S0907444910007493. [DOI] [PMC free article] [PubMed] [Google Scholar]
- 52.Smart OS, et al. 2011 Grade Web Server Version v1.103. Available at grade.globalphasing.org and www.globalphasing.com. Accessed July 21, 2016.
- 53.Brown A, et al. Tools for macromolecular model building and refinement into electron cryo-microscopy reconstructions. Acta Crystallogr D Biol Crystallogr. 2015;71:136–153. doi: 10.1107/S1399004714021683. [DOI] [PMC free article] [PubMed] [Google Scholar]
- 54.Moriya T, et al. High-resolution single particle analysis from electron cryo-microscopy images using SPHIRE. J Vis Exp. 2017 doi: 10.3791/55448. [DOI] [PMC free article] [PubMed] [Google Scholar]
- 55.Sievers F, et al. Fast, scalable generation of high-quality protein multiple sequence alignments using Clustal Omega. Mol Syst Biol. 2011;7:539. doi: 10.1038/msb.2011.75. [DOI] [PMC free article] [PubMed] [Google Scholar]
- 56.Irwin JJ, Shoichet BK. ZINC–A free database of commercially available compounds for virtual screening. J Chem Inf Model. 2005;45:177–182. doi: 10.1021/ci049714. [DOI] [PMC free article] [PubMed] [Google Scholar]
- 57.Nicholls RA, Fischer M, McNicholas S, Murshudov GN. Conformation-independent structural comparison of macromolecules with ProSMART. Acta Crystallogr D Biol Crystallogr. 2014;70:2487–2499. doi: 10.1107/S1399004714016241. [DOI] [PMC free article] [PubMed] [Google Scholar]
- 58.Chen VB, et al. MolProbity: All-atom structure validation for macromolecular crystallography. Acta Crystallogr D Biol Crystallogr. 2010;66:12–21. doi: 10.1107/S0907444909042073. [DOI] [PMC free article] [PubMed] [Google Scholar]
- 59.Anandakrishnan R, Aguilar B, Onufriev AV. H++ 3.0: Automating pK prediction and the preparation of biomolecular structures for atomistic molecular modeling and simulations. Nucleic Acids Res. 2012;40:W537–W541. doi: 10.1093/nar/gks375. [DOI] [PMC free article] [PubMed] [Google Scholar]
- 60.Hessa T, et al. Recognition of transmembrane helices by the endoplasmic reticulum translocon. Nature. 2005;433:377–381. doi: 10.1038/nature03216. [DOI] [PubMed] [Google Scholar]
- 61.Pyrkov TV, Chugunov AO, Krylov NA, Nolde DE, Efremov RG. PLATINUM: A web tool for analysis of hydrophobic/hydrophilic organization of biomolecular complexes. Bioinformatics. 2009;25:1201–1202. doi: 10.1093/bioinformatics/btp111. [DOI] [PubMed] [Google Scholar]
- 62.Hayward S, Lee RA. Improvements in the analysis of domain motions in proteins from conformational change: DynDom version 1.50. J Mol Graph Model. 2002;21:181–183. doi: 10.1016/s1093-3263(02)00140-7. [DOI] [PubMed] [Google Scholar]
- 63.Otterbein LR, Graceffa P, Dominguez R. The crystal structure of uncomplexed actin in the ADP state. Science. 2001;293:708–711. doi: 10.1126/science.1059700. [DOI] [PubMed] [Google Scholar]
- 64.The UniProt Consortium UniProt: The universal protein knowledgebase. Nucleic Acids Res. 2017;45:D158–D169. doi: 10.1093/nar/gkw1099. [DOI] [PMC free article] [PubMed] [Google Scholar]
Associated Data
This section collects any data citations, data availability statements, or supplementary materials included in this article.