Significance
Circulating hormones must cross the vascular endothelium to elicit their actions in target tissues via either transcytosis or paracellular diffusion. Insulin receptors on endothelial cells are believed to mediate transcytosis of circulating insulin, but how this affects insulin action in vivo is unknown. Here, we demonstrate that knockout of insulin receptors on endothelial cells delays the kinetics of activation of insulin signaling in skeletal muscle, fat, and several regions of the brain but not in liver or olfactory bulb. This alters the kinetics of insulin action in vivo and induces tissue-specific insulin resistance leading to dysregulated glucose and body weight homeostasis.
Keywords: insulin receptor, endothelial cells, brain insulin action, feeding behavior, insulin resistance
Abstract
Insulin receptors (IRs) on endothelial cells may have a role in the regulation of transport of circulating insulin to its target tissues; however, how this impacts on insulin action in vivo is unclear. Using mice with endothelial-specific inactivation of the IR gene (EndoIRKO), we find that in response to systemic insulin stimulation, loss of endothelial IRs caused delayed onset of insulin signaling in skeletal muscle, brown fat, hypothalamus, hippocampus, and prefrontal cortex but not in liver or olfactory bulb. At the level of the brain, the delay of insulin signaling was associated with decreased levels of hypothalamic proopiomelanocortin, leading to increased food intake and obesity accompanied with hyperinsulinemia and hyperleptinemia. The loss of endothelial IRs also resulted in a delay in the acute hypoglycemic effect of systemic insulin administration and impaired glucose tolerance. In high-fat diet-treated mice, knockout of the endothelial IRs accelerated development of systemic insulin resistance but not food intake and obesity. Thus, IRs on endothelial cells have an important role in transendothelial insulin delivery in vivo which differentially regulates the kinetics of insulin signaling and insulin action in peripheral target tissues and different brain regions. Loss of this function predisposes animals to systemic insulin resistance, overeating, and obesity.
Insulin resistance is central to the pathophysiology of obesity, type 2 diabetes, and metabolic syndrome (1, 2). Insulin resistance can also preferentially affect one or more organs or pathways, including the brain, and has even been identified as a component in the pathogenesis of neurodegenerative disorders, like Alzheimer’s disease (3–5). In all tissues, circulating insulin must cross the endothelium to access target cells. Thus, endothelial barrier function can also influence insulin response. In liver, the endothelial barrier is discontinuous or fenestrated, allowing insulin easy access to hepatocytes (6–8). By contrast, muscle and adipose tissue have a continuous endothelium, which may limit access of insulin (6, 7). In general, the brain has even more limited access of circulating hormones due to the blood–brain barrier (BBB) that is formed by the combined effects of endothelial cells, pericytes, and glial cells, as well as specialized proteins, which form tight junctions between endothelial cells (9). In these tissues with continuous endothelium, paracellular diffusion of insulin is largely limited, leading to the hypothesis of receptor-mediated transcytosis of insulin (10). Indeed, in vitro studies have clearly demonstrated that insulin receptors (IRs) on endothelial cells function for transendothelial insulin transport (10–12). Several in vivo kinetics studies also support a receptor-mediated transendothelial insulin delivery in muscle and brain (13–17). However, an understanding of the full role of IR on endothelial cells on insulin action in vivo is lacking (18, 19).
To address this question, we have created mice with an endothelial cell-specific IR knockout (EndoIRKO). Using these, we demonstrate that IRs on endothelial cells control the kinetics of insulin signaling in target tissues and that the extent of control is differential among tissues, especially those with tight endothelial barriers, such as skeletal muscle, brown fat, and certain regions of the brain, with delayed delivery of insulin. By contrast, in tissues with a lesser endothelial barrier, such as liver and olfactory bulb, loss of IR on endothelial cells does not impede insulin delivery. In addition, we demonstrate that loss of IRs on the endothelial cells has important systemic effects, including to delay the hypoglycemic effect of insulin, impair glucose tolerance, and alter brain satiety signaling resulting in increased food intake and mild obesity. Thus, IRs on endothelium play an important role in fine tuning insulin action in different tissues, and loss of functional IRs on endothelium can predispose animals to developing both central and systemic insulin resistance, as well as components of the metabolic syndrome.
Results
VE-Cadherin-Cre Mediates Efficient Gene Recombination and Blocks Insulin Action in Endothelial Cells.
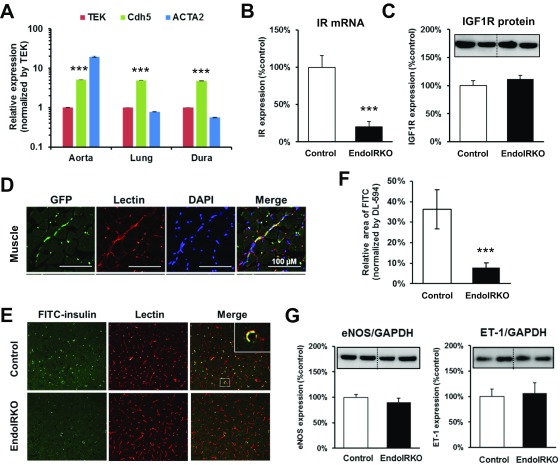
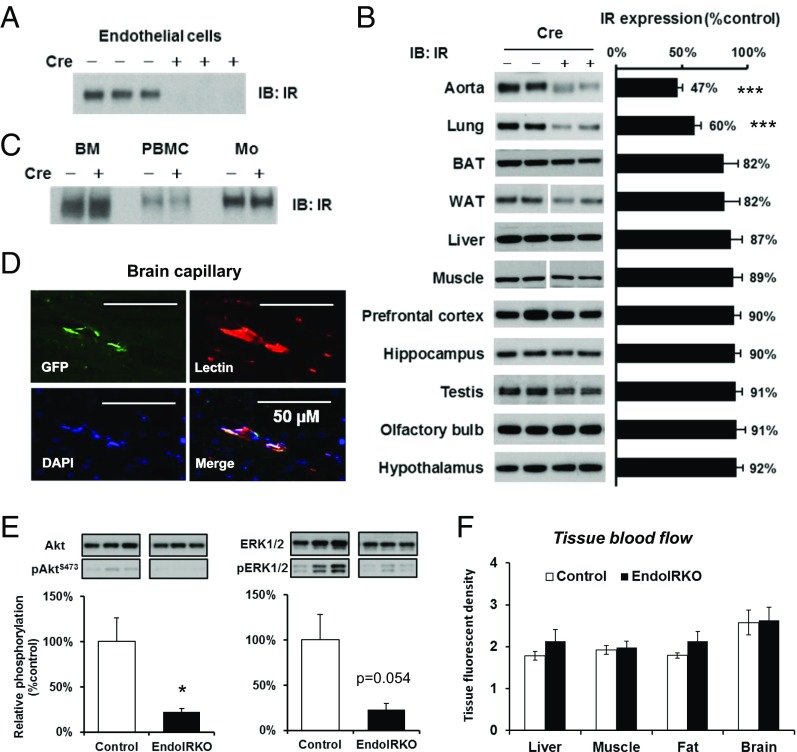
We created mice in which IR was specifically deleted from endothelial cells (EndoIRKO) using Cre-LoxP system. This was driven by the VE-cadherin-Cre transgene because of the high expression of VE-cadherin (Cdh5) in peripheral macrovascular, microvascular, and brain vasculature tissue (Fig. S1A) compared with TEK (Tie-2), which can also be used for gene inactivation in endothelial cells. Indeed, VE-cadherin-Cre was very effective in mediating endothelial recombination as demonstrated by undetectable IR protein in endothelial cells isolated from lung (Fig. 1A). IR mRNA and protein were also decreased by 80% and 53%, respectively, in whole aorta (Fig. 1B and Fig. S1B). IR protein was decreased by 40% in lung, which also has abundant microvasculature, and ∼10% in skeletal muscle (soleus), brown adipose tissue (BAT), perigonadal white adipose tissue, liver, testis, and different brain regions (Fig. 1B), reflecting the lower content of vasculature in these tissues. IR protein was not significantly changed in bone marrow, peripheral blood mononuclear cells, and peritoneal macrophages in EndoIRKO mice (Fig. 1C), sites sometimes involved with off-target recombination with Tie2-Cre.
Fig. S1.
Related to Fig. 1, VE-cadherin-Cre mediates efficient gene recombination and blocks insulin action in endothelial cells. (A) Quantitative PCR (qPCR) analysis of mRNA expression of Tie-2 (TEK), VE-cadherin (Cdh5), and ACTA2 in aorta, lung, and dura matter in 2-mo-old mice (n = 8). Values were normalized by TBP and TEK. Messenger RNA expression of IRs (B) and protein expression (C) of IGF1-receptor in aorta (n = 8) by qPCR and Western blot, respectively. (D) Representative images of GFP expressions in vessels in the skeletal muscle of 2-mo-old ROSA26EGFP:VE-cadherin-Cre+/− mice assessed by immunohistochemistry. (E) Representative images in frontal cortex for FITC-insulin and DyLight 594-labeled lectin after i.v. infusion of FITC-insulin (14 mU·kg−1·min−1) for 10 min followed by lectin injection (1 mg/kg) to 2-mo-old mice after 4-h fasting. (F) FITC-insulin binding in the frontal cortex was estimated by relative FITC-positive area normalized by DyLight594-positive area (n = 4). (G) Protein expressions of vascular mediators eNOS (Left) and ET-1 (Right), in aorta assessed by Western blotting (n =7). Data are presented as mean ± SEM; ***P < 0.001, control vs. EndoIRKO mice by unpaired t test.
Fig. 1.
VE-cadherin-Cre mediates efficient gene recombination and blocks insulin action in endothelial cells. Protein expression of IR was assessed by Western blotting in isolated lung endothelial cells (A), peripheral tissues and brain subregions (B), bone marrow (BM), peripheral blood mononuclear cells (PBMC), and peritoneal macrophages (Mo) from adult control and EndoIRKO mice and (n = 5–7) (C). (D) Representative images of immunohistochemical staining of GFP, lectin, and DAPI with brain sections of adult ROSA26-EGFP:VE-cadherin-Cre+/− mice. (E) Akt and ERK phosphorylation assessed by Western blotting in aorta of 2-mo-old mice after 4-h fasting (n = 7). (F) Tissue blood flow in liver, muscle, mesenteric fat, and whole brain as assessed by a fluorescent microsphere method in 4-h fasted mice (n = 8). Data are presented as mean ± SEM; *P < 0.05, ***P < 0.001 by unpaired t test.
Loss of IR was specific with no change in IGF1R protein, as assessed in aorta (Fig. S1C). Specific recombination was further demonstrated by ROSA26-GFP reporter mice driven by VE-cadherin-Cre transgene which demonstrated GFP decorating the vascular endothelium in the skeletal muscle and the brain (Fig. 1D and Fig. S1D). Insulin binding to vascular endothelium in frontal cortex was assessed using i.v. infusion of FITC-insulin (14 mU·kg−1·min−1, 10 min) followed by i.v. injection of lectin to label endothelium; this found an 85% reduction in insulin binding in EndoIRKO mice (Fig. S1 E and F).
To evaluate effects of IR deletion in endothelial cells, we evaluated insulin signaling in aorta by Western blotting. In 2-mo-old EndoIRKO mice after a 4-h fast, basal Akt and ERK phosphorylation were significantly decreased (Fig. 1E), despite similar plasma insulin levels compared with control mice (0.56 ± 0.05 vs. 0.42 ± 0.05 ng/mL in control and EndoIRKO mice). Tissue blood flow was also analyzed under these conditions using fluorescent microspheres, and no difference was found between control and EndoIRKO mice in all tissues tested (Fig. 1F). There was also no change in protein levels of eNOS and ET-1 in extracts of aorta of EndoIRKO mice (Fig. S1G). Taken together, these results indicate that EndoIRKO mice had lost IR expression in endothelial cells in all peripheral tissues and in the brain. This was associated with decreased insulin signaling in vasculature, but did not affect tissue blood flow in major target tissues of insulin.
Loss of Endothelial IR Causes Delay of Insulin Signaling in Skeletal Muscle and BAT but Not Liver.
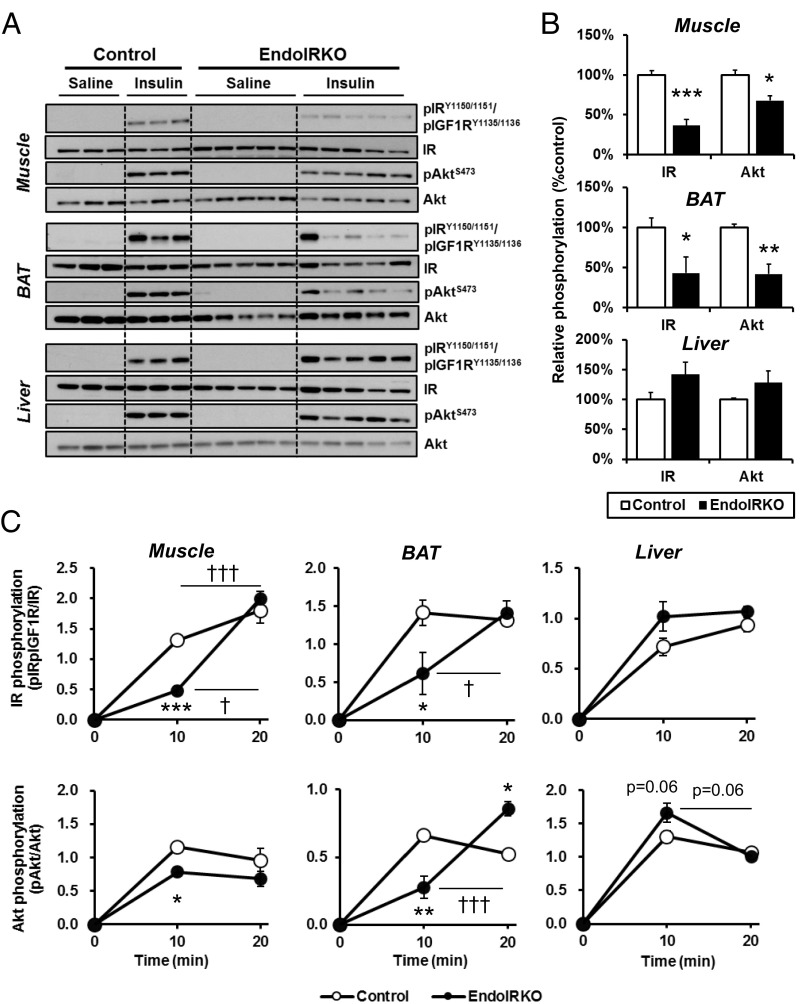
To assess effects of IR deletion in endothelial cells on insulin signaling in peripheral tissues, 2-mo-old EndoIRKO and control littermates were injected with insulin (5 U per mouse) i.v., and IR and Akt phosphorylation was evaluated by Western blotting. At 10 min after injection, IR and Akt phosphorylation was robustly increased in muscle and BAT of control mice (Fig. 2A). By contrast, in EndoIRKO mice, insulin-stimulated IR phosphorylation was decreased by 63% in muscle and 57% in BAT, and was paralleled by significant decreases in Akt phosphorylation (Fig. 2B). By contrast, IR and Akt phosphorylation in liver was comparable between control and EndoIRKO mice (Fig. 2 A and B), indicating normal insulin signaling in liver of EndoIRKO mice.
Fig. 2.
Loss of endothelial IR causes kinetic delay of the insulin signaling in skeletal muscle and BAT but not liver. (A) Western blot analysis of insulin signaling in soleus muscle, interscapular BAT, and liver of 2-mo-old overnight fasted control and EndoIRKO mice 10 min after i.v. insulin stimulation (5 IU per mouse) or control saline (n = 3–5). (B) Relative phosphorylation of IR and Akt calculated as the ratio of phosphoprotein/total protein and normalized by values in control mice. (C) Time-course of relative phosphorylation of IR and Akt after subtracting values in saline group during 20 min after i.v. insulin stimulation (5 IU per mouse) (n = 2–5). Data are presented as mean ± SEM; *P < 0.05, **P < 0.01, ***P < 0.001, control vs. EndoIRKO mice by unpaired t test; †P < 0.05, †††P < 0.001, 10 min vs. 20 min in each mouse by ANOVA.
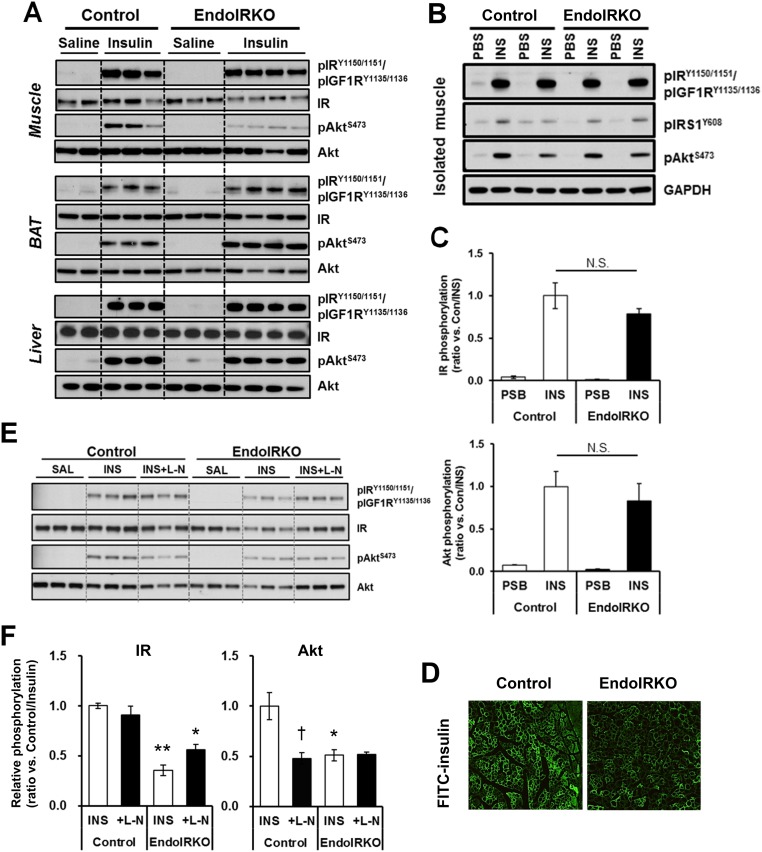
The reduced insulin signaling in muscle and BAT was due to a delay in insulin signaling, not a decrease in maximal response. Thus, IR and Akt phosphorylation in muscle and BAT in EndoIRKO mice increased to comparable levels to those in control mice by 20 min (Fig. 2C and Fig. S2A). Consistent with this, when skeletal muscle was isolated and stimulated to insulin ex vivo, IR, IRS1, and Akt phosphorylation were comparable between muscles of control and EndoIRKO mice (Fig. S2 B and C). Thus, myocytes in EndoIRKO mice have normal insulin responsiveness to direct stimulation, but following systemic insulin stimulation in vivo, there is a significant delay in onset of insulin signaling reflecting impaired access of circulating insulin to target cells. This phenotype was confirmed by the finding that FITC-insulin distribution in cross-sections of muscle during i.v. infusion of FITC-insulin, which was lower in EndoIRKO than control mice (Fig. S2D). Nitric oxide (NO) has important hemodynamic actions and is produced by NO synthase (NOS) in endothelial cells upon insulin stimulation (20, 21). However, pretreatment of mice with the NOS inhibitor l-NAME (100 mg/kg, i.p.) before i.v. insulin injection had no effect on stimulation of IR phosphorylation in control or EndoIRKO mice (Fig. S2 E and F).
Fig. S2.
Related to Fig. 2, loss of endothelial IR causes kinetic delay of the insulin signaling in skeletal muscle and BAT but not liver. (A) Western blot analysis of insulin signaling in soleus muscle, BAT, and liver of 2-mo-old mice at 20 min after i.v. insulin stimulation (5 IU per mouse) or control saline (n = 2–4). (B) Western blot analysis of insulin signaling in isolated soleus muscle of 2-mo-old mice at 10 min after ex vivo insulin (50 nM) or PBS stimulation (n = 4). (C) Relative phosphorylation of IR and Akt estimated by phospho-protein/total protein [expressed ratio vs. Con/INS (insulin trial in control mice)] after ex vivo insulin stimulation. (D) Representative images of muscle after FITC-insulin infusion (14 mU·kg−1·min−1) for 10 min in 2-mo-old mice after 4-h fasting. (E) Western blot analysis of insulin signaling in soleus muscle at 10 min after i.v. insulin stimulation (5 IU, INS) or control saline (SAL) to 2-mo-old control and EndoIRKO mice (n = 3) with pretreatment of i.p. injection of l-NAME (L-N) or saline at 30 min before insulin injection. (F) Relative phosphorylation of IR and Akt estimated by phospho-protein/total protein and normalized with values of insulin injection group in control mice (Control/INS). Data are presented as mean ± SEM; *P < 0.05, **P < 0.01, control vs. EndoIRKO mice; †P < 0.05, INS vs. INS + L-N by ANOVA.
Loss of Endothelial IR Causes Delays in Insulin Signaling in Hypothalamus, Hippocampus, and Prefrontal Cortex but Not Olfactory Bulb.
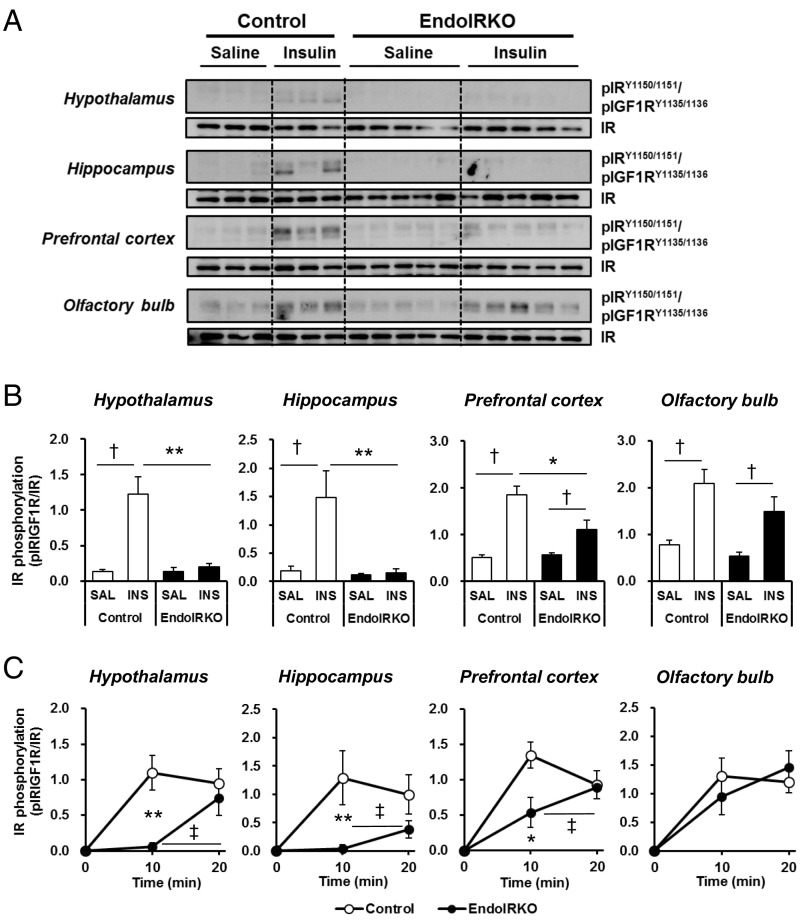
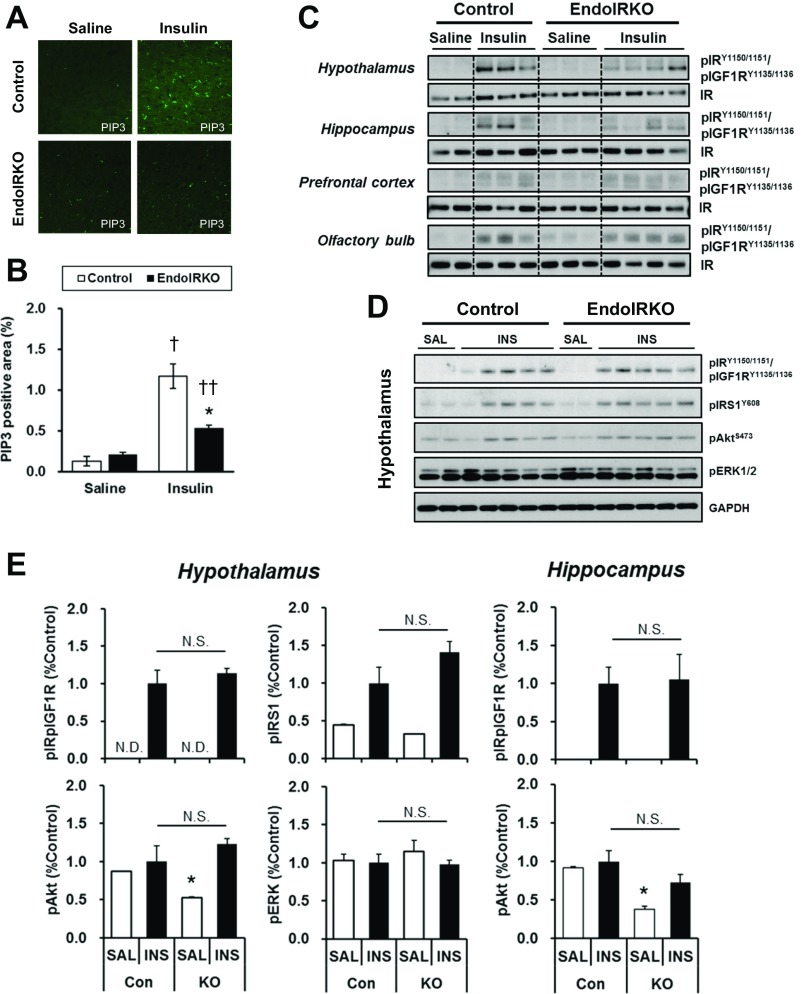
The brain can acutely respond to changes in systemic insulin concentrations (3). Following i.v. insulin stimulation (5 U per mouse) in 2-mo-old control mice, tyrosine phosphorylation of IR was significantly increased in hypothalamus, hippocampus, prefrontal cortex, and olfactory bulb within 10 min (Fig. 3 A and B). By contrast, in EndoIRKO mice, this response was decreased by 85% and 99% (both P < 0.01) in hypothalamus and hippocampus (Fig. 3B). Interestingly, there was no decrease of insulin-stimulated IR phosphorylation in olfactory bulb and only a 60% decrease in prefrontal cortex of EndoIRKO mice (Fig. 3B), suggesting regionally different roles of endothelial IR in the ability of insulin to signal in the brain. The reduced IR phosphorylation in the prefrontal cortex was associated with a parallel 54% reduction in the accumulation of PIP3 (3,4,5-phosphotidylinositol trisphosphate), an intermediate of insulin signaling, at 10 min after insulin injection in EndoIRKO mice (Fig. S3 A and B).
Fig. 3.
Loss of endothelial IR causes delays in insulin signaling in hypothalamus, hippocampus, and prefrontal cortex, but not olfactory bulb. (A) Western blot analysis of insulin signaling in hypothalamus, hippocampus, prefrontal cortex, and olfactory bulb of 2-mo-old overnight fasted control and EndoIRKO mice 10 min after i.v. insulin stimulation (INS, 5 IU per mouse) or control saline (SAL) (n = 3–5). (B) Relative phosphorylation of IR estimated by phosphoprotein/total protein. (C) Time-course of relative phosphorylation of IR after subtracting values in saline group during the 20 min after i.v. insulin stimulation (5 IU per mouse) (n = 2–5). Data are presented as mean ± SEM; *P < 0.05, **P < 0.01, control vs. EndoIRKO mice by unpaired t test; †P < 0.05, saline vs. insulin for each mouse by unpaired t test; ‡P < 0.05, 10 min vs. 20 min in each group of mice by ANOVA.
Fig. S3.
Related to Fig. 3, loss of endothelial IR causes delays in insulin signaling in hypothalamus, hippocampus, and prefrontal cortex, but not olfactory bulb. (A) Representative images in frontal cortex for PIP3 at 10 min after i.v. insulin (5 IU per mouse) or saline injection to 2-mo-old mice after overnight fasting. (B) Relative PIP3-positive area in frontal cortex (n = 3). (C) Western blot analysis of insulin signaling in hypothalamus, hippocampus, prefrontal cortex, and olfactory bulb of 2-mo-old control and EndoIRKO mice at 20 min after i.v. insulin stimulation (5 IU per mouse) or control saline (n = 2–4). (D) Western blot analysis of insulin signaling in hypothalamus at 10 min after i.c.v. insulin (INS, 500 µU/μL, 2 µL) or control saline (SAL) injection to 2-mo mice (n = 2–5). (E) Relative phosphorylation of IR, IRS1, Akt, and ERK in hypothalamus, and IR and Akt in hyppocampus estimated by phospho-protein/total protein [expressed ratio vs. insulin trial in control mice (Con/INS)]. Data are presented as mean ± SEM; *P < 0.05, control vs. EndoIRKO mice. †P < 0.05, ††P < 0.01, saline vs. insulin by ANOVA. N.D., not detectable level; N.S., not significant difference.
Similarly, a time course of insulin-stimulated IR phosphorylation revealed that the decreased IR phosphorylation at 10 min after insulin injection represented a delay rather than loss of insulin responsiveness in brain regions of EndoIRKO mice. Indeed, in control mice, IR phosphorylation in hypothalamus, hippocampus, prefrontal cortex, and olfactory bulb was rapidly increased from basal levels within 10 min after i.v. insulin injection, and these increases were maintained at 20 min (Fig. 3C and Fig. S3C). By contrast, in EndoIRKO mice, IR phosphorylation in hypothalamus, hippocampus, and prefrontal cortex was lower at 10 min, but increased at 20 min to levels comparable to those in control mice (Fig. 3C). When control and EndoIRKO mice were subjected to i.c.v. insulin stimulation (500 µIU/µL, 2 µL), thus bypassing the blood–brain barrier, insulin-stimulated IR phosphorylation in hypothalamus and hippocampus was comparable between control and KO mice 10 min after the injection (Fig. S3 D and E). Together, these data indicate that loss of endothelial IRs has no effect on insulin response in brain under direct insulin stimulation, but endothelial IR causes a delayed onset of insulin signaling in brains in response to systemic insulin administration.
Loss of Endothelial IR Impairs Barrier Function in the Brain.
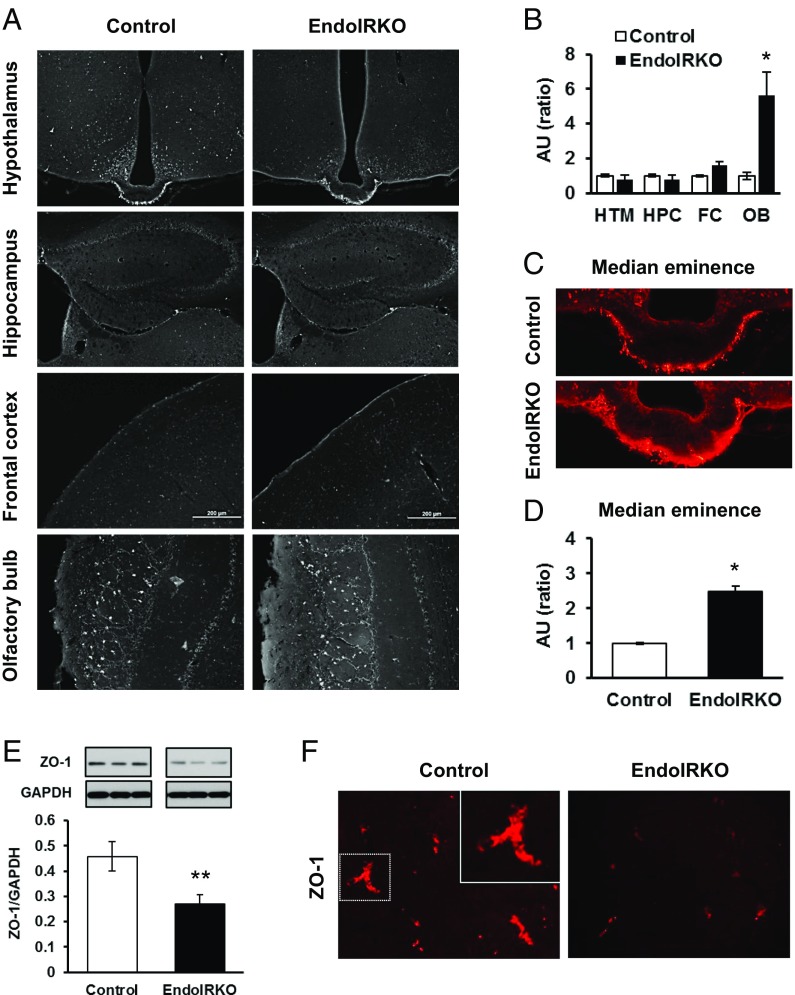
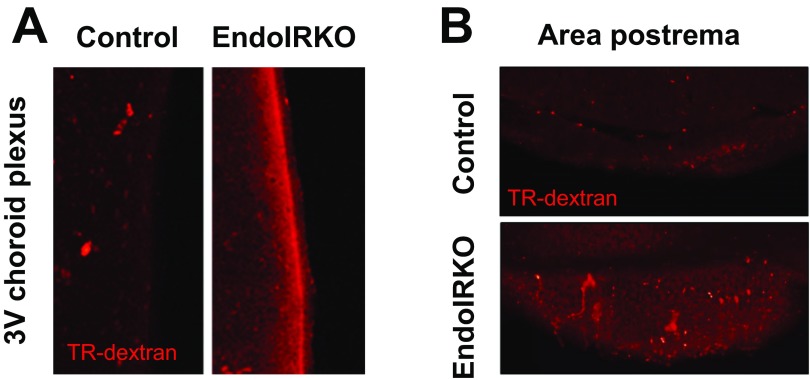
To assess vascular barrier function in the brain in vivo, we injected Texas Red-conjugated dextran (TR-dextran, 3 kDa) i.v. in 2-mo-old mice. Tissue blood flow in the brain was not changed in EndoIRKO mice as assessed above (Fig. 1F). In control mice, the median eminence (ME), as reported previously (22), and the outer layers of the olfactory bulb showed higher permeability of the tracer compared with other hypothalamic areas or other brain regions, including the prefrontal cortex and hippocampus, indicating a less tight vascular barrier in the former (Fig. 4A). In EndoIRKO mice, the olfactory bulb (Fig. 4 A and B) and ME (Fig. 4 C and D) had even higher permeability than controls. Consistent with this, protein expression of the tight junction protein ZO-1 was decreased by 40% in hypothalamic extracts of EndoIRKO mice (Fig. 4E), and this was further supported by decreased ZO-1 immunostaining of hypothalamus in EndoIRKO mice (Fig. 4F). Also, other interface structures involved in exchange of solutes between the systemic circulation and CSF, such as third ventricle choroid plexus and area postrema, showed higher permeability in EndoIRKO than control mice (Fig. S4), suggesting that loss of endothelial IR may impair barrier function of brain endothelial cells in these brain areas. While it is possible that Cre expression itself has some cytotoxic effect, this seems unlikely, since the toxic effect did not occur in all of the endothelial cells where Cre is expressed.
Fig. 4.
Loss of endothelial IR causes impaired barrier function in the brain. (A) Representative images of brain sections of hypothalamus (HTM), hippocampus (HPC), frontal cortex (FC), and olfactory bulb (OB) at 10 min after i.v. injection of Texas Red (TR)-conjugated dextran (3 kDa, TR-dextran) to 2-mo-old mice. (B) Relative intensity of TR-dextran in each brain regions from A (n = 3). (C) Representative images of brain sections of median eminence after TR-dextran injection. (D) Relative intensity of TR-dextran in medium eminence from C (n = 3). (E) Western blot analysis of ZO-1 expression in hypothalamus in 2-mo-old mice (n = 6). (F) Representative images of hypothalamic sections with immunohistochemical stain of ZO-1 protein in 2-mo-old mice. *P < 0.05, **P < 0.01, control vs. EndoIRKO mice by unpaired t test.
Fig. S4.
Related to Fig. 4, loss of endothelial IR causes impaired barrier function in the brain. Representative images of brain sections of the third ventricle (3V) choroid plexus (A) and area postrema (B) at 10 min after i.v. injection of Texas Red (TR)-conjugated dextran (3 kDa, TR-dextran) to 2-mo-old mice (n = 3).
Loss of Endothelial IR Causes Functional Delay of Systemic Insulin Action.
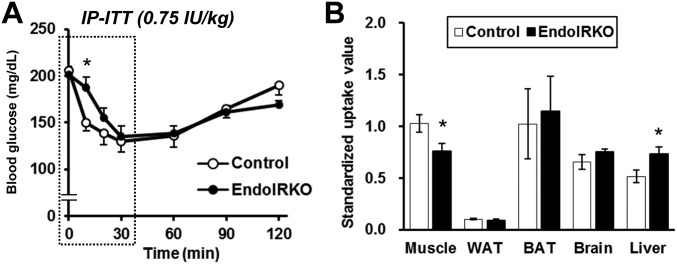
The loss of endothelial IR resulted in a change in the kinetics of insulin action in vivo. Following i.p. injection of insulin (0.75 IU/kg) to 2-mo-old control mice, blood glucose levels were decreased rapidly, with more than a 25% fall within 10 min. By contrast, in EndoIRKO mice, the acute decrease in blood glucose levels was significantly smaller at this early time point (Fig. 5A), but then disappeared by 30 min after insulin injection such that minimum glucose levels were similar in both mice (Fig. 5 A and B and Fig. S5A). The latency of insulin-induced hypoglycemic effect, calculated as the time to induce half-maximal reduction of blood glucose, was 17 ± 2 in EndoIRKO versus 10 ± 1 min in controls (P = 0.003) (Fig. 5C). Assessment of [14C] 2-deoxyglucose accumulation in tissues also revealed a significant decrease in glucose uptake in muscle of EndoIRKO compared with controls, reflecting impaired insulin action in this tissue (Fig. S5B). In contrast, glucose uptake in liver, which is not insulin regulated, was slightly higher in EndoIRKO than control mice, probably reflecting higher glucose availability for liver secondary to lower glucose uptake in muscle (Fig. S5B).
Fig. 5.
Loss of endothelial IR causes functional delay of systemic insulin action. (A) Blood glucose levels after i.p. injection of insulin (0.75 IU/kg) to 2-mo-old control (n = 11) and EndoIRKO mice (n = 18) fasted for 4 h before the experiment. (B) Minimum blood glucose levels after the insulin injection. (C) Latency for hypoglycemic effect of insulin calculated as a time to induce half maximum reduction after the insulin injection. Data are presented as mean ± SEM; *P < 0.05, **P < 0.01, control vs. EndoIRKO mice in ANOVA (A) or unpaired t test (B and C). N.S., not significant.
Fig. S5.
Related to Fig. 5, loss of endothelial IR causes functional delay of systemic insulin action. (A) Blood glucose levels in i.p. (IP)-ITT with 0.75 IU/kg in 2-mo-old control (n = 11) and EndoIRKO mice (n = 18). Dotted area in A was trimmed for Fig. 5A. (B) Standardized uptake value (distribution of glucose uptake in tissues) after insulin injection (1 mU/g) in combination with [14C]2-deoxyglucose (0.33 µCi/g) to 4-h fasted 2-mo-old mice (n = 5). Data are presented as mean ± SEM; *P < 0.05, control vs. EndoIRKO mice by ANOVA (A) and unpaired t test (B).
Loss of Endothelial IR Causes Systemic Insulin Resistance and Mild Obesity.
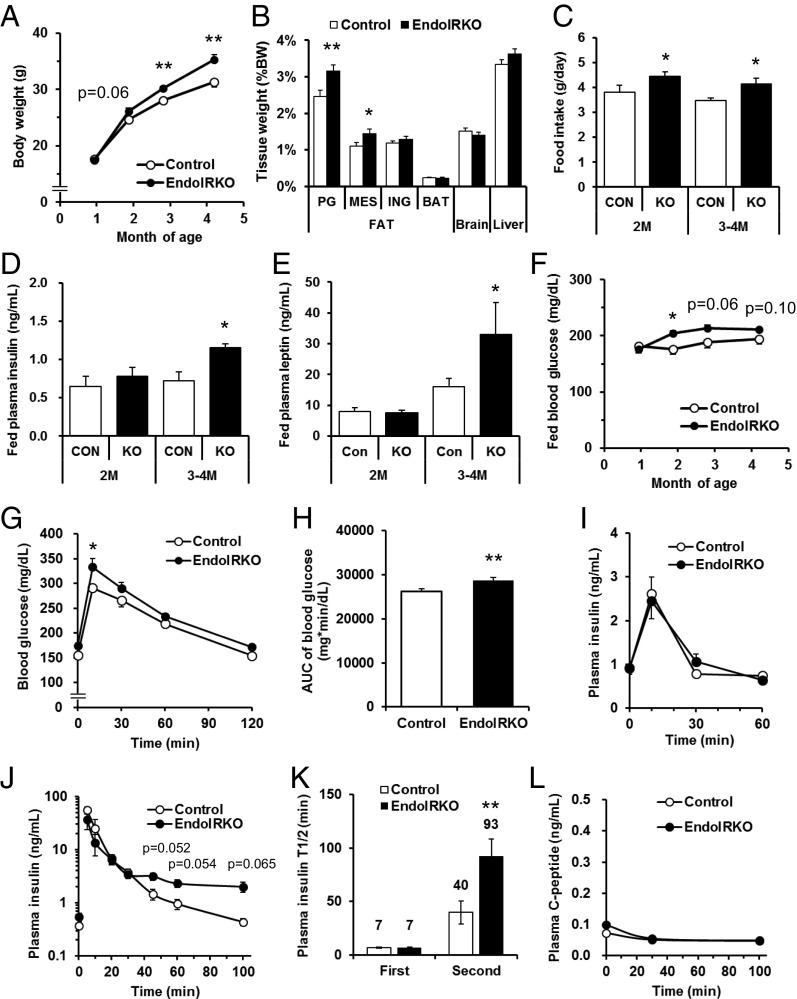
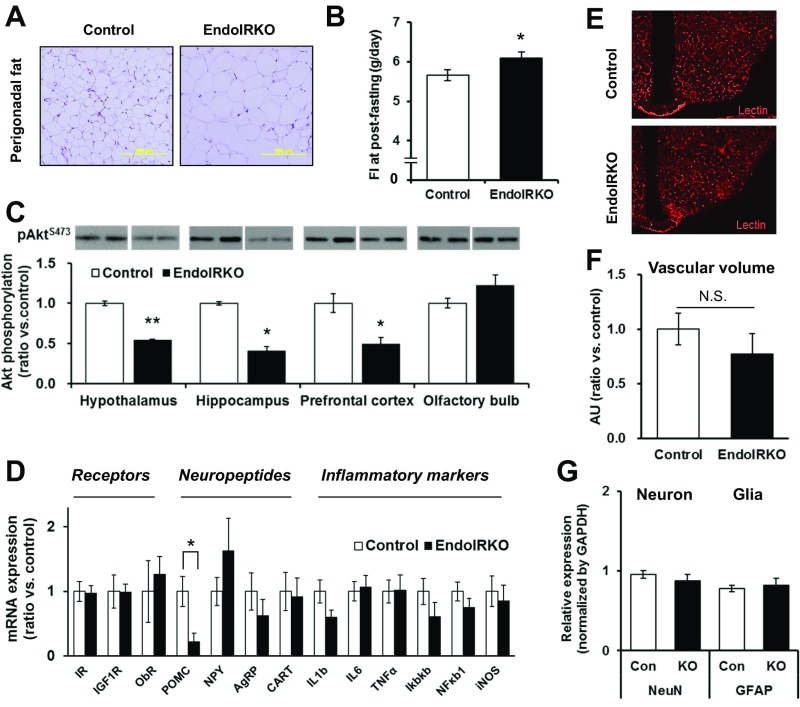
Body weight of EndoIRKO mice was higher than controls starting as early as 2 mo of age and was 10% higher by 4–5 mo of age (Fig. 6A). This was primarily due to an 38% increase in visceral fat (perigonadal and mesenteric) in EndoIRKO mice (P = 0.002, Fig. 6B and Fig. S6A). The increased fat mass was likely the result of increased food intake, which was 15% higher in EndoIRKO mice as early as 2 mo of age (Fig. 6C). Food intake following an overnight fasting was also higher in EndoIRKO mice (Fig. S6B). At 2 mo of age, fed plasma insulin and leptin levels were comparable between control and EndoIRKO mice (Fig. 6 D and E).
Fig. 6.
Loss of endothelial IR causes systemic insulin resistance and mild obesity. (A) Body weight changes of control (n = 10–13) and EndoIRKO mice (n = 15–33). (B) Tissue weight of 3-mo-old mice (control, n = 11; EndoIRKO, n = 13). PG, Mes, and ING is perigonadal, mesenteric, inguinal fat, respectively. (C) Cumulative food intake for 24 h in 2-mo and 3- to 4-mo-old mice (n = 12). Plasma insulin (D) and leptin (E) in 2-mo and 3- to 4-mo-old mice with nonfasting (n = 7). (F) Blood glucose levels with nonfasting condition (control, n = 10–13; EndoIRKO, n = 15–33). Blood glucose (G), area under the curve (AUC) of blood glucose (H), and plasma insulin (I) during oral glucose tolerance test (2 g/kg) performed at 2- to 3-mo-old mice after 4-h fasting before the experiment (control, n = 11; EndoIRKO, n = 12). Plasma insulin (J), half-life of insulin (T1/2) in the plasma (K), and plasma C-peptide (L) after i.v. injection of insulin (1 IU/kg, n = 3). Data are presented as mean ± SEM; *P < 0.05, **P < 0.01, control vs. EndoIRKO mice by ANOVA (A, F, G, and J) or unpaired t test (B–E, H, and K).
Fig. S6.
Related to Fig. 6, loss of endothelial IR causes systemic insulin resistance and mild obesity. (A) Representative images for perigonadal fat with H&E stain in 3- to 4-mo-old control and EndoIRKO mice. (B) Cumulative food intake for 24-h after overnight fasting stimulation in 2- to 3-mo-old control (n = 7) and EndoIRKO (n = 8) mice. (C) Western blot analysis of basal brain Akt signaling in 2-mo-old mice with nonfasting. Akt phosphorylation was evaluated by phospho/total protein and normalized by control (n = 2–3). (D) Hypothalamic mRNA expressions of receptors, neuropeptides, and inflammatory markers in 2-mo-old mice after 4-h fasting assessed by qPCR (n = 11–13). (E) Representative images of hypothalamic section after i.v. lectin injection to label endothelium (1 mg/kg). (F) Quantification of lectin-positive area in hypothalamic sections (ratio vs. control, n = 3). (G) Relative protein expressions of neuronal (NeuN) and glial (GFAP) markers assessed by Western blotting in 2-mo-old mice (n = 8). Data are presented as mean ± SEM; *P < 0.05, **P < 0.01, control vs. EndoIRKO mice by unpaired t test. N.S., not significant difference.
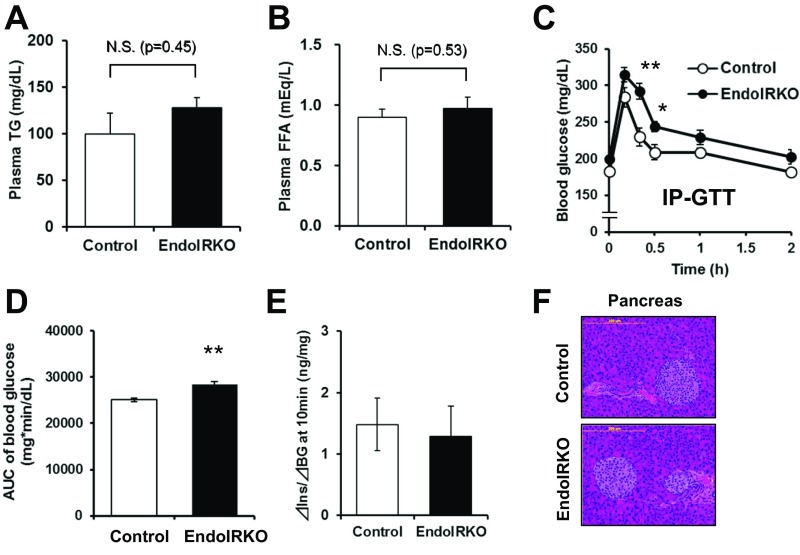
Basal Akt phosphorylation at this age, however, was significantly lower in EndoIRKO mice in hypothalamus, hippocampus, and prefrontal cortex, but not olfactory bulb (Fig. S6C). Hypothalamic POMC mRNA expression was decreased by 77% in EndoIRKO mice (P = 0.011, Fig. S6D), whereas levels of other neuropeptides, insulin and leptin receptors, and inflammatory markers were unchanged (Fig. S6D). In hypothalamus, there was no difference in vascular volume or content of neurons and glial cells between control and EndoIRKO mice as assessed by lectin staining and Western blotting of appropriate marker proteins, respectively (Fig. S6 E–G). Interestingly, by 3–4 mo of age, fed plasma insulin and leptin levels were 60% and 104% higher in EndoIRKO than control mice (Fig. 6 D and E), indicating a level of insulin and leptin resistance. This was accompanied by higher blood glucose levels in EndoIRKO mice (Fig. 6F), despite unchanged plasma triglyceride and free fatty acid levels (Fig. S7 A and B).
Fig. S7.
Related to Fig. 6, loss of endothelial IR causes systemic insulin resistance and mild obesity. Plasma triglyceride (TG) (A) and FFA (B) concentrations in nonfasting condition of 3- to 4-mo-old control (n = 8–11) and EndoIRKO (n = 8–12) mice. Blood glucose levels (C) and AUC of blood glucose levels (D) during i.p. (IP)-GTT (2 g/kg) in 2- to 3-mo-old mice after 4-h fasting (n = 7–9). (E) Index of insulin secretion at 10 min after oral GTT (related to Fig. 6 G and I) estimated by changes in plasma insulin from baseline vs. changes in blood glucose from baseline. (F) Representative images for pancreatic sections with H&E stain in 3- to 4-mo-old control and EndoIRKO mice. Data are presented as mean ± SEM; *P < 0.05, **P < 0.01, control vs. EndoIRKO mice by ANOVA (C) and unpaired t test (A, B, and D). N.S., not significant difference.
In addition to the delay in insulin action (Fig. 5A), EndoIRKO mice displayed mild glucose intolerance compared with control mice on both oral (Fig. 6 G and H) and i.p. glucose tolerance test (GTT) (Fig. S7 C and D). This occurred with comparable plasma insulin levels (Fig. 6I) and comparable glucose-stimulated insulin secretion, as estimated by changes in blood glucose and plasma insulin at 10 min after glucose-loading compared with baseline values [△Insulin (10 min-baseline)/△BG (10 min-baseline)] during the oral GTT (Fig. S7E). In addition, islet histology in pancreatic sections of EndoIRKO mice was normal (Fig. S7F). Assessment of insulin clearance following i.v. insulin injection (1 IU/kg) revealed biphasic decay curves of plasma insulin concentration in both 2-mo-old control and EndoIRKO mice after overnight fast. There was no difference during the first phase of insulin clearance, but insulin levels during the second phase trended to be higher in EndoIRKO than in controls (P < 0.065, Fig. 6J), resulting in a significantly longer t1/2 of insulin in the plasma in EndoIRKO (Fig. 6K). This was accompanied with unchanged endogenous insulin secretion as assessed by plasma C-peptide levels in EndoIRKO mice (Fig. 6L). Thus, the altered kinetics of insulin signaling in EndoIRKO mice predisposes these mice to the development of central insulin and leptin resistance, leading to mild obesity and systemic insulin resistance, which results in the mild impairment of glucose homeostasis.
Loss of Endothelial IR Accelerates High-Fat Diet-Induced Insulin Insensitivity.
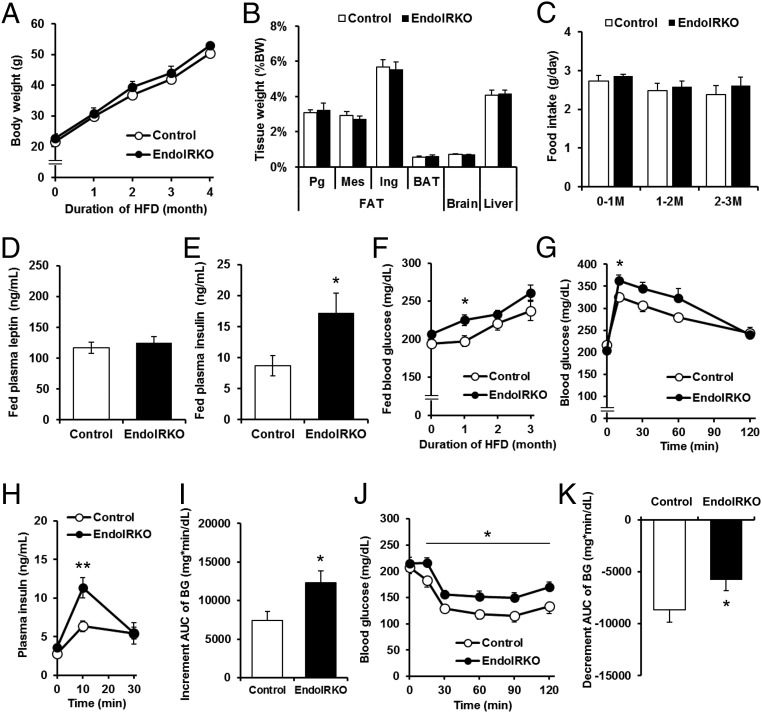
High-fat diet (HFD) induces systemic insulin resistance and glucose intolerance both in rodents and humans. To determine how endothelial IR regulates this process, EndoIRKO and control mice were challenged with HFD (60% calories from fat) for 4 mo starting at 6–8 wk of age. Compared with chow diet-fed mice, HFD treatment did not change body weight, fat pad weight, and food intake in EndoIRKO mice compared with controls (Fig. 7 A–C). Fed plasma leptin levels was increased by three- to fivefold in control mice (Fig. 7D) compared with those on chow diet (Fig. 6E), and no further impairment was observed in HFD-fed EndoIRKO mice compared with controls. Fed plasma insulin (Fig. 7E) and blood glucose (Fig. 7F) were significantly higher in EndoIRKO mice, indicating a greater level of systemic insulin resistance. During oral GTT performed after a 3-mo HFD, EndoIRKO mice displayed impaired glucose tolerance with a significant higher plasma insulin response to glucose loading (Fig. 7 G–I). On an insulin tolerance test (ITT) (1.25 IU/kg, i.p.) performed after a 3-mo HFD, EndoIRKO mice showed a greater level of insulin insensitivity than controls (Fig. 7 J and K). Thus, loss of endothelial IRs accelerates systemic insulin resistance and impaired glucose homeostasis induced by HFD.
Fig. 7.
Loss of endothelial IR accelerates high-fat diet-induced insulin insensitivity. (A) Body weight changes during 4 mo of HFD treatment starting at 6–8 wk of age (control, n = 9; EndoIRKO, n = 8–). (B) Tissue weight after 4 mo of HFD treatment. PG, Mes, and ING is perigonadal, mesenteric, and inguinal fat, respectively. (C) Cumulative food intake for 24 h at different stage of HFD treatment. Plasma leptin (D) and insulin (E) in nonfasting condition after 3 mo of HFD treatment. (F) Blood glucose levels with nonfasting condition. Blood glucose (G), plasma insulin levels (H), and increment area under the curve (AUC) (I) of blood glucose levels during oral glucose tolerance test (2 g/kg) performed in mice fasted for 4 h after 3 mo of HFD. Blood glucose (J) and decrement AUC (K) of blood glucose levels during insulin tolerance test (1.25 IU/kg, i.p.) in mice fasted for 4 h after 3-mo HFD treatment. Data are presented as mean ± SEM; *P < 0.05, **P < 0.01, control vs. EndoIRKO mice by ANOVA (F–H and J) or unpaired t test (E, J, and K).
Discussion
Hormones, such as insulin, by their nature as circulating mediators of physiological regulation, are separated from their target tissues by a vascular barrier. It has been hypothesized that circulating insulin accesses target tissues by a receptor-mediated transendothelial transport (10), and this has been supported by in vitro studies which show receptor-mediated transcytosis (10–12) and indirectly by assessing insulin appearance in interstitial fluids and lymph in vivo (14–17, 23, 24). However, how this process regulates insulin signaling in different tissues in vivo is unclear (18, 19). In the present study, by using mice with an endothelial cell-specific knockout of IRs (EndoIRKO), we have addressed the question of how IRs on endothelial cells might affect insulin signaling in peripheral tissues and CNS using IR tyrosine kinase activation as a measure of transit of insulin across a vascular barrier and binding to its receptors. We find that loss of endothelial IR delays onset of IR activation in multiple tissues upon insulin stimulation, including skeletal muscle, brown adipose tissue, and some brain regions (hypothalamus, hippocampus, prefrontal cortex), whereas it has no effect on signaling in the liver or olfactory bulb. This delayed activation of insulin signaling reflects the loss of IR-mediated insulin delivery across a vascular barrier in specific tissues. This leads to a slowing of insulin-induced glucose lowering and a dysregulation of food intake, indicating both systemic and central insulin resistance. This results in glucose intolerance and mild obesity with leptin resistance.
The phenotype of the EndoIRKO mice is somewhat different from that observed in our previous model of endothelial cell-specific IR gene inactivation (VENIRKO) generated using the Tie2-Cre transgene (Tg). Although the kinetics of insulin action were not studied in the VENIRKO mice, these animals did not develop glucose intolerance and retained insulin sensitivity on an ITT (25, 26). This likely relates to differences in effectiveness of gene recombination with the VE-cadherin-Cre Tg mice being more strongly expressed in endothelial cells in virtually all tissues from fetal to adult age (present study and ref. 27), and the higher specificity of the VE-cadherin transgene with no deletion of IR in hematopoietic cells, such as those that occur with the Tie2-Cre (28). The latter is important because myeloid cell-specific deletion of IR, such as in macrophages and monocytes, is protective against obesity-induced inflammation and systemic insulin resistance (29). Another possible contributor to these phenotypic differences may be differences in genetic background (25, 26) with EndoIRKO mice on the more diabetes-prone B6 background and VENIRKO mice on a mixture of 129Sv, B6, SJL, FVB, and DBA, with 129Sv mice being obesity- and diabetes-resistant (30).
In addition to serving to deliver insulin to its target tissues, in some tissues, especially skeletal muscle, insulin can facilitate tissue perfusion via its effect to stimulate NOS, which in turn enhance endothelium-dependent NO production (20, 21). Treatment with NOS inhibitors, such l-NAME, can block this hemodynamic action of insulin (31–33). In the present study, pretreatment with l-NAME did not affect insulin signaling in skeletal muscle at 10 min after insulin stimulation in either control or EndoIRKO mice. Thus, tissue perfusion in response to insulin injection may have only a minor role under our experimental conditions, which involves pharmacological doses of insulin. Indeed, in humans during hyperinsulinemic-euglycemic clamp studies, glucose uptake in leg muscle is increased even after blood flow response is maximized (34, 35), indicating two potential rate-limiting steps involved in action of circulating insulin on muscle. Under low insulin conditions, we found no significant change in perfusion of skeletal muscle or other tissues in EndoIRKO mice as assessed by the florescent microsphere method (36) but did find a trend of decreased distribution of FITC-insulin in muscle. Together these findings suggest that insulin transport into muscle is decreased by deletion of endothelial IR, and this occurs in addition to any alterations in blood flow.
In either case, in EndoIRKO mice, the differential kinetics of insulin signaling in different tissues indicates that the endothelial IR participates in getting insulin to target tissues in a tissue-specific manner, and the differences among tissues are due, in large part, to differences in the role of the IR in allowing transport across the endothelial barrier. The liver, for example, has discontinuous or fenestrated endothelium (6–8), which allows circulating molecules of even large size to diffuse into and out of the tissue. Indeed, insulin signaling in the liver is not affected by the loss of endothelial IR. By contrast, endothelial barriers in capillaries with transmembrane tight junctions prevent access of circulating molecules to tissues. This has been evidenced by previous studies in muscle (6, 7, 23), and the current study in adipose tissue (at least brown fat), as well as many regions of the brain, which are further isolated by the blood–brain barrier (9). In skeletal muscle, BAT, and brain, this endothelial barrier limits access of circulating molecules to these tissues, and therefore receptor-mediated transendothelial transport plays the largest roles (13–17). Indeed, our data show that loss of endothelial IR delays activation of the insulin signaling in skeletal muscle, brown adipose tissue, and some regions of the brain by about 10 min. This is longer than the half-life of insulin in the circulation in the mouse, which is 4–7 min (present study and ref. 37 and, hence, represents a very significant delay. Thus, in these tissues which have endothelial barriers, IRs on the endothelial cells have an important role in transendothelial insulin delivery. These findings are consistent with previous in vitro studies showing that in endothelial cells, transendothelial insulin transport of insulin is a saturable process and can be blocked by antibodies against IR, which prevent insulin binding to IRs (10, 11).
At the signaling level, the loss of IR in endothelial cells produces a kinetic delay, but has no significant effect on maximum insulin signaling after systemic insulin administration. This finding raises the question of what besides the IR mediates transendothelial transport of insulin? The IGF1 receptor (IGF1R) may be an alternative receptor for receptor-mediated transendothelial transport of insulin. Insulin can bind to IGF1R on endothelial cells at high concentration besides IR (38). Indeed, IGF1R neutralizing antibodies have been shown to suppress transendothelial insulin transport in vitro (11). Likewise, in brain perfusion studies, excess IGF1 has been shown to competitively suppress insulin transport into the brain (17). Thus, IGF1R on the endothelial cells may be also involved in transendothelial insulin transport, especially at high insulin concentrations. In addition, some insulin may cross the endothelium through nonreceptor-mediated mechanisms as suggested in previous reports, albeit at a slower rate than the facilitated transport by the IR (39, 40). In either case, taken together with previous studies, our data indicate that IRs on the endothelial cells are an important mode for transendothelial insulin delivery in vivo and determine the kinetics and, to some extent, the tissue specificity of insulin action.
While our study has focused on the role of the IR itself in the transcytosis process, insulin signaling in endothelial cells may also play a role (12, 24, 41). In cultured endothelial cells, chemical inhibition of the IR kinase or its downstream intermediate phosphatidylinositol 3-kinase has been shown to reduce transendothelial transport of insulin (12). In mice with knockout of IRS2 in endothelial cells or mice with impaired endothelial IR signaling due to high-fat feeding, there is also a decrease of transendothelial insulin delivery into the muscle interstitial fluid, further suggesting an important role of IR signaling in this process (24). In vitro studies have suggested that the ability of insulin to stimulate cortical actin remodeling may be involved in trafficking of IR in the endothelial cells (41). In the EndoIRKO mice, it is not possible to dissect the effects of lack of endothelial IR from lack of endothelial IR function. However, it is clear that loss of functional IR on endothelial cells can have important and differential effects on signaling in target tissues.
In addition to peripheral tissues, loss of endothelial IR differentially affects the kinetics of the insulin signaling among the brain regions. Of note, loss of endothelial IR does not affect insulin signaling in the olfactory bulb, either in the basal or insulin-stimulated states, and has only a partial effect on the prefrontal cortex. In earlier studies, it has been demonstrated that the olfactory bulb has the highest expression of IR in brain, highest insulin content, and highest insulin uptake rate from the periphery (42–45). How this extrapolates to humans is unknown, but with current investigations on the use of nasally administered insulin for treatment of Alzheimer’s disease (46), this should be kept in mind.
The ventral surface of hypothalamus is known to contain fenestrated endothelium (22), and thus it was surprising to find that in vivo insulin stimulation of the insulin signaling was delayed in the hypothalamus of EndoIRKO mice, although vascular permeability of the median eminence is even higher in EndoIRKO mice than in controls. This is probably due to the fact that the endothelial fenestration is limited to specific areas in the hypothalamus (22). However, our finding that loss of endothelial IR suppresses onset of insulin signaling in the hypothalamus indicates that the endothelial IR is important for timely access of circulating insulin to other areas of hypothalamus, including areas such as the ventromedial (VMH), lateral hypothalamic (LH), and paraventricular (PVN) nuclei involved in appetite control. This is supported by our finding that loss of endothelial IR causes increased food intake and body weight. The increased food intake is due, at least in part, to the decrease in hypothalamic POMC expression as part of brain insulin resistance. We and others have previously shown that knockout of IRs in whole brain (47) or specifically the hypothalamus (48) results in increased food intake, leading to mild obesity. In addition, insulin signaling in the hypothalamus has been shown to potentiate leptin signaling in the hypothalamus to activate the JAK/STAT pathway (49). Moreover, mice lacking the protein-tyrosine phosphatase PTP1B, which is a negative regulator of insulin signaling, are resistant to diet-induced obesity due to increased leptin sensitivity (50, 51). In the present study, loss of endothelial IR induces hyperleptinemia along with hyperinsulinemia at later age. This may be a secondary response to the increase in adipose mass in the EndoIRKO mice, but may also indicate that insulin transport into the hypothalamus via IRs on the endothelial cells is important for the effects of both insulin and leptin signaling for food intake and body weight regulations. HFD, which induces its own form of leptin resistance, masks this effect of the endothelial IR knockout.
In summary, using an in vivo mouse model in which IRs on the endothelial cells have been selectively deleted, we have shown an important role for these receptors in insulin delivery across the endothelium to multiple tissues in vivo. This defect alters the kinetics of insulin signaling and action differently in classical and nonclassical insulin target tissues, with significant delays in action in skeletal muscle, brown fat, and some regions of brain, but does not delay insulin action in liver or olfactory bulb. These kinetic alterations of insulin action predispose the mice to developing overeating, obesity, and systemic insulin resistance. Thus, improving IR function in the endothelial cells may provide a mechanism for prevention of obesity and both systemic and central insulin resistance.
Materials and Methods
Mice.
All protocols for animal use and euthanasia were approved by Institutional Animal Care and Use Committees of Joslin Diabetes Center and Brandeis University. Methods of generation and genotyping of tissue-specific IR KO mice have been previously described (52, 53). IRflox/flox mice and VE-cadherin-Cre transgenic mice [B6.FVB-Tg(Cdh5-cre)7Mlia/J; Jackson Laboratories] were used to generate an endothelial-specific IR knockout mice, VE-cadherin-Cre:IRflox/flox (EndoIRKO). VE-cadherin-Cre transgenic mice were backcrossed to C57BL/6 mice for 12 generations before arriving at Jackson Laboratories and were bred to C57BL/6J inbred mice at Jackson Laboratories for at least one generation to establish colony. The colony was maintained by breeding these mice together. The IRflox/flox mice used in this study had been backcrossed more than 10 generations with C57BL/6 mice before initiation of these experiments. In all experiments, male EndoIRKO mice and IRflox/flox littermates as control mice were used. Animals were housed on a 12-h light/dark cycle (light on at 6:00 AM) with free access to a standard chow (5020 Mouse Diet 9F;; LabDiet) or 60% HFD (D12492; Research Diet) and tap water ad libitum.
Isolation of Lung Endothelial Cells and Hematopoietic Cells.
Lung endothelial cells were isolated from control and EndoIRKO mice as previously described (28). In brief, lungs were digested with collagenase and dissociated cells were cultured. Then, endothelial cells were selected by Dynabeads conjugated with ICAM-2 antibody (BD Pharmingen). Cells were used at passage 3 or 4. Bone marrow was isolated from the tibia and femur, peripheral blood mononuclear cells were isolated from peripheral blood by Histopaque 1077 (Sigma Aldrich), and peritoneal macrophages were isolated by a thioglycolate.
Western Blotting Analysis.
Cells or tissues were homogenized in RIPA lysis buffer (Millipore) with protease inhibitor mixture (Sigma) and phosphatase inhibitor mixture (Sigma). Lysates with a fixed protein concentration were subjected to SDS/PAGE, then gels were transferred to PVDF membranes. After blocking, membranes were incubated with primary antibodies at 4 °C overnight (listed in Table S1) and with appropriate secondary antibodies for 2 h. Membranes were developed using a chemiluminescent HRP substrate (Millipore). Blots were scanned and analyzed by ImageJ software (NIH).
Table S1.
Antibodies used for Western blotting and immunohistochemistry
| Name | Make | Product no. | Dilution |
| For Western blotting | |||
| IRβ | Santa Cruz | sc-711 | 1:1,000 |
| IGF1Rβ | Cell Signaling | 3027 | 1:1,000 |
| Phospho-IRβTyr1150/1151/IGF1RβTyr1135/1136 | Cell Signaling | 3024 | 1:1,000 |
| Akt (pan) | Cell Signaling | 4691 | 1:1,000 |
| Phospho-AktS473 | Cell Signaling | 9271 | 1:1,000 |
| ERK1/2 (p44/42-MAPK) | Cell Signaling | 9102 | 1:1,000 |
| Phospho-ERK1/2Thr202/Tyr204 | Cell Signaling | 9101 | 1:1,000 |
| IRS-1 | Cell Signaling | 2383 | 1:1,000 |
| Phospho-IRS1Tyr608(human), Tyr612(mouse) | Millipore | 09-432 | 1:1,000 |
| NOS3 (eNOS) | Santa Cruz | sc-376751 | 1:500 |
| ET-1 | Abcam | ab117757 | 1:1,000 |
| NeuN | Abcam | ab177487 | 1:1,000 |
| GFAP | Cell Signaling | 12389 | 1:1,000 |
| VE-cadherin | Abcam | ab33168 | 1:1,000 |
| ZO-1 | Abcam | ab59720 | 1:500 |
| GAPDH | Cell Signaling | 5174 | 1:1,000 |
| For immunohistochemistry | |||
| PIP3 (PtdIns(3,4,5)P3) | Echelon Biosciences | Z-G345 | 1:300 |
| GFP | Abcam | ab13970 | 1:500 |
| ZO-1 | Abcam | ab59720 | 1:300 |
Generation of Reporter Mice and Immunohistochemistry.
To evaluate gene recombination in endothelial cells in vivo, IRflox/flox: VE-Cdh-Cre+/− mice were bred with B6;129-Gt(ROSA)26Sortm2Sho/J (stock no. 004077; Jackson Laboratories). Brain and skeletal muscle sections of Cre-positive and Cre-negative mice were made. In brief, the mice were transcardially perfused with iced 0.1 M phosphate buffer (PB) followed by iced 4% paraformaldehyde (PFA). Brain and gastrocnemius with soleus muscle were removed and postfixed overnight at 4 °C with the same fixate. Brain was cryoprotected with 30% sucrose in 0.1 M PB for 2 d at 4 °C. The brain and muscle were then embedded in optimal cutting temperature (OCT) compound, and 20-µm frozen sections were made and subjected to immunohistochemical staining with GFP. Sections mounted onto the slide glass were incubated with anti-GFP antibody at 4 °C overnight, Alexa Fluor 488-conjugated second antibody for 2 h, and DyLight594-labeled Tomato Lectin for 20 min. Images were captured by a digital camera (Leica DFC 425) and analyzed by ImageJ software to optimize signal to background ratio (i.e., thresholding/background subtraction).
In Vivo Tissue Blood Flow Measurement.
Tissue blood flow was evaluated by a fluorescent microsphere technique (36). In brief, mice were fasted 4 h, anesthetized with ketamine/xylazine (80 and 12 mg/kg, i.p.; Sigma-Aldrich), and placed on a heating pad throughout the experiment. A suspension of fluorescent microspheres, 15-μm polystyrene (50 µL,FluoSpheres, yellow-green, F8842; Invitrogen) was injected via left ventricle. After 60 s, tissues were collected and homogenized in ethanolic KOH with 2% Tween 80 (vol/vol). Blue FluoSpheres (F8844) were used for recovery standard to microsphere loss during tissue processing. The content of microspheres in tissues was normalized for both recovery rate and tissue weight.
Systemic Insulin Stimulation in Vivo.
Mice were fasted overnight (16 h), and recombinant human insulin (100 IU/mL, 50 μL; Humalin R) or saline was injected via the inferior vena cava after anesthesia with Avertin (150 mg/kg, i.p.). During the experiment, mice were placed on a heating pad to prevent hypothermia. At 10 and 20 min after the injection, soleus muscle, liver, BAT, and brain were obtained after killing by decapitation. The brain was rapidly dissected into appropriate subregions using a Rodent Brain Matrix (ASI Instruments) on ice.
In Vivo Brain Permeability Assay.
Mice were fasted for 4 h, anesthetized with Avertin (150 mg/kg, i.p.), and placed on a heating pad throughout the experiment. Texas Red-conjugated dextran (2 mg/mL, 3 kDa, D-3328; Thermo Fisher Scientific) was slowly injected through the left jugular vein (10 mL/kg). Ten minutes after the injection, mice were euthanized by transcardial perfusion with iced 0.1 M PB followed by 4% PFA. Brain was removed to prepare frozen sections as above. Those were mounted onto glass slides and coverslipped with 90% glycerol-10% PBS (vol/vol). Images were captured by a digital camera (Leica DFC 425) and analyzed by ImageJ software as above.
Metabolic Assessments.
Body weight was measured by using a Sartorius BP610 balance. Blood was obtained by tail bleeding. Blood glucose, plasma insulin, leptin, C-peptide, TG, and FFA were determined by Glucometer (Bayer), ultrasensitive mouse insulin ELISA (Crystal Chem Inc.), mouse leptin ELISA (Crystal Chem Inc.), Mouse C-Peptide ELISA (Crystal Chem Inc.), L-Type Triglyceride M (WAKO), Free Fatty Acid Quantitation Kit (Sigma-Aldrich), respectively. Oral glucose tolerance test (2 g/kg) and i.p. ITT (0.75 or 1.25 IU/kg; Humalin R) were performed after 4-h fasting. In ITT, latency of insulin-induced hypoglycemic effect was calculated as a time to achieve half maximum reduction of blood glucose levels. Twenty-four hours of food intake was assessed in mice after acclimatization to individual housing for 3 d.
In Vivo Insulin Clearance Assay.
Mice were fasted 4 h, anesthetized with ketamine/xylazine (80 and 12 mg/kg, i.p.; Sigma-Aldrich), and placed on a heating pad throughout the experiment. Recombinant human insulin (1 IU/kg, 10 mL/kg) was injected through the jugular vein. Blood was obtained by tail cut, and plasma insulin and C-peptide concentrations were determined as described above. Single logarithmic plots for decay curve of insulin concentration in the plasma were not linear; thus, a two-compartment model was applied for analysis of kinetic parameters (54).
Statistics.
Data are presented as mean ± SEM. Differences were analyzed using a two-tailed unpaired t test or analyses of variance (ANOVA) followed by post hoc comparisons with Tukey’s test or Bonferroni correction. Statistical calculations were performed using GraphPad Prism software (GraphPad). A probability value less than 0.05 was considered as a significant different.
SI Materials and Methods
Quantitative Real-Time RT-PCR.
Total RNA was extracted from tissues by RNeasy kit (Qiagen) and reverse transcribed using a High Capacity cDNA Reverse Transcription kit (Applied Biosystems). The PCR amplification reaction was done using specific primers and IQ SYBR Green Supermix (Bio-Rad). Fluorescence was analyzed in a CFX384 Real-Time PCR Detection System (Bio-Rad). Each sample was run in duplicate or triplicate, and mRNA levels were normalized with Tata-binding protein (TBP) mRNA and analyzed by 2△△CT method. Gene-specific primers are listed in Table S2.
Table S2.
Primers used for PCR of mouse genes
| Name | Genes | Forward | Reverse |
| DNA | |||
| IRflox or IR+ | CTG AAT AGC TGA GAC CAC AG | GAT GTG CAC CCC ATG TCT G | |
| IRflox Delta | — | TCT ATC AAC CGT GCC TAG AG | |
| Cre26 | CCT GGA AAA TGC TTC TGT CCG | ||
| Cre36 | CAG GGT GTT ATA AGC AAT CCC | ||
| GFP | AGG TTC ATC TGC ACC G | TCC TTG AAG AAG ATG GTG CG | |
| GFP-control | CTA GGC CAC AGA ATT GAA AGA TCT | GTA GGT GGA AAT TCT AGC ATC ATC C | |
| mRNA | |||
| IR | Insr | AAA TGC AGG AAC TCT CGG AAG CCT | ACC TTC GAG GAT TTG GCA GAC CTT |
| IGF1R | Igf1r | ATC GCG ATT TCT GCG CCA ACA | TTC TTC TCT TCA TCG CCG CAG ACT |
| Leptin R | Lepr | AAT GAC GCA GGG CTG TAT GT | TCA GGC TCC AGA AGA AGA GG |
| NPY | Npy | AAG CCG GAC AAT CCG GGC CGA GG | GCT TTC CTC ATT AAG AGG TCT |
| POMC | Pomc | AGA CCT CCA TAG ATG TGT GGA | AGC GGA AGT GAC CCA TGA CGT |
| AgRP | Agrp | ATG CTG ACT GCA ATG TTG CTG | TGA GGC CAT TCA GAC TTA GAC |
| CART | Cartpt | ATC TAC TCT GCC GTG GAT GAT | TTC CTC ACT GCG CAC TGC TGT |
| IL1β | Il1b | GCA ACT GTT CCT GAA CTC AAC T | ATC TTT TGG GGT CCG TCA ACT |
| IL6 | Il6 | TAG TCC TTC CTA CCC CAA TTT CC | TTG GTC CTT AGC CAG TCC TTC |
| TNFα | Tnf | ACG GCA TGG ATC TCA AAG AC | AGA TAG CAA ATC GGC TGA CG |
| NFκb1 | Nfkb1 | TCC ACT GTC TGC CTC TCT CGT C | GCC TTC AAT AGG TCC TTC CTG C |
| NFκb2 | Nfkb2 | TGA CCT CAC TTG CAG TAC CA | GTA TGT GTC CAC CAG GCT TC |
| Ikbkb | Ikbkb | GCT GCT GCT TCA GGC AAT CC | TGT CTG GGC TTC CAC TCA CG |
| iNOS | NOS2 | GTG TTC CAC CAG GAG ATG TTG | CTC CTG CCC ACT GAG TTC GTC |
| VE-cadherin | Cdh5 | TCC TCT GCA TCC TCA CTA TCA CA | GTA AGT GAC CAA CTG CTC GTG AAT |
| Tie-2 | TEK | GAT TTT GGA TTG TCC CGA GGT CAA G | CAC CAA TAT CTG GGC AAA TGA TGG |
| TBP | Tbp | ACC CTT CAC CAA TGA CTC CTA TG | TGA CTG CAG CAA ATC GCT TGG |
In Vivo FITC-Insulin Infusion Study.
Mice were fasted for 4 h, anesthetized with Avertin (150 mg/kg, i.p.), and placed on a heating pad throughout the experiment. First, a polyethylene tube connected to an infusion pump was implanted into the left jugular vein. Then, fluoroisothiocyanate (FITC)-labeled insulin was infused for 10 min at 14 mU·kg−1·min−1. At 10 min after FITC-insulin infusion, DyLight594-labeled Lycopersicon Esculentum (Tomato) Lectin (1 mg/kg; DL-1177; Vector Laboratory) was injected through the left jugular vein. Two minutes after the lectin injection, animals were euthanized by transcardial perfusion with 15 mL of iced 0.1 M phosphate buffer (PB) followed by 15 mL of iced 4% (wt/vol) PFA in 0.1 M PB. Brain and skeletal muscle were quickly removed, postfixed in 4% PFA in 0.1 M PB overnight at 4 °C, and only brain was cryoprotected in 30% (wt/vol) sucrose in 0.1 M PB for another 2 d at 4 °C. Tissues were embedded in OCT compound and stored at −20 °C until use. Frozen sections were made at 20-µm thickness using a cryostat, mounted onto the slide glass. After serial washing with 0.1 M PB, sections were cover-slipped with 90% glycerol-10% PBS (vol/vol). FITC and DyLight594 signals were captured by a digital camera (Leica DFC 425), and images were analyzed by ImageJ software to optimize signal to background ratio (i.e., thresholding/background subtraction). FITC-insulin binding in the frontal cortex area was estimated by relative FITC-positive area normalized by DyLight594-positive area.
Immunohistochemistry of PIP3 Expression in the Brain.
Mice were fasted overnight (16 h) and anesthetized with Avertin (150 mg/kg, i.p.) and placed on a heat pad throughout the experiment. Recombinant human insulin (100 IU/mL, 50 µL) or an equal volume of saline was injected into the inferior vena cava. Ten minutes after the injection, mice were transcardially perfused with 15 mL of iced 0.1 M PB followed by 15 mL of iced 4% PFA in 0.1 M PB. Brains were removed and postfixed for overnight at 4 °C with the same fixate, and cryoprotected with 30% sucrose in 0.1 M PB for 2 d at 4 °C. Brains were embedded in OCT compounds. Coronal frozen sections (20 µm) were made using a cryostat and subjected to immunohistochemical staining for PIP3. Free-floating brain sections were blocked with 2.5% normal goat serum and incubated with FITC-conjugated PIP3 antibody (listed in Table S1) for overnight at 4 °C. After serial wash with 0.1 M PB, sections were mounted onto glass slides and coverslipped with 90% glycerol-10% PBS. FITC signals were captured by a digital camera (Leica DFC 425), and images were analyzed by ImageJ software (NIH) to optimize signal to background ratio (i.e., thresholding/background subtraction). PIP3 levels in the frontal cortex area was estimated by FITC-positive area relative to total brain area.
Ex Vivo Insulin Stimulation to Isolated Muscle.
Mice were fasted overnight (16 h) and anesthetized with Avertin (150 mg/kg, i.p.). After transcardial perfusion with 15 mL of iced PBS, soleus muscle was carefully removed from each legs and incubated with Hibernate A medium (BrainBitz) at 37 °C for 10 min. Then, muscle tissues were transferred to medium containing recombinant human insulin (50 nM; Humalin R) or the same volume of PBS. The tissues were incubated for additional 10 min at 37 °C, and quickly frozen at −80 °C until further processing.
Systemic Insulin Stimulation in Vivo with l-NAME Pretreatment.
Mice were fasted overnight (16 h), and l-NAME (100 mg·10 mL−1·kg−1; Sigma) solution or control saline was i.p. injected. At 30 min after l-NAME or saline injection, recombinant human insulin (100 IU/mL, 50 μL; Humalin R) or saline was injected via the inferior vena cava after anesthesia with Avertin (150 mg/kg, i.p.). During the experiment, mice were placed on a heating pad to prevent hypothermia. At 10 min after the insulin injection, soleus muscle was obtained after killing by decapitation.
In Vivo i.c.v. Insulin Stimulation to Brain.
Mice were fasted overnight (16 h) and anesthetized with Avertin (150 mg/kg, i.p.). They were placed on the stereotaxic apparatus with a heating pad underneath the body. Recombinant human insulin (500 µU/μL, 2 µL) or the same volume of saline was injected into the lateral ventricle with a 31G cannula tubing connected to a Hamilton microsyringe through a hole drilled on the skull. The coordinate for injection site was bregma −0.2 mm, lateral from the midline 1.1 mm, and ventral from the skull surface 2.5 mm according to the Paxinos and Watson Mouse Brain Atlas. At 10 min after the injection, cannula was removed, and brain was isolated from the body after decapitation, quickly segmentalized, and frozen at −80 °C until further processing.
Additional Metabolic Assessments.
Distribution of insulin-stimulated glucose uptake activity was assessed. Mice were fasted for 4 h, anesthetized with Avertin (150 mg/kg, i.p.), and placed on a heating pad throughout the experiment. Mice were injected with 1 mU/g insulin in combination with 0.33 µCi [14C]-2-deoxyglucose per gram of mouse body weight administered via jugular vein. Blood samples were taken 5, 15, 30, and 45 min after insulin injection for the determination of glucose and [14C] levels. Then, animals were killed by cervical dislocation and tissues were collected. [14C]-2-deoxyglucose levels were quantified in tissues using a perchloric acid and Ba(OH)2/ZnSO4 precipitation procedure. Standardized uptake values were calculated by the ratio of tissue radioactivity in injected total radioactivity.
Food Intake Measurement in Fasting-Refeeding Condition.
Mice were acclimatized to individual housing for 3 d before food intake measurements. They were fasted (16 h) overnight and refed with standard chow diet, then food intake was measured for another 24 h after refeeding. After measurements, mice were returned to home cages with original housemates.
Acknowledgments
We thank Ms. Christie Penniman and Mr. Antonio Gomes for technical assistance and Dr. Rebecca Chafel in Brandeis University for animal care. This work was supported by NIH Grants R21 CA185196 (to C.R.-M.) and R01 DK031036 (to C.R.K.). Core laboratory support was from the National Institute of Diabetes and Digestive and Kidney Diseases-funded Joslin Diabetes and Endocrinology Research Center grant.
Footnotes
Conflict of interest statement: Masahiro Konishi is an employee of Daiichi Sankyo and was on sabbatical leave at Joslin Diabetes Center when the study was completed.
This article contains supporting information online at www.pnas.org/lookup/suppl/doi:10.1073/pnas.1710625114/-/DCSupplemental.
References
- 1.Rask-Madsen C, Kahn CR. Tissue-specific insulin signaling, metabolic syndrome, and cardiovascular disease. Arterioscler Thromb Vasc Biol. 2012;32:2052–2059. doi: 10.1161/ATVBAHA.111.241919. [DOI] [PMC free article] [PubMed] [Google Scholar]
- 2.Laakso M, Kuusisto J. Insulin resistance and hyperglycaemia in cardiovascular disease development. Nat Rev Endocrinol. 2014;10:293–302. doi: 10.1038/nrendo.2014.29. [DOI] [PubMed] [Google Scholar]
- 3.Schubert M, et al. Role for neuronal insulin resistance in neurodegenerative diseases. Proc Natl Acad Sci USA. 2004;101:3100–3105. doi: 10.1073/pnas.0308724101. [DOI] [PMC free article] [PubMed] [Google Scholar]
- 4.Biessels GJ, Reagan LP. Hippocampal insulin resistance and cognitive dysfunction. Nat Rev Neurosci. 2015;16:660–671. doi: 10.1038/nrn4019. [DOI] [PubMed] [Google Scholar]
- 5.Kleinridders A, et al. Insulin resistance in brain alters dopamine turnover and causes behavioral disorders. Proc Natl Acad Sci USA. 2015;112:3463–3468. doi: 10.1073/pnas.1500877112. [DOI] [PMC free article] [PubMed] [Google Scholar]
- 6.Aird WC. Phenotypic heterogeneity of the endothelium: I. Structure, function, and mechanisms. Circ Res. 2007;100:158–173. doi: 10.1161/01.RES.0000255691.76142.4a. [DOI] [PubMed] [Google Scholar]
- 7.Aird WC. Phenotypic heterogeneity of the endothelium: II. Representative vascular beds. Circ Res. 2007;100:174–190. doi: 10.1161/01.RES.0000255690.03436.ae. [DOI] [PubMed] [Google Scholar]
- 8.Cogger VC, et al. Three-dimensional structured illumination microscopy of liver sinusoidal endothelial cell fenestrations. J Struct Biol. 2010;171:382–388. doi: 10.1016/j.jsb.2010.06.001. [DOI] [PMC free article] [PubMed] [Google Scholar]
- 9.Abbott NJ, Patabendige AAK, Dolman DEM, Yusof SR, Begley DJ. Structure and function of the blood-brain barrier. Neurobiol Dis. 2010;37:13–25. doi: 10.1016/j.nbd.2009.07.030. [DOI] [PubMed] [Google Scholar]
- 10.King GL, Johnson SM. Receptor-mediated transport of insulin across endothelial cells. Science. 1985;227:1583–1586. doi: 10.1126/science.3883490. [DOI] [PubMed] [Google Scholar]
- 11.Wang H, Liu Z, Li G, Barrett EJ. The vascular endothelial cell mediates insulin transport into skeletal muscle. Am J Physiol Endocrinol Metab. 2006;291:E323–E332. doi: 10.1152/ajpendo.00047.2006. [DOI] [PubMed] [Google Scholar]
- 12.Wang H, Wang AX, Liu Z, Barrett EJ. Insulin signaling stimulates insulin transport by bovine aortic endothelial cells. Diabetes. 2008;57:540–547. doi: 10.2337/db07-0967. [DOI] [PubMed] [Google Scholar]
- 13.Chernick SS, Gardiner RJ, Scow RO. Restricted passage of insulin across capillary endothelium in perfused rat adipose tissue. Am J Physiol. 1987;253:E475–E480. doi: 10.1152/ajpendo.1987.253.5.E475. [DOI] [PubMed] [Google Scholar]
- 14.Bar RS, Boes M, Sandra A. Vascular transport of insulin to rat cardiac muscle. Central role of the capillary endothelium. J Clin Invest. 1988;81:1225–1233. doi: 10.1172/JCI113439. [DOI] [PMC free article] [PubMed] [Google Scholar]
- 15.Schwartz MW, et al. Evidence for entry of plasma insulin into cerebrospinal fluid through an intermediate compartment in dogs. Quantitative aspects and implications for transport. J Clin Invest. 1991;88:1272–1281. doi: 10.1172/JCI115431. [DOI] [PMC free article] [PubMed] [Google Scholar]
- 16.Baura GD, et al. Saturable transport of insulin from plasma into the central nervous system of dogs in vivo. A mechanism for regulated insulin delivery to the brain. J Clin Invest. 1993;92:1824–1830. doi: 10.1172/JCI116773. [DOI] [PMC free article] [PubMed] [Google Scholar]
- 17.Yu Y, Kastin AJ, Pan W. Reciprocal interactions of insulin and insulin-like growth factor I in receptor-mediated transport across the blood-brain barrier. Endocrinology. 2006;147:2611–2615. doi: 10.1210/en.2006-0020. [DOI] [PubMed] [Google Scholar]
- 18.Banks WA, Owen JB, Erickson MA. Insulin in the brain: There and back again. Pharmacol Ther. 2012;136:82–93. doi: 10.1016/j.pharmthera.2012.07.006. [DOI] [PMC free article] [PubMed] [Google Scholar]
- 19.Gray SM, Meijer RI, Barrett EJ. Insulin regulates brain function, but how does it get there? Diabetes. 2014;63:3992–3997. doi: 10.2337/db14-0340. [DOI] [PMC free article] [PubMed] [Google Scholar]
- 20.Steinberg HO, Brechtel G, Johnson A, Fineberg N, Baron AD. Insulin-mediated skeletal muscle vasodilation is nitric oxide dependent. A novel action of insulin to increase nitric oxide release. J Clin Invest. 1994;94:1172–1179. doi: 10.1172/JCI117433. [DOI] [PMC free article] [PubMed] [Google Scholar]
- 21.Zeng G, Quon MJ. Insulin-stimulated production of nitric oxide is inhibited by wortmannin. Direct measurement in vascular endothelial cells. J Clin Invest. 1996;98:894–898. doi: 10.1172/JCI118871. [DOI] [PMC free article] [PubMed] [Google Scholar]
- 22.Morita S, Miyata S. Accessibility of low-molecular-mass molecules to the median eminence and arcuate hypothalamic nucleus of adult mouse. Cell Biochem Funct. 2013;31:668–677. doi: 10.1002/cbf.2953. [DOI] [PubMed] [Google Scholar]
- 23.Barrett EJ, et al. The vascular actions of insulin control its delivery to muscle and regulate the rate-limiting step in skeletal muscle insulin action. Diabetologia. 2009;52:752–764. doi: 10.1007/s00125-009-1313-z. [DOI] [PMC free article] [PubMed] [Google Scholar]
- 24.Kubota T, et al. Impaired insulin signaling in endothelial cells reduces insulin-induced glucose uptake by skeletal muscle. Cell Metab. 2011;13:294–307. doi: 10.1016/j.cmet.2011.01.018. [DOI] [PubMed] [Google Scholar]
- 25.Kondo T, et al. Knockout of insulin and IGF-1 receptors on vascular endothelial cells protects against retinal neovascularization. J Clin Invest. 2003;111:1835–1842. doi: 10.1172/JCI17455. [DOI] [PMC free article] [PubMed] [Google Scholar]
- 26.Vicent D, et al. The role of endothelial insulin signaling in the regulation of vascular tone and insulin resistance. J Clin Invest. 2003;111:1373–1380. doi: 10.1172/JCI15211. [DOI] [PMC free article] [PubMed] [Google Scholar]
- 27.Alva JA, et al. VE-Cadherin-Cre-recombinase transgenic mouse: A tool for lineage analysis and gene deletion in endothelial cells. Dev Dyn. 2006;235:759–767. doi: 10.1002/dvdy.20643. [DOI] [PubMed] [Google Scholar]
- 28.Rask-Madsen C, et al. Loss of insulin signaling in vascular endothelial cells accelerates atherosclerosis in apolipoprotein E null mice. Cell Metab. 2010;11:379–389. doi: 10.1016/j.cmet.2010.03.013. [DOI] [PMC free article] [PubMed] [Google Scholar]
- 29.Mauer J, et al. Myeloid cell-restricted insulin receptor deficiency protects against obesity-induced inflammation and systemic insulin resistance. PLoS Genet. 2010;6:e1000938. doi: 10.1371/journal.pgen.1000938. [DOI] [PMC free article] [PubMed] [Google Scholar]
- 30.Ussar S, et al. Interactions between gut microbiota, host genetics and diet modulate the predisposition to obesity and metabolic syndrome. Cell Metab. 2015;22:516––530, and correction (2016) 23:564–566. doi: 10.1016/j.cmet.2015.07.007. [DOI] [PMC free article] [PubMed] [Google Scholar]
- 31.Vincent MA, Barrett EJ, Lindner JR, Clark MG, Rattigan S. Inhibiting NOS blocks microvascular recruitment and blunts muscle glucose uptake in response to insulin. Am J Physiol Endocrinol Metab. 2003;285:E123–E129. doi: 10.1152/ajpendo.00021.2003. [DOI] [PubMed] [Google Scholar]
- 32.Baron AD, et al. Interaction between insulin sensitivity and muscle perfusion on glucose uptake in human skeletal muscle: Evidence for capillary recruitment. Diabetes. 2000;49:768–774. doi: 10.2337/diabetes.49.5.768. [DOI] [PubMed] [Google Scholar]
- 33.Scherrer U, Randin D, Vollenweider P, Vollenweider L, Nicod P. Nitric oxide release accounts for insulin’s vascular effects in humans. J Clin Invest. 1994;94:2511–2515. doi: 10.1172/JCI117621. [DOI] [PMC free article] [PubMed] [Google Scholar]
- 34.Laakso M, Edelman SV, Brechtel G, Baron AD. Decreased effect of insulin to stimulate skeletal muscle blood flow in obese man. A novel mechanism for insulin resistance. J Clin Invest. 1990;85:1844–1852. doi: 10.1172/JCI114644. [DOI] [PMC free article] [PubMed] [Google Scholar]
- 35.Baron AD, Brechtel G. Insulin differentially regulates systemic and skeletal muscle vascular resistance. Am J Physiol. 1993;265:E61–E67. doi: 10.1152/ajpendo.1993.265.1.E61. [DOI] [PubMed] [Google Scholar]
- 36.Serrat MA. Measuring bone blood supply in mice using fluorescent microspheres. Nat Protoc. 2009;4:17494–1758. doi: 10.1038/nprot.2009.190. [DOI] [PubMed] [Google Scholar]
- 37.Duckworth WC, Bennett RG, Hamel FG. Insulin degradation: Progress and potential. Endocr Rev. 1998;19:608–624. doi: 10.1210/edrv.19.5.0349. [DOI] [PubMed] [Google Scholar]
- 38.Li G, Barrett EJ, Wang H, Chai W, Liu Z. Insulin at physiological concentrations selectively activates insulin but not insulin-like growth factor I (IGF-I) or insulin/IGF-I hybrid receptors in endothelial cells. Endocrinology. 2005;146:4690–4696. doi: 10.1210/en.2005-0505. [DOI] [PubMed] [Google Scholar]
- 39.Steil GM, Ader M, Moore DM, Rebrin K, Bergman RN. Transendothelial insulin transport is not saturable in vivo. No evidence for a receptor-mediated process. J Clin Invest. 1996;97:1497–1503. doi: 10.1172/JCI118572. [DOI] [PMC free article] [PubMed] [Google Scholar]
- 40.Hamilton-Wessler M, et al. Mode of transcapillary transport of insulin and insulin analog NN304 in dog hindlimb: Evidence for passive diffusion. Diabetes. 2002;51:574–582. doi: 10.2337/diabetes.51.3.574. [DOI] [PubMed] [Google Scholar]
- 41.Wang H, Wang AX, Barrett EJ. Insulin-induced endothelial cell cortical actin filament remodeling: A requirement for trans-endothelial insulin transport. Mol Endocrinol. 2012;26:1327–1338. doi: 10.1210/me.2012-1003. [DOI] [PMC free article] [PubMed] [Google Scholar]
- 42.Havrankova J, Roth J, Brownstein M. Insulin receptors are widely distributed in the central nervous system of the rat. Nature. 1978;272:827–829. doi: 10.1038/272827a0. [DOI] [PubMed] [Google Scholar]
- 43.Baskin DG, Porte D, Jr, Guest K, Dorsa DM. Regional concentrations of insulin in the rat brain. Endocrinology. 1983;112:898–903. doi: 10.1210/endo-112-3-898. [DOI] [PubMed] [Google Scholar]
- 44.Werther GA, et al. Localization and characterization of insulin receptors in rat brain and pituitary gland using in vitro autoradiography and computerized densitometry. Endocrinology. 1987;121:1562–1570. doi: 10.1210/endo-121-4-1562. [DOI] [PubMed] [Google Scholar]
- 45.Banks WA, Kastin AJ. Differential permeability of the blood-brain barrier to two pancreatic peptides: Insulin and amylin. Peptides. 1998;19:883–889. doi: 10.1016/s0196-9781(98)00018-7. [DOI] [PubMed] [Google Scholar]
- 46.Freiherr J, et al. Intranasal insulin as a treatment for Alzheimer’s disease: A review of basic research and clinical evidence. CNS Drugs. 2013;27:505–514. doi: 10.1007/s40263-013-0076-8. [DOI] [PMC free article] [PubMed] [Google Scholar]
- 47.Brüning JC, et al. Role of brain insulin receptor in control of body weight and reproduction. Science. 2000;289:2122–2125. doi: 10.1126/science.289.5487.2122. [DOI] [PubMed] [Google Scholar]
- 48.Obici S, Feng Z, Karkanias G, Baskin DG, Rossetti L. Decreasing hypothalamic insulin receptors causes hyperphagia and insulin resistance in rats. Nat Neurosci. 2002;5:566–572. doi: 10.1038/nn0602-861. [DOI] [PubMed] [Google Scholar]
- 49.Carvalheira JB, et al. Cross-talk between the insulin and leptin signaling systems in rat hypothalamus. Obes Res. 2005;13:48–57. doi: 10.1038/oby.2005.7. [DOI] [PubMed] [Google Scholar]
- 50.Cheng A, et al. Attenuation of leptin action and regulation of obesity by protein tyrosine phosphatase 1B. Dev Cell. 2002;2:497–503. doi: 10.1016/s1534-5807(02)00149-1. [DOI] [PubMed] [Google Scholar]
- 51.Zabolotny JM, et al. PTP1B regulates leptin signal transduction in vivo. Dev Cell. 2002;2:489–495. doi: 10.1016/s1534-5807(02)00148-x. [DOI] [PubMed] [Google Scholar]
- 52.Brüning JC, et al. A muscle-specific insulin receptor knockout exhibits features of the metabolic syndrome of NIDDM without altering glucose tolerance. Mol Cell. 1998;2:559–569. doi: 10.1016/s1097-2765(00)80155-0. [DOI] [PubMed] [Google Scholar]
- 53.Kulkarni RN, et al. Tissue-specific knockout of the insulin receptor in pancreatic β cells creates an insulin secretory defect similar to that in type 2 diabetes. Cell. 1999;96:329–339. doi: 10.1016/s0092-8674(00)80546-2. [DOI] [PubMed] [Google Scholar]
- 54.Schilling RJ, Mitra AK. Pharmacodynamics of insulin following intravenous and enteral administrations of porcine-zinc insulin to rats. Pharm Res. 1992;9:1003–1009. doi: 10.1023/a:1015894125611. [DOI] [PubMed] [Google Scholar]


