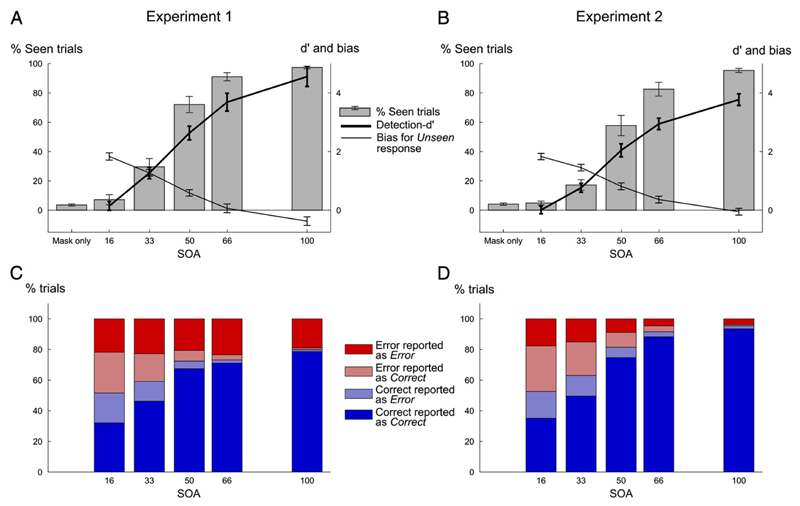
Fig. 2.
Visibility and performance results according to SOA for experiment 1 (left column) and 2 (right column). (A–B) Visibility ratings, expressed as the proportion of seen responses (left axis ranging from 0 to 100%) as a function of SOA. The thick line represents detection-d′ values (right axis, ranging from 0 to 4) while the thin line represents response bias towards unseen response (same scale as detection-d′), for each SOA. (C-D) Percentage of each category of trials according to actual objective performance and subjective report of performance (Error trials correctly classified as Error in dark red, Correct trials correctly classified as Correct in dark blue, Error trials incorrectly classified as Correct in light red and Correct trials incorrectly classified as Error in light blue), for each SOA.

