Abstract
Pure tense (T) and relaxed (R) quaternary state polymerized human hemoglobins (PolyhHbs) were synthesized and their biophysical properties characterized, along with mixtures of T- and R-state PolyhHbs. It was observed that the oxygen affinity of PolyhHb mixtures varied linearly with T-state mole fraction. Computational analysis of PolyhHb facilitated oxygenation of a single fiber in a hepatic hollow fiber (HF) bioreactor was performed to evaluate the oxygenation potential of T- and R-state PolyhHb mixtures. PolyhHb mixtures with T-state mole fractions greater than 50% resulted in hypoxic and hyperoxic zones occupying less than 5% of the total extra capillary space (ECS). Under these conditions, the ratio of the pericentral volume to the perivenous volume in the ECS doubled as the T-state mole fraction increased from 50 to 100%. These results show the effect of varying the T/R-state PolyhHb mole fraction on oxygenation of tissue-engineered constructs and their potential to oxygenate tissues.
Introduction
A major challenge in tissue engineering is provision of physiologically relevant oxygenation to cells cultured within tissue-engineered constructs [1]. Perfusion/static culture solutions without an O2 carrier cannot adequately oxygenate tissue-engineered constructs without the presence of significant hypoxic or hyperoxic regions [2]. A suitable alternative may consist of red blood cell (RBC) perfusion of the tissue culture in order to improve tissue oxygenation. Unfortunately, RBC perfusion may be plagued with issues ranging from short ex vivo storage shelf-life (i.e. 42 days) [3], limited supply [4,5], risk of transmission of unidentified pathogens [6], and RBC hemolysis [7]. In light of these challenges, hemoglobin (Hb)-based oxygen (O2) carriers (HBOCs) have emerged as promising candidates for use as universal RBC substitutes in tissue engineering applications [8–13].
Our group has synthesized variable molecular weight (MW) HBOCs with low and high O2 affinities [14–18] for use as RBC substitutes. These materials are based on glutaraldehyde polymerization of Hb in either the low O2 affinity (i.e. tense (T)) or high O2 affinity (i.e. relaxed (R)) quaternary state. In these studies, the T- or R-state PolyHbs either have low or high O2 affinity, however many applications exist where it may be desirable to tune the O2 affinity of the PolyHb solution to facilitate targeted O2 delivery based on varying oxygenation requirements of tissues.
The current study expands upon the work of Zhang et al. [17] and Zhou et al. [18], who synthesized and characterized the biophysical properties of bovine and human PolyHbs in either T- or R-state. In this study, pure T- and R-state polymerized human Hb (PolyhHb) solutions were synthesized, characterized and mixed at different molar ratios to yield PolyhHb mixtures with varying O2 affinities and biophysical properties. To assess the ability of the PolyhHb mixtures to oxygenate tissue engineered constructs, we developed a computational model of a single hollow fiber (HF) in a HF bioreactor housing hepatocytes (i.e. bio-artificial liver assist device), where the inlet partial pressure of O2 (pO2), mixture fraction, and total PolyhHb concentration were varied to assess oxygenation within the device. In vivo, the O2 tension gradient sensed by hepatocytes is thought to play an important role in the establishment of functional zonation along the acinus, which is integral to the proper functioning of the liver [19]. HF bioreactors mimic the microenvironment of a blood vessel via the continuously circulating media in the HF lumen that transports nutrients and O2 to the cells, while washing away metabolic waste products from the cells housed in the ECS. Therefore, this mathematical model can be used to assess the oxygenation potential of mixtures of T- and R-state PolyhHbs in tissue engineered constructs.
Materials and methods
Materials
Glutaraldehyde (50–70%), NaCl (sodium chloride), KCl (potassium chloride), NaOH (sodium hydroxide), Na2S2O4 (sodium dithionite), CaCl2.2H2O (calcium chloride), sodium lactate, N-acetyl-L-cysteine (NALC), NaCNBH3 (sodium cyanoborohydride), NaBH4 (sodium borohydride), Na2HPO4 (sodium phosphate dibasic), and NaH2PO4 (sodium phosphate monobasic) were procured from Sigma-Aldrich (St. Louis, MO). The HF tangential flow filtration (TFF) modules (rated pore sizes: 0.2 μm, 50 nm, 500 kDa, and 100 kDa) were purchased from Spectrum Laboratories (Rancho Dominguez, CA). K3FeCN6 (potassium ferricyanide), KCN (potassium cyanide) and all other chemicals were purchased from Fisher Scientific (Pittsburgh, PA). Expired human RBC units were generously donated by Transfusion Services, Wexner Medical Center, The Ohio State University, Columbus, Ohio.
Hb purification
Human Hb (hHb) was purified via TFF as described by Palmer et al. [20].
Synthesis of PolyhHb
Deoxygenated and oxygenated hHb were polymerized with glutaraldehyde using methods developed previously [16,17] to yield 35:1 (molar ratio of glutaraldehyde to hHb) tense (T) and 30:1 relaxed (R) state PolyhHb, respectively.
To prepare 35:1 (molar ratio of glutaraldehyde to hHb) T-state (deoxygenated) PolyhHb, the hHb solution is devoid of dissolved O2 prior to and during the polymerization reaction. Presence of minute quantities of dissolved O2 will lead to formation of PolyhHb that is not exclusively in the T-state. To synthesize 30:1 R-state (oxygenated) PolyhHb, the Hb solution is fully saturated with O2 prior to and after the polymerization reaction to yield PolyhHb molecules exclusively in the R-state.
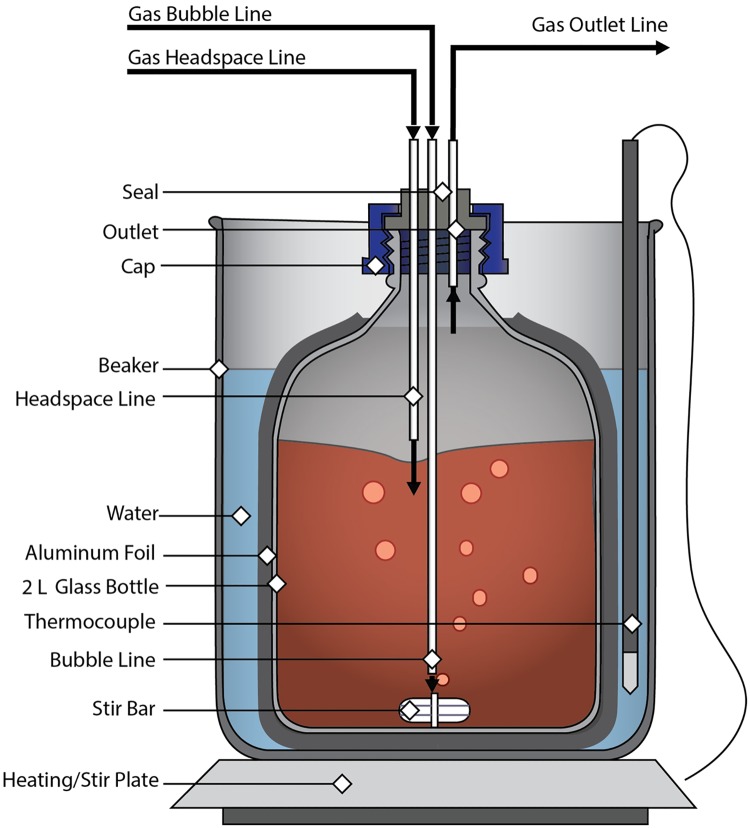
To generate completely deoxygenated hHb, 30–33 g freshly thawed hHb was diluted in PBS (0.1 M, pH 7.4) at room temperature in a total volume of 1200 mL. The diluted hHb solution was placed inside a sealed, air-tight glass bottle under continuous stirring. The glass bottle was placed in a water-bath to maintain the temperature of the hHb solution at 37°C. Long stainless steel needles were used to de-gas the hHb solution by alternate cycles of charging the headspace with N2 gas, and bubbling N2 through the hHb solution. After 35–45 min of degassing, samples were drawn from the bottle using a long stainless steel needle to measure the pO2 of the hHb solution using a Rapidlab 248 (Siemens, Malvern, PA) blood gas analyzer. When the measured pO2 of the hHb solution dropped to < 20 mm Hg, Na2S2O4 was added to the reaction vessel to remove residual O2 from the hHb solution [17]. 300 mg Na2S2O4 was dissolved in 300 mL N2 sparged PBS (0.1 M, pH 7.4) at room temperature, the Na2S2O4 solution was added to the hHb solution dropwise using a pump set to a flowrate of 0.1 mL/s. To confirm complete deoxygenation, the pO2 of the hHb solution was measured at the end of the titration process. Once the pO2 was out of range (pO2 < 0 mm Hg), an additional 200 mg Na2S2O4 was added to the hHb solution in 50 mg increments dissolved in 1 mL N2 sparged PBS in 5 minute intervals using a syringe.
Completely deoxygenated hHb was then polymerized using a 35:1 molar ratio of glutaraldehyde to hHb. The glutaraldehyde solution was prepared by diluting the necessary volume of glutaraldehyde with 5–10 mL of degassed PBS (0.1 M, pH 7.4). A 10 mL syringe was used to add the glutaraldehyde solution dropwise to the deoxygenated hHb under continuous stirring. The polymerization reaction was allowed to proceed at 37°C for 2 h in the absence of light under a N2 atmosphere.
R-state hHb was prepared by saturating 1500 mL of a 20 mg/mL hHb solution with pure O2 gas for a period of 1–1.5 h at 37°C. Long stainless steel needles were used to oxygenate the hHb solution with alternate cycles of charging the headspace with O2 gas and bubbling O2 through the hHb solution. Complete O2-saturation of hHb solution was confirmed by measuring the pO2 of the hHb solution (pO2 > 749 mm Hg) [17]. Oxygenated hHb was then polymerized at a 30:1 molar ratio of glutaraldehyde to hHb. The glutaraldehyde solution was prepared by diluting the necessary volume of glutaraldehyde with 5–10 mL of oxygenated PBS (0.1 M, pH 7.4). A 10 mL syringe was used to add the glutaraldehyde solution dropwise to oxygenated hHb under continuous stirring. The polymerization reaction was allowed to proceed at 37°C for 2 h in the absence of light under an O2 atmosphere [17]. A schematic of the reactor setup used is shown in Fig 1.
Fig 1. Schematic of the PolyhHb reactor vessel.
This figure shows the glass bottle bench scale polymerization reactor used in our process to synthesize both the tense and relaxed state PolyhHb.
To reduce the resultant Schiff bases and the methemoglobin (metHb) level of the PolyhHb solution, 6–8 mL of 6–8 M NaCNBH3 in PBS (0.1 M, pH 7.4) was added to the reaction vessel at the end of the reaction. The PolyhHb reaction vessel was placed in an ice-bath under continuous stirring for 30 min. Finally, 15–20 mL of freshly made 2 M NaBH4 was injected into the reaction vessel to reduce unreacted aldehydes. NaBH4 and NaCNBH3 were used in conjunction, since they reduce Schiff bases and free aldehyde in solution [16,17,21]. The pO2 of the hHb solution was monitored before and after polymerization to ensure that the polymerization reaction was carried out with hHb in the desired quaternary state (T- or R-state).
Diafiltration of PolyhHb
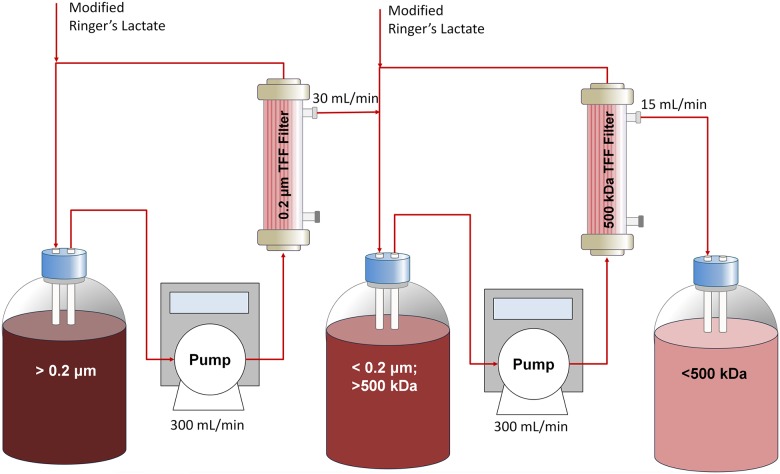
Small hHb polymers, reduced glutaraldehyde, and excess quenching reagents were removed from the synthesized PolyhHb solutions using a diafiltration protocol developed in our lab. PolyhHb solutions were passed through 0.2 μm TFF modules to remove large particles. PolyhHb solutions were then buffer exchanged in an isotonic modified Ringer’s lactate buffer (NaCl 115 mmol/L, KCl 4 mmol/L, CaCl2.2H2O 1.4 mmol/L, NaOH 13 mmol/L, sodium lactate 27 mmol/L, and NALC 12.3 mmol/L). The PolyhHb solutions were subjected to 8–9 cycles of diafiltration (4°C) on 500 kDa TFF modules at a 1:9 (v/v) ratio of PolyhHb to modified Ringer’s lactate buffer. Fig 2 shows a schematic of the diafiltration setup used in the study. This process was performed at 4°C under ambient air conditions.
Fig 2. Diafiltration, purification, and concentration schematic.
Shown in this figure is the multistage tangential flow filtration process for processing the polymerized PolyhHb.
The filtrate from the 9th diafiltration cycle was collected and measured via UV-visible spectroscopy to verify complete removal of small hHb species. Buffer-exchanged PolyhHb solutions were concentrated on 500 kDa TFF cartridges (Spectrum Labs, Rancho Dominguez, CA). The resulting concentrated PolyhHb solutions were stored at -80°C. Sterile lab supplies were used for all experiments. All tubing, glassware, and filters were de-contaminated by immersing them overnight in 1 M NaOH and then rinsing thoroughly with double distilled de-ionized water.
Preparation of T- and R-State PolyhHb mixtures
Stock solutions of 35:1 T-state PolyhHb and 30:1 R-state PolyhHb having the same molar concentration (on a heme basis) were prepared. These stock solutions were mixed at different molar ratios i.e. 0.25:0.75, 0.5:0.5, and 0.75:0.25 to yield mixtures of T- and R-state PolyhHbs.
Hydrodynamic diameter of PolyhHb
The hydrodynamic diameter of PolyhHb was measured using a Zetasizer Nano Dynamic Light Scattering (DLS) spectrometer (Malvern Instruments Ltd., Worcestershire, United Kingdom) at 37°C [21]. The PolyhHb solutions were diluted to a final concentration of ~ 2 mg/mL using PBS (0.1 M, pH 7.4). An internal heating system and temperature controller maintained the sample temperature at 37°C [21].
Methemoglobin level and protein concentration of hHb/PolyhHb
The cyanomethemoglobin method was used to measure the methemoglobin (metHb) level of hHb/PolyhHb solutions [22,23]. The Bradford assay was performed using the Coomassie Plus protein assay kit (Pierce Biotechnology, Rockford, IL) to estimate the total protein concentration in solution [17,24].
O2–hHb/PolyhHb equilibria measurements
O2-hHb/PolyhHb equilibrium binding curves were generated using a Hemox Analyzer (TCS Scientific Corp., New Hope, PA) at 37°C (physiological temperature) as described in the literature. The Hill equation (Eq 1) was used to fit the OEC obtained for hHb/PolyhHb [22,25].
| (1) |
Where Abs is the measured absorbance of the sample, A0 and A∞ correspond to the sample absorbance at 0 mm Hg and at maximum saturation, respectively. The P50 (partial pressure of O2 at which 50% of the hHb/PolyhHb is saturated with O2) and the cooperative coefficient (n) of hHb/PolyhHb were regressed by fitting the OECs to Eq 1 [25].
Rapid kinetic measurements of hHb/PolyhHb solutions
hHb/PolyhHb gaseous ligand binding/release kinetics were measured using an Applied Photophysics SF-17 microvolume stopped-flow spectrophotometer (Applied Photophysics Ltd., Surrey, United Kingdom). Rapid kinetic measurements were performed using protocols previously described by Rameez and Palmer [10,11,26]. For all stopped-flow measurements, a control of hHb was used to ensure the authenticity of the results. PBS (0.1 M, pH 7.4) was used as the reaction buffer for all kinetic measurements. Flash photolysis mediated O2 association kinetics were measured using procedures described by Olsen et al. [27]. Prior to flash photolysis, each sample was oxygenated by placing it under 1 atm of O2 for 15 minutes. Complete oxygenation was verified by spectral analysis. Flash photolysis was performed on 12.75 μM (on a per heme basis) samples with an excitation wavelength of 425 nm (3.5 mJ/pulse). Samples were excited with a Q-switch Nd-YAG laser (Spectra Physics, Santa Clara, CA) pumped optical parametric oscillator (Spectra Physics, Santa Clara, CA) that delivered pulses of ca. 8 ns at 10 Hz. The pulse energy was about 3.5 mJ/pulse at the sample. The spectrometer (Edinburgh Instruments LP980, Livingston, UK) used a 150 W Xe-lamp to generate probe light at a 90 degree angle from the pump laser. Kinetic traces were recorded by PMT and a digital oscilloscope, while transient spectra were collected with a CCD (Andor Technology, Belfast, UK). O2 association was monitored at 430 nm. Complete photolysis of O2 was verified for each sample.
Computational methods
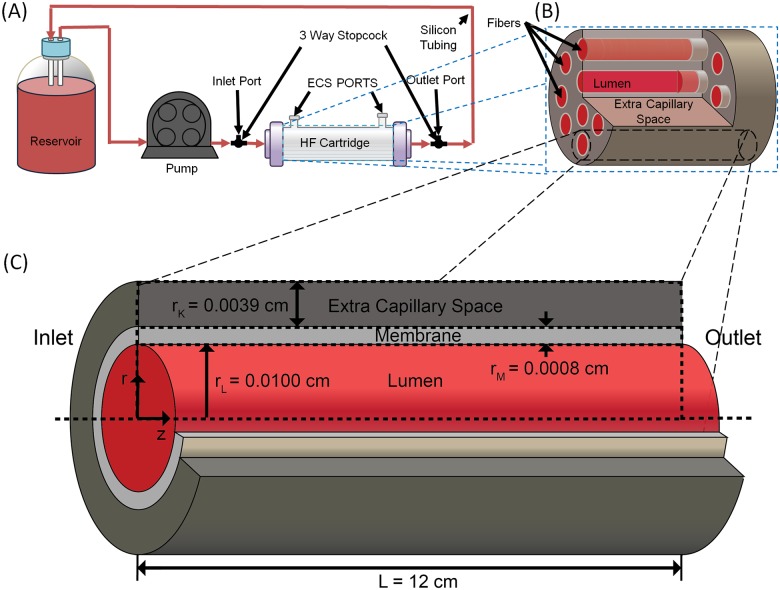
To assess the ability of mixtures and T- and R-state PolyhHb to oxygenate tissue engineered constructs, we computationally evaluated O2 transport in a single fiber of a HF bioreactor housing hepatocytes (i.e. bio-artificial liver assist device). This type of device can be used to replicate various liver functions, and has been used as an artificial liver assist device to support patients with failing livers [28]. The HF bioreactor modeled in this study consists of a Spectrum Laboratories (Rancho Dominguez, CA) commercial HF bioreactor (cat.#400–011) containing 2,205 individual polyethylene fibers. The HF membrane has a 35 kDa MW cut-off which prevents PolyhHb (Mw > 35 kDa) transport out of the lumen into the extra capillary space (ECS). The ECS houses cultured hepatocytes. The O2 concentration profile was modeled with a modified form of the Krogh tissue cylinder model. This model consists of three subdomains: a cylinder representing the lumen, an annulus representing the membrane, and an outer annulus representing the ECS. A mixture of cell culture media and PolyhHb flows through the lumen to provide nutrients and remove waste to/from the cells which reside entirely within the ECS. A schematic of the HF bioreactor system and individual HF model geometry is shown in Fig 3.
Fig 3. Schematic of the HF bioreactor system and individual HF model geometry.
Shown here is the basic schematic of hemoglobin solutions pumped through a HF reactor with uniformly distributed fibers with the shown geometry.
Additional information about this model and the physical constants used can be found in the literature [29]. The model is evaluated with finite element analysis in Comsol Multiphysics (Version 4.3, Comsol, Inc., Burlington, MA). Pressure and velocity profiles were first evaluated independently. Mass conservation equations for O2, and the HBOCs were then solved simultaneously. Inlet pO2, total HBOC concentration, and HBOC fraction were varied during simulation by 0–140 mm Hg, 0–130 mg/mL and 1–100% R-state respectively.
Results and discussion
PolyhHb synthesis and characterization
It is necessary to measure the biophysical properties of 35:1 T-state PolyhHb, 30:1 R-state PolyhHb, and various mixtures of these two types of HBOCs to evaluate their O2 transport potential in transfusion and tissue engineering applications. Table 1 compares the biophysical properties (hydrodynamic diameter, protein concentration, % metHb, O2 equilibria, and gaseous ligand binding/release kinetics) of hHb, 35:1 T-state PolyhHb and 30:1 R-state PolyhHb. Table 1 also compares the biophysical properties of molar mixtures of 35:1 T-state PolyhHb and 30:1 R-state PolyhHb. In this comparison, one batch of 35:1 T-state PolyhHb and one batch of 30:1 R-state PolyhHb were selected to formulate the mixtures. Therefore, entries in Table 1 do not have error bars.
Table 1. Biophysical properties of PolyhHb.
| Property | hHb (n = 15) | 35:1 T-state PolyhHb (n = 15) | 30:1 R-state PolyhHb (n = 15) | 35:1 T-state PolyhHb | T-state Mole Fraction | 30:1 R-state PolyhHb | ||
|---|---|---|---|---|---|---|---|---|
| .75 | 0.5 | 0.25 | ||||||
| Diameter (nm) | 5.5 39ab | 93.78 ± 16.34c | 87.17 ± 12.72c | 102.7 | 98.1 | 96.2 | 92.4 | 90.1 |
| [Hb] (g/dL) | 31.47 ± 7.92ab | 11.04 ± 1.13c | 11.72 ± 1.44c | 10.79 | 10.79 | 10.79 | 10.79 | 10.79 |
| MetHb (%) | 0ab | 5.08 ± 0.55bc | 3.49 ± 1.23ac | 4.97 | 4.78 | 4.53 | 4.66 | 5.40 |
| P50 (mm Hg) | 12.40 ± 1.04ab | 37.35 ± 7.91bc | 1.96 ± 0.77ac | 32.35 | 23.54 | 15.07 | 4.24 | 1.77 |
| Cooperativity (n) | 2.62 ± 0.10ab | 0.79 ± 0.11bc | 1.10 ± 0.17ac | 0.70 | 0.75 | 0.53 | 0.53 | 0.97 |
| koff, O2 (s-1) | 37.06 ± 2.92ab | 47.35 ± 4.15bc | 23.98 ± 4.11ac | 41.47 | 29.88 | 25.69 | 18.35 | 19.42 |
| kon, O2 (μM-1s-1) | 40.85 ± 1.49 ab | 28.59 ± 0.66bc | 12.12 ± 0.69ac | - | - | - | - | - |
| kon, CO (μM-1s-1) | 0.199 ± 0.01a | 0.12 ± 0.02bc | 0.20 ± 0.05a | 0.10 | 0.14 | 0.15 | 0.15 | 0.24 |
| kox, NO (μM-1s-1) | 35.99 ± 6.06ab | 13.21 ± 4.66c | 14.57 ± 3.57c | 13.22 | 12.59 | 12.25 | 13.04 | 10.26 |
The error bars represent the standard deviation from 15 replicates. One batch of 35:1 T-state PolyhHb and one batch of 30:1 R-state PolyhHb were used to formulate mixtures. Therefore, the entries in this table do not have error bars.
a p < 0.05 compared with 35:1 T-state PolyhHb
b p < 0.05 compared with 30:1 R-state PolyhHb
c p < 0.05 compared with hHb.
Hydrodynamic diameter of PolyhHb
The hydrodynamic diameter of 35:1 T-state PolyhHb (93.78 ± 16.34 nm) was not significantly different (p<0.05) compared to the diameter of 30:1 R-state PolyhHb (87.17 ± 12.72 nm). However, the measured particle diameter for mixtures of T- and R-state PolyhHbs was proportional to the molar ratio of pure T-state and pure R-state PolyhHb. In contrast, the diameter of T- and R-state PolyhHbs was significantly (p<0.05) larger than the diameter reported in the literature for cell-free hHb (~5.5 nm) [30]. Therefore, the large molecular radius of T- and R-state PolyhHbs can avoid the side-effects associated with transfusion of cell-free Hb such as unfolding of the globin chain leading to the release of cytotoxic free-heme and renal toxicity, dissociation of tetrameric Hb into αβ dimers and extravasation through the blood vessel wall into the surrounding tissue space leading to oxidative tissue injury, and scavenging of endothelial NO leading to vasoconstriction and systemic hypertension [10,11,31–33].
MetHb level and protein concentration of PolyhHb
The metHb level of 35:1 T-state PolyhHb was significantly (p<0.05) higher than 30:1 R-state PolyhHb (Table 1). However, metHb levels for the mixtures showed no trend with mixture ratio. R-state PolyhHb was synthesized in an oxygenated environment, and intuitively expected to yield higher metHb levels compared to T-state PolyhHb. However, the opposite was observed. This can be explained by the duration of hHb deoxygenation before polymerization. For R-state PolyhHb, the polymerization reaction is initiated after 1–1.5 h of oxygenation while in T-state it is 2 hours after deoxygentation. The extended period of time hHb is maintained at 37°C during the deoxygenation step leads to higher metHb levels for T-state PolyhHb.
Protein concentrations for 35:1 T-state and R-state PolyhHb solutions ranged between 11.04 ± 1.13 and 11.72 ± 1.44 g/dL, respectively. These concentrations are comparable to the Hb concentration in whole blood (15.7 g/dL for men and 13.8 g/dL for women) [34]. Additionally, these concentrations are comparable to the Hb concentrations reported in the literature for commercial HBOCs: HBOC-201® ([Hb] ~ 13 g/dL), PolyHeme® ([Hb] ~ 10 g/dL) [35], and Hemolink® ([Hb] ~ 9.7 g/dL) [36].
O2–hHb/PolyhHb equilibria
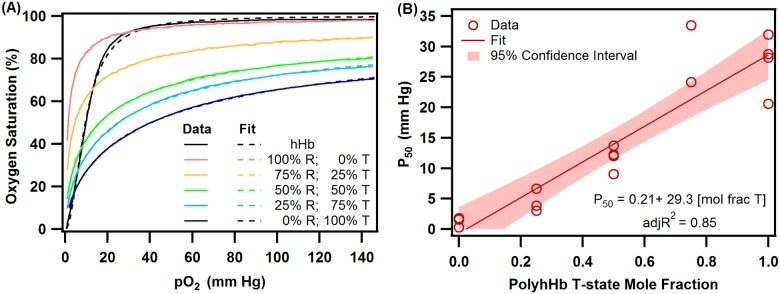
The O2-hHb/PolyhHb equilibrium data were fit to the Hill equation (Eq 1) to regress the P50 and cooperativity coefficient (n). Unlike hHb, the shape of the equilibrium O2 binding curves obtained for PolyhHbs are not sigmoidal. This indicates a significant loss in cooperative binding of O2 to Hb in PolyhHbs compared to unmodified hHb. These observations are shown in Fig 4(A), which compares typical O2 equilibrium curves of hHb, 30:1 R-state PolyhHb, 35:1 T-state PolyhHb, and mixtures of 35:1 T-state PolyhHb and 30:1 R-state PolyhHb at molar ratios of 0.75:0.25, 0.50:0.50 and 0.25:0.75. Dots represent experimental data and corresponding solid lines of the same color represent curve fits.
Fig 4. hHb and PolyhHb O2 equilibrium.
(A) Comparison of O2 equilibrium curves of hHb, 30:1 R-state PolyhHb, 35:1 T-state PolyhHb, and mixtures of 35:1 T-state PolyhHb and 30:1 R-state PolyhHb at various molar fractions of T: 0.75,0.5 and 0.25. Dots represent experimental data and the corresponding solid lines of the same color represent curve fits. (B) Dependence of P50 on mole fraction of 35:1 T-state PolyhHb to 30:1 R-state PolyhHb. The data were fit to a linear function using JMP 9.2.
The 35:1 T-state PolyhHb exhibited lower O2 affinity (P50 ~ 37.35 ± 7.91 mm Hg) compared to hHb (P50 ~ 12.40 ± 1.04 mm Hg). Polymerization of Hb in the deoxy-state limits the resultant PolyhHb to the T-state quaternary conformation compared to native Hb, thereby accounting for its higher P50 [17,37]. In contrast, high O2 affinity (P50 ~ 1.96 ± 0.77 mm Hg) was observed for 30:1 R-state PolyhHb compared to hHb and T-state PolyhHb. Polymerization of Hb in the oxygenated-state limits the resultant PolyhHb to the R-state quaternary conformation thereby accounting for its’ lower P50s [17]. The literature suggests that HBOCs with high P50s target O2 transport to the systemic circulation, while HBOCs with low P50s target O2 transport to the peripheral tissues via microcirculation [37]. Furthermore, mixtures of HBOCs with varying O2 affinities might be a suitable option for restoring tissue oxygenation during resuscitation from hemorrhagic shock [15]. Therefore in this study, we evaluated in silico the ability of mixtures of 35:1 T-state PolyhHb and 30:1 R-state PolyhHb at molar ratios of 0.75:0.25, 0.50:0.50, and 0.25:0.75 to supply and regulate O2 levels in a single fiber of a HF hepatic bioreactor. We observed that the P50 for various mixtures of T- and R-state PolyhHbs were proportional to the molar ratio of pure T-state and pure R-state PolyhHb (Table 1). Fig 4(B) shows the dependence of P50 on molar ratio of 35:1 T-state to 30:1 R-state PolyhHbs. These data were fit to a linear function using JMP 9.2.
Both 35:1 T-state and 30:1 R-state PolyhHbs display lower cooperativity (n) compared to unmodified hHb (n ~ 2.62 ± 0.10) (Table 1). The quaternary conformational changes observed in a Hb molecule during its transition from the deoxy- to the oxy-state involve rotation of the two symmetrical αβ dimers by 15° relative to each other and a translation of 0.1 nm along the rotation axis [38]. This rotation about the axis is perhaps hindered by the inter- and intra-molecular glutaraldehyde cross-links in PolyhHb molecules, thus resulting in the observed low cooperativities [21].
Rapid kinetic measurements of hHb/PolyhHb solutions
The kinetics of PolyhHbs with physiological relevant gaseous ligands were measured to compare their ligand binding/release kinetics. These rates are important to evaluate the ability of these particles to store and transport important gaseous ligands such as O2, CO, and NO. NO dioxygenation kinetics can predict the ability of PolyhHb to scavenge NO, which is the major mechanism for the development of vasoconstriction and systemic hypertension. O2 dissociation measurements can be linked to autoregulation theory for the development of vasoconstriction and systemic hypertension [10].
Reactions with O2
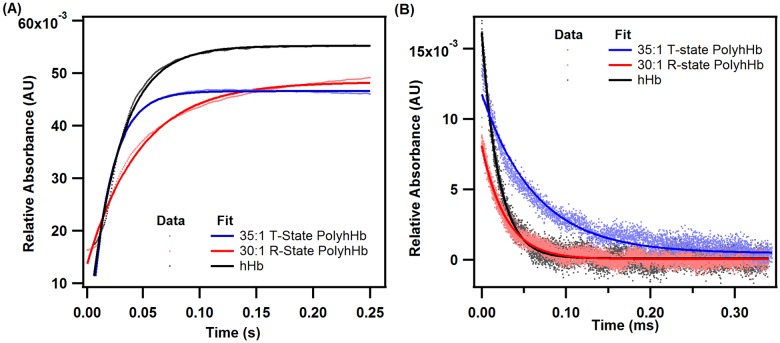
for 35:1 T-state PolyhHb (47.35 ± 4.15 s-1) was significantly (p<0.05) higher than that obtained for 30:1 R-state PolyhHb (23.98 ± 4.11 s-1) and unmodified hHb (37.06 ± 2.92 s-1). Also, values obtained for R-state PolyhHb are significantly lower (p<0.05) than the rate constant obtained for unmodified hHb. Furthermore, we observed that for various mixtures of T- and R-state PolyhHbs increased with increasing molar ratio of 35:1 T-state to 30:1 R-state PolyhHb (Table 1). These observations are consistent with the literature and are expected given the contrasting O2 affinities of T- and R-state PolyhHbs [15,17]. for 35:1 T-state PolyhHb (12.12 ± 0.69 s-1μM-1) was significantly (p<0.05) lower than that obtained for 30:1 R-state PolyhHb (28.59 ± 0.66 s-1μM-1) and unmodified hHb (40.85 ± 1.49 s-1μM-1). In addition, values obtained for 30:1 R-state PolyhHb are significantly (p<0.05) lower than that obtained for unmodified hHb. In these flash photolysis experiments, we observed that the rate of O2 binding to T-state PolyhHb was significantly lower than unmodified hHb. This can be explained by incomplete O2 binding to T-state PolyhHb even under 1 atm of pure O2. At equilibrium and at this dissolved O2 concentration (pO2 ~740 mm Hg), 35:1 T-state PolyhHb is only ~95% saturated with O2. However, for unmodified hHb was similar to reported literature values [39,40]. Interestingly, for 35:1 T-state PolyhHb was on the same order of magnitude compared to chemically modified T-state hHb (5–10 s-1μM-1) [27]. However, for 35:1 T-state PolyhHb was drastically different compared to chemically modified T-state hHb (~500–1000 s-1) [27]. For 30:1 R-state PolyhHb, was similar to the values reported for R-state hHb (~20 s-1) [27]. In contrast, the value for for 35:1 R-state PolyhHb was dramatically different compared to R-state hHb (~66 s-1μM-1) [27]. Reduced interactions between neighboring globin subunits in T- and R-state PolyhHb compared to non-polymeric R- and T-state hHb may result in the observed deviations for PolyhHb O2 association and dissociation kinetics when the PolyhHb is not in the thermodynamically preferred conformational state (i.e. fully deoxygenated T-state PolyhHb or fully oxygenated R-state PolyhHb). Unfortunately, the random and extensive nature of the glutaraldehyde crosslinks precludes any higher-level analysis of this behavior. Similar effects are further demonstrated in the reduced NO dioxygenation reaction rate constant for the PolyhHbs compared to hHb. Fig 5 compares typical kinetic time courses of O2 dissociation and association for hHb, 35:1 T-state PolyhHb and 30:1 R-state PolyhHb.
Fig 5. Deoxygenation and oxygenation kinetic time courses for hHb, T-state PolyhHb and R-state PolyhHb.
(A) Comparison of time courses for deoxygenation in the presence of 1.5 mg/mL sodium and (B) oxygenation time course facilitated by flash photolysis of hHb (red), 30:1 R-state PolyhHb (black), and 35:1 T-state PolyhHb (blue). Dots represent experimental data and the corresponding solid lines of the same color represent curve fits. The experimental data shows an average of 10–15 kinetic traces. For deoxygenation, the reactions were monitored at 437.5 nm and 20°C. For oxygenation, the reactions were monitored at 430 nm. PBS (0.1 M, pH 7.4) was used as the reaction buffer.
The high O2 offloading rate of cell-free hHb forms the basis of autoregulation theory that explains the development of vasoconstriction and systemic hypertension upon transfusion of HBOCs [41–43]. Thus, moderate O2 release rates are critical in improving HBOC efficacy. Therefore, the PolyhHbs and their mixtures synthesized in our lab can potentially deliver O2 to ischemic tissues at regulated rates potentially avoiding vasoconstriction resulting from the oversupply of O2.
Reactions with CO
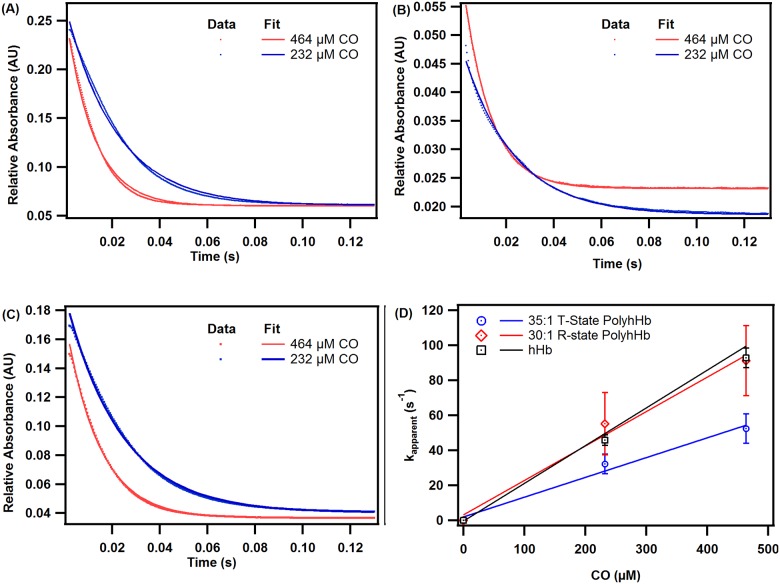
Fig 6 shows characteristic CO association kinetic time courses for deoxygenated hHb (A), 30:1 R-state PolyhHb (B), and 35:1 T-state PolyhHb (C). The dependence of the pseudo first-order rates on CO concentration for hHb, 35:1 T-state PolyhHb, and 30:1 R-state PolyhHb is shown in panel D. Therefore, the slopes of the linear fits in panel D indicate the second-order CO association rate constants reported in Table 1.
Fig 6. Time courses for the CO association reaction.
Time courses for the CO association reaction with deoxygenated (A) hHb, (B) 30:1 R-state PolyhHb, and (C) 35:1 T-state PolyhHb. Dots represent experimental data and the corresponding solid lines of the same color represent curve fits. Experimental data shows an average of 10–15 kinetic traces. The reactions were monitored at 437.5 nm and 20°C. PBS (0.1 M, pH 7.4) was used as the reaction buffer. (D) Comparison of CO association rates of hHb, 35:1 T-state PolyhHb, and 30:1 R-state PolyhHb. The error bars represent the standard deviation from 15 replicates.
The kon,CO rates obtained for unmodified hHb and 30:1 R-state PolyhHb evaluated in this study are significantly higher (p<0.05) than the values obtained for 35:1 T-state PolyhHb (Table 1). Similar findings have been reported in the literature and suggest that polymerization of Hb in the T-state limits heme pocket accessibility to CO [15]. Moreover, polymerization of Hb in the R-state results in more open conformation and greater heme pocket accessibility. This explains the higher kon,CO rate constant observed for 30:1 R-state PolyhHb [15]. The kon,CO rate constants for the T- and R-state molar mixtures showed no trend with mixture ratio (Table 1).
Reactions with NO
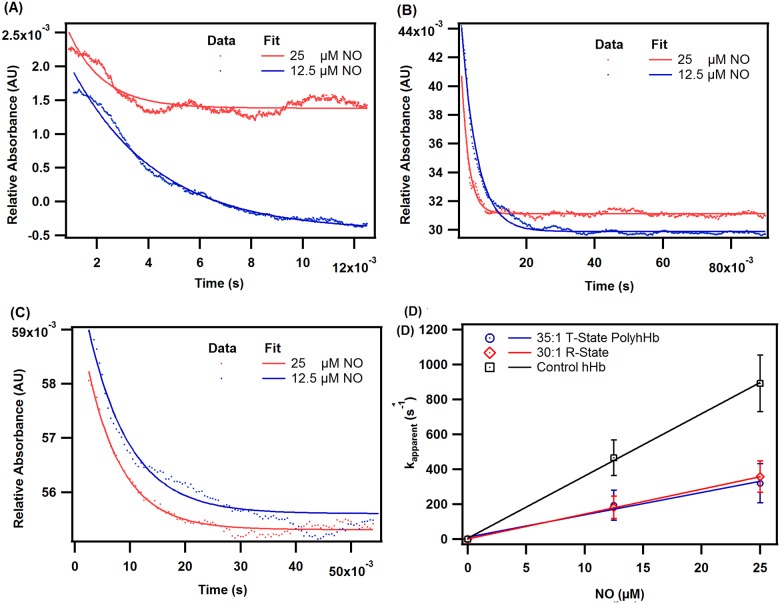
Fig 7 shows characteristic NO dioxygenation kinetic time courses for oxygenated hHb (A), 30:1 R-state PolyhHb (B), and 35:1 T-state PolyhHb (C). The dependence of the pseudo first-order rates on NO concentration for hHb, 35:1 T-state PolyhHb, and 30:1 R-state PolyhHb is shown in panel D. Therefore, the slopes of the linear fits in panel D are used to calculate the second-order NO dioxygenation rate constants reported in Table 1. The NO dioxygenation rate constant for 35:1 T-state PolyhHb was comparable (p>0.05) to the rate constant for 30:1 R-state PolyhHbs (Table 1). Similar koX,NO values have been reported in the literature [15,17]. The koX,NO for molar mixtures of T- and R-state PolyhHb showed no trend with mixture ratio.
Fig 7. Time courses for the NO deoxygenation reaction.
Time courses for the NO dioxygenation reaction with oxygenated (A) hHb, (B) 30:1 R-state PolyhHb, and (C) 35:1 T-state PolyhHb. Dots represent experimental data and the corresponding solid lines of the same color represent curve fits. Experimental data shows an average of 7–10 kinetic traces. The reactions were monitored at 420 nm and 20°C. PBS (0.1 M, pH 7.4) was used as the reaction buffer. (D) Comparison of NO dioxygenation rates of hHb, 35:1 T-state PolyhHb, and 30:1 R-state PolyhHb. The error bars represent the standard deviation from 15 replicates.
Comparison to commercial HBOCS
Comparisons (wherever possible) were made between the biophysical properties of T- and R-state PolyhHbs synthesized in this study and commercial HBOCs. The biophysical properties of selected commercial HBOCs are shown in Table 2. The T- and R-state PolyhHbs synthesized in this study have significantly larger diameters compared to the computed diameters [44] of Oxyglobin® (Biopure Corp, Cambridge, MA, USA) and Hemolink® (Hemosol Inc., Toronto, Canada) [45,46]. MetHb values observed for the T- and R-state PolyhHbs synthesized in our lab are comparable to those reported for HBOC-201®, PolyHeme® (Northfield Laboratories Inc., Northfield, IL, USA) [35], and Hemolink® [36]. The P50s of 35:1 T-state PolyhHbs are in agreement with the P50 values reported in the literature for commercial HBOCs, HBOC-201®, PolyHeme® [35], and Hemolink®.The cooperativity values of the T- and R-state PolyhHbs are comparable to the reported values HBOC-201® [35] and Hemolink® [36]. The observed n values are slightly lower than those reported for PolyHeme® [35]. The values for T- and R-state PolyhHbs are lower than the deoxygenation rate constants reported in the literature for Hemolink® [47], and Oxyglobin® [46]. The kon,CO values for T-state PolyhHbs are comparable to those reported in the literature for Hemolink® [47], but are significantly lower than the values recorded for Oxyglobin® [46]. In contrast, CO association rate constants for R-state PolyhHbs are comparable to Oxyglobin®, but are significantly higher than Hemolink®.
Table 2. Biophysical properties of commercially available HBOCs.
| HBOC | Effective Diameter (nm) | P50 (mm Hg) | n | Met (%) | s-1 | kon,CO μM-1s-1 |
|---|---|---|---|---|---|---|
| Oxyglobin® | 5.85–10.49 [44] | 38.4 [48] | 1.4 [48] | 3.68–5.68 [49] | 61.8 ± 1.6 [46] | 0.19 ± 0.02 [46] |
| Hemolink® | 5.28–11.13 [44] | ~33.5 [36] | ~0.95 [36] | ~ 6.6 [36] | 130 ± 3.5 [47] | 0.12 ± 0.04 [47] |
| HBOC-201® | 5.73–11.10 [50] | ~38 [35] | ~1.4 [35] | < 10 [35] | NA | NA |
| PolyHeme® | 5.59–10.31 [50] | ~29 [35] | ~1.7 [35] | < 8 [35] | NA | NA |
Computational results
The measured biophysical properties of pure T- and R-state PolyhHb solutions (Table 1) were incorporated into a computational model describing O2 transport in a single fiber of a hepatic HF bioreactor where the inlet pO2, mixture fraction, and total PolyhHb concentration were varied.
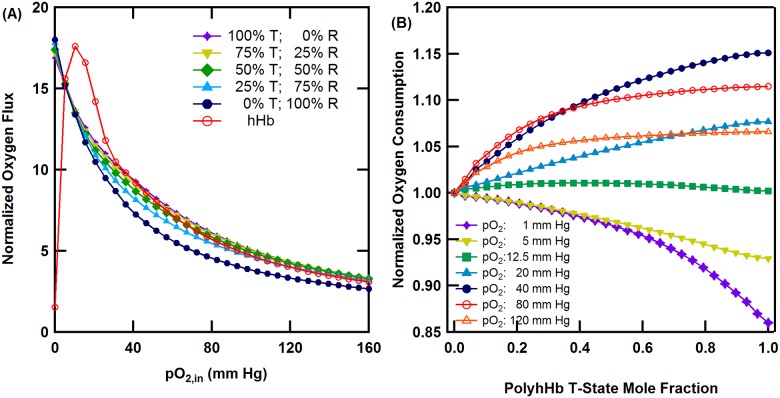
Unsupplemented cell culture media was used as the control, while unmodified hHb was simulated for comparison. Unsupplemented cell culture media normalized O2 flux through the HF membrane for selected molar ratios of T- and R-state PolyhHb and hHb as a function of inlet pO2 is shown in Fig 8. For all HBOC molar ratios, the normalized O2 flux decreased as the inlet pO2 increased. At high pO2,in (>80 mm Hg) the normalized O2 flux was similar to a 25% T-state PolyhHb fraction. At pO2,in values ranging from 5–40 mm Hg, the simulated normalized flux of unmodified hHb was greater than all HBOC mixtures.
Fig 8. Effects of PolyhHb mixtures and hHb on oxygenation of the HF bioreactor.
(A) Unsupplemented cell culture media (i.e. no HBOC) normalized O2 flux through the HF membrane for various 35:1 T-state PolyhHb and 30:1 R-state PolyhHb mixtures compared to hHb at Q = 40 mL/min and [PolyhHb]total = [hHb] = 130 mg/mL. (B) Pure R-state normalized O2 consumption in the ECS versus PolyhHb T-state fraction, for various pO2,ins, Q = 40 mL/min and [PolyhHb] = 130 mg/mL.
Pure R-state normalized O2 consumption by the hepatocytes housed in the ECS at various pO2,ins as a function of T-state PolyhHb fraction is shown in Fig 8. Here O2 consumption is used as an indicator of O2 delivery to the cultured hepatocytes. For low pO2,ins (<12 mm Hg), the rate of hepatocyte O2 consumption is greatest for pure R-state PolyhHb. At pO2,in values close to 12 mmHg, the molar ratio of T-state to R-state PolyhHb has a negligible effect on O2 delivery. At increasing moderate pO2,in values (12–40 mm Hg), O2 delivery increases with increasing molar ratio of T-state to R-state PolyhHb. At increasing high pO2,in values (>40 mm Hg), the effect of the T-state to R-state PolyhHb mixture ratio on O2 consumption decreased.
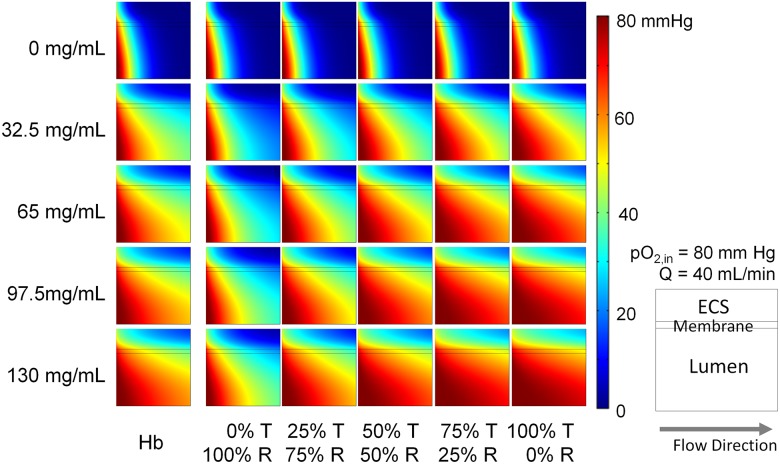
Simulated pO2 profiles for PolybHb mixtures and unmodified hHb supplemented cell culture media within the lumen, membrane, and ECS associated with a single HF are shown in Fig 9. The maximum protein concentration (130 mg/mL) was selected to approximate heme concentrations in vivo (i.e. in whole blood). Each frame in the figure represents a cross-sectional slice of a single HF unit. Flow in the system proceeds from left to right. The bottom of each panel corresponds to the HF centerline. In simulations with unsupplemented cell culture media, approximately 90% of the pO2 in the ECS was below 20 mm Hg. Oxygenation of the ECS improves with increasing protein concentration and increasing fraction of PolybHb in the T-state. These simulations demonstrate that the pO2 distributions for the 25% T-state PolybHb mixture are similar to that of unmodified hHb.
Fig 9. pO2 distribution in a single hollow fiber.
Varying protein concentration was used for each species (y axis) for different hemoglobin species transfusion (x axis). The O2 content is depicted by a color scale from 0 to 80 mm Hg. Q = 40 mL/min pO2,in = 80 mm Hg.
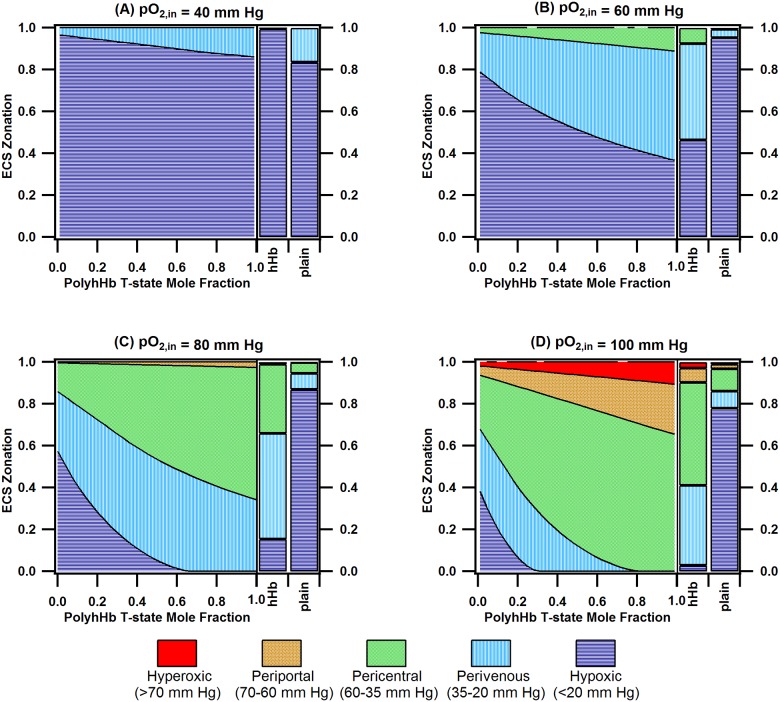
Zonal heterogeneity in the liver sinusoid, which stems from O2 dependent regional variations in hepatocyte function, results in a “glucosat” in the liver [19,51]. This functionality is important in maintaining blood glucose levels during feeding and fasting periods. A variety of detoxification functions, which rely on sequential phase I and phase II metabolic enzymes, also requires proper zonation of these enzymes along the hepatic acinus [52]. Thus, replicating the zonation observed in the liver sinusoid is vital in bioartificial liver design. The ECS zonation plots for mixtures of PolybHb, unmodified hHb, and plain cell culture media at various pO2,ins are shown in Fig 10. Oxygenation zones within the ECS are classified as follows [51]: hypoxic (<20 mm Hg), perivenous (20–30 mm Hg), pericentral (35–60 mm Hg), periportal (60–70 mm Hg), and hyperoxic (>70 mm Hg). For unsupplemented cell culture media, a small fraction (12%-25%) of the hepatocytes are exposed to normoxic pO2 levels (20–70 mm Hg). For low pO2,ins (40 mm Hg and 60 mm Hg), the majority of the hepatocytes are exposed to hypoxic conditions (>40%) regardless of T-/R-state PolyhHb molar fraction. At pO2,in = 80 mm Hg, the fraction of hepatocytes exposed to normoxic conditions with R-state PolyhHb (43%) is much less than the fraction of hepatocytes with T-state PolyhHb (99.9%). For pO2,in at 80 mm Hg, the hypoxic region remains less than 5% for T-state PolyhHb fractions greater than 50%. The ratio of hepatocytes in the pericentral region to those in the perivenous region increases from 0.91 to 1.85 as the T-state PolyhHb fraction increases from 50% to 100%. For pO2,in = 100 mm Hg, a fraction of the hepatocytes (4–7%) are exposed to hyperoxic conditions.
Fig 10. ECS zonation for PolyhHb fractions, hHb, and unsupplemented (plain) media for various pO2,ins.
This figure displays the zonation (hyperoxic, periportal, perivenous, hypoxic) for PolyhHb fractions, hHb, and unsupplemented (plain) media where the pO2,in is equal to (A) 40 mm Hg, (B) 60 mm Hg, (C) 80 mm Hg, and (D) 100 mm Hg. For this simulation Q = 40 mL/min and [PolyhHb]total = [hHb] = 130 mg/mL.
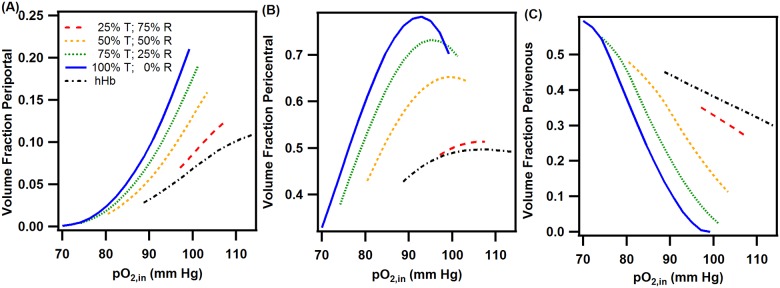
At low pO2,ins (<40 mm Hg), unmodified hHb was able to deliver more O2 than the PolyhHbs synthesized in this study. This phenomenon likely results from the low cooperativity and high MW (i.e. lower diffusivity) of the synthesized PolyhHbs. For inlet pO2 ranges similar to the inlet conditions in the liver sinusoid (>60 mmHg), T-state PolyhHb delivered more O2 to the cells in the ECS. Furthermore, as the pO2,in increased, the fraction of T-state PolyhHb required to outperform unmodified hHb decreased. This is likely due to the increased O2 dissociation rate constant of T-state PolyhHb. At low pO2,ins (<12 mmHg), the O2 delivery of R-state PolyhHb outperformed T-state PolyhHb. This can be explained by an increase in O2-offloading at low pO2,ins for R-state PolyhHb. This indicates that R-state PolyhHbs may be better suited to oxygenate hypoxic areas. To explore these effects further, we examined how the volume fraction of the periportal, pericentral, and perivenous sections varied as a function of the pO2,in for PolyhHb mixtures and unmodified Hb. We then excluded any simulation results where the sum of the hypoxic and hyperoxic fractions was less than 10% of the total volume in the ECS. The results of this analysis are shown in Fig 11. Overall, pure T-state PolyhHb had the largest operating range where minimal hypoxic/hyperoxic behavior was observed (70–95 mm Hg). Increasing the mole fraction of R-state PolyhHb lead to increasingly narrow operating ranges. For pure R-state PolyhHb, no region was observed where the sum of the hypoxic and hyperoxic volume fractions were less than 10%. Decreasing the mole fraction of R-state PolyhHb in the PolyhHb mixture lead to broadened operational ranges. Interestingly, unmodified hHb had a similar operating curve to R-state PolyhHb. However, both the high mole fraction R-state PolyhHb mixtures and unmodified hHb solutions had less variation in the volume fractions for each zone compared to the high mole fraction T-state PolyhHb mixtures.
Fig 11. ECS zonation at varying pO2,ins for various PolyhHb mole fractions and pure hHb.
This figure displays the zonation fractions of (A) periportal, (B) pericentral, and (C) perivenous regions for various PolyhHb mixtures and pure hHb where the sum of the hypoxic and hyperoxic fractions are less than 10% of the total volume. For this simulation Q = 40 mL/min and [PolyhHb]total = [hHb] = 130 mg/mL.
As expected, T-state PolyhHb has the potential to oxygenate a HF bioreactor better than R-state PolyhHb and unmodified hHb. These results are in agreement with the simulations performed by Zhou et al. [18]. The results of the finite element analysis indicate that O2 delivery can be controlled by adjusting the molar ratio of T-state to R-state PolyhHb in solution. When the T-state to R-state molar fraction drops below 50%, O2 delivery rapidly decreases. Therefore, it is recommended that mixtures of PolyhHb contain no less than 50% T-state PolyhHb. The percent of R-state PolyhHb may be tuned to both vary zonation or to increase O2 delivery to severely hypoxic regions. Finally, unmodified hHb may be favorable in maintaining relatively constant zonation if the pO2,in varies. However, this provides much less flexibility in establishing different oxygenation zones due to the limited operating range of unmodified hHb. This is especially important considering the geometry of the hollow fiber bioreactor. In vivo, blood flows into the liver through both the portal and vein. This leads to an O2 gradient and functional zonation between arterioles and the central veins [19]. Replicating this oxygen gradient in vitro would necessitate a more complex bioreactor design. However, the results from the simulations indicate that application of the PolyhHb mixtures can vary the zonation despite not exhibiting the cooperative O2 binding behavior of native hHb.
Conclusions
We have previously synthesized glutaraldehyde-cross-linked polymerized human Hb (PolyhHbs) with either low (T-state) or high (R-state) O2 affinity. In this study, we demonstrated that molar mixtures of T-state and R-state PolyhHbs can yield HBOCs with tunable O2 affinities. Additionally, O2 transport simulations performed in this study suggest that mixtures of PolyhHbs with T-state molar fractions greater than 50% are able to oxygenate a hepatic HF bioreactor better than those with T-state PolyhHb molar fractions less than 50%. Furthermore, by decreasing the T-state PolyhHb molar fraction, the ratio of pericentral to perivenous oxygenation was computationally calculated to decrease by 50% with minimal formation of hypoxic zones.
Supporting information
This file outlines the equations and parameters for the COMSOL model used to analyze oxygenation in a single hollow fiber contained in the bioreactor.
(DOCX)
Table containing the biophysical properties for each of the PolyhHbs synthesized in this study.
(XLSX)
Acknowledgments
We acknowledge Dr. Christopher Hadad (Dept. of Chemistry and Biochemistry, The Ohio State University) for kindly allowing the use of his stopped-flow spectrophotometer, Dr. Robert J. Lee (College of Pharmacy, The Ohio State University) for permitting the use of his dynamic light scattering (DLS) spectrometer, and the Ohio State University Center for Chemical and Biophysical Dynamics for use of their transient UV/Vis flash photolysis system. We further acknowledge Marni Grevenow (Transfusion Services, Wexner Medical Center, The Ohio State University) for generously donating expired human RBC units. This work was supported by National Institutes of Health grants R56HL123015, R01HL126945 and R01EB021926.
Data Availability
All relevant data are within the paper and its Supporting Information files.
Funding Statement
This work was supported by National Institutes of Health grant R56HL123015, R01HL126945, and R01EB021926 to AFP (https://www.nih.gov/).
References
- 1.Stamati K, Mudera V, Cheema U. Evolution of oxygen utilization in multicellular organisms and implications for cell signalling in tissue engineering. J Tissue Eng. SAGE PublicationsSage UK: London, England; 2011;2: 2041731411432365. doi: 10.1177/2041731411432365 [DOI] [PMC free article] [PubMed] [Google Scholar]
- 2.Sullivan JP, Gordon JE, Palmer AF. Simulation of oxygen carrier mediated oxygen transport to C3A hepatoma cells housed within a hollow fiber bioreactor. Biotechnol Bioeng. 2006;93: 306–317. doi: 10.1002/bit.20673 [DOI] [PubMed] [Google Scholar]
- 3.AABB, American Red Cross. Circular of information for the use of human blood and blood components. FDA-Center for Biologics Evaluation and Research; 2013. pp. 1–38. [Google Scholar]
- 4.Moore EE. Blood substitutes: The future is now. J Am Coll Surg. 2003;196: 1–17. doi: 10.1016/S1072-7515(02)01704-0 [DOI] [PubMed] [Google Scholar]
- 5.Whitaker B. Report of the United States Department of Health and Human Services: the 2009 National Blood Collection and Utilization Survey Report. Washington, DC: United States Department of Health and Human Services: Office of the Assistant Secretary for Health; 2011.
- 6.Marcucci C, Madjdpour C, Spahn DR. Allogeneic blood transfusions: Benefit, risks and clinical indications in countries with a low or high human development index. Br Med Bull. 2004;70: 15–28. doi: 10.1093/bmb/ldh023 [DOI] [PubMed] [Google Scholar]
- 7.Buehler PW, Alayash AI. Redox biology of blood revisited: the role of red blood cells in maintaining circulatory reductive capacity. Antioxid Redox Signal. Mary Ann Liebert, Inc. 2 Madison Avenue Larchmont, NY 10538 USA; 2005;7: 1755–1760. doi: 10.1089/ars.2005.7.1755 [DOI] [PubMed] [Google Scholar]
- 8.Mozzarelli A, Bettati S. Chemistry and Biochemistry of Oxygen Therapeutics: From Transfusion to Artificial Blood [Internet] Chemistry and Biochemistry of Oxygen Therapeutics: From Transfusion to Artificial Blood. Chichester, UK: John Wiley & Sons, Ltd; 2011. doi: 10.1002/9781119975427 [Google Scholar]
- 9.Olsen KW, Tarasov E. Crosslinked and Polymerized Hemoglobins as Potential Blood Substitutes In: Mozzarelli A, Bettati S, editors. Chemistry and Biochemistry of Oxygen Therapeutics. John Wiley & Sons, Ltd; 2011. pp. 327–344. http://onlinelibrary.wiley.com/doi/10.1002/9781119975427.ch24/summary%0Ahttp://files/2245/summary.html [Google Scholar]
- 10.Rameez S, Banerjee U, Fontes J, Roth A, Palmer AF. Reactivity of polymersome encapsulated hemoglobin with physiologically important gaseous ligands: Oxygen, carbon monoxide, and nitric oxide. Macromolecules. 2012;45: 2385–2389. doi: 10.1021/ma202739f [DOI] [PMC free article] [PubMed] [Google Scholar]
- 11.Rameez S, Guzman N, Banerjee U, Fontes J, Paulaitis ME, Palmer AF, et al. Encapsulation of hemoglobin inside liposomes surface conjugated with poly(ethylene glycol) attenuates their reactions with gaseous ligands and regulates nitric oxide dependent vasodilation. Biotechnol Prog. 2012;28: 636–645. doi: 10.1002/btpr.1532 [DOI] [PubMed] [Google Scholar]
- 12.Sakai H, Sou K, Horinouchi H, Kobayashi K, Tsuchida E. Hemoglobin-vesicle, a cellular artificial oxygen carrier that fulfils the physiological roles of the red blood cell structure. In: Takahashi E, Bruley DF, editors. Advances in Experimental Medicine and Biology. Boston, MA: Springer US; 2010. pp. 433–438. doi: 10.1007/978-1-4419-1241-1_62 [DOI] [PubMed] [Google Scholar]
- 13.Simoni J. Artificial oxygen carriers: Scientific and biotechnological points of view. Artif Organs. 2009;33: 92–96. doi: 10.1111/j.1525-1594.2008.00691.x [DOI] [PubMed] [Google Scholar]
- 14.Baek JH, Zhou Y, Harris DR, Schaer DJ, Palmer AF, Buehler PW. Down Selection of Polymerized Bovine Hemoglobins for Use as Oxygen Releasing Therapeutics in a Guinea Pig Model. Toxicol Sci. 2012;127: 567–581. doi: 10.1093/toxsci/kfs109 [DOI] [PMC free article] [PubMed] [Google Scholar]
- 15.Buehler PW, Zhou Y, Cabrales P, Jia Y, Sun G, Harris DR, et al. Synthesis, biophysical properties and pharmacokinetics of ultrahigh molecular weight tense and relaxed state polymerized bovine hemoglobins. Biomaterials. 2010;31: 3723–3735. doi: 10.1016/j.biomaterials.2010.01.072 [DOI] [PMC free article] [PubMed] [Google Scholar]
- 16.Palmer AF, Sun G, Harris DR. The quaternary structure of tetrameric hemoglobin regulates the oxygen affinity of polymerized hemoglobin. Biotechnol Prog. 2009;25: 1803–1809. doi: 10.1002/btpr.265 [DOI] [PubMed] [Google Scholar]
- 17.Zhang N, Jia Y, Chen G, Cabrales P, Palmer AF. Biophysical properties and oxygenation potential of high-molecular-weight glutaraldehyde-polymerized human hemoglobins maintained in the tense and relaxed quaternary states. Tissue Eng Part A. 2011;17: 927–940. doi: 10.1089/ten.TEA.2010.0353 [DOI] [PMC free article] [PubMed] [Google Scholar]
- 18.Zhou Y, Jia Y, Buehler PW, Chen G, Cabrales P, Palmer AF. Synthesis, biophysical properties, and oxygenation potential of variable molecular weight glutaraldehyde-polymerized bovine hemoglobins with low and high oxygen affinity. Biotechnol Prog. 2011;27: 1172–1184. doi: 10.1002/btpr.624 [DOI] [PubMed] [Google Scholar]
- 19.Kietzmann T. Metabolic zonation of the liver: The oxygen gradient revisited [Internet]. Redox Biology. 2017. pp. 622–630. doi: 10.1016/j.redox.2017.01.012 [DOI] [PMC free article] [PubMed] [Google Scholar]
- 20.Palmer AF, Sun G, Harris DR. Tangential flow filtration of hemoglobin. Biotechnol Prog. 2009;25: 189–199. doi: 10.1002/btpr.119 [DOI] [PMC free article] [PubMed] [Google Scholar]
- 21.Zhou Y. Synthesis and Biophysical Characterization of Polymerized Hemoglobin Dispersions of Varying Size and Oxygen Affinity as Potential Oxygen Carriers for use in Transfusion Medicine [Internet]. ProQuest Dissertations and Theses. The Ohio State University. 2011. http://search.proquest.com/docview/920005184?accountid=8359
- 22.Arifin DR, Palmer AF. Determination of Size Distribution and Encapsulation Efficiency of Liposome-Encapsulated Hemoglobin Blood Substitutes Using Asymmetric Flow Field-Flow Fractionation Coupled with Multi-Angle Static Light Scattering. Biotechnol Prog. 2003;19: 1798–1811. doi: 10.1021/bp034120x [DOI] [PubMed] [Google Scholar]
- 23.Hawk PB. Blood analysis. Hawk’s Physiol Chem 14th New York McGraw-Hill. 1965; 1090–9.
- 24.Bradford MM. A rapid and sensitive method for the quantitation of microgram quantities of protein utilizing the principle of protein-dye binding. Anal Biochem. 1976;72: 248–254. doi: 10.1016/0003-2697(76)90527-3 [DOI] [PubMed] [Google Scholar]
- 25.Hill AV. The possible effects of the aggregation of the molecules of haemoglobin on its dissociation curves. J Physiol. 1910;40: 4–7. [Google Scholar]
- 26.Rameez S, Palmer AF. Simple method for preparing poly(ethylene glycol)-surface-conjugated liposome-encapsulated hemoglobins: Physicochemical properties, long-term storage stability, and their reactions with O2, CO, and NO. Langmuir. 2011;27: 8829–8840. doi: 10.1021/la201246m [DOI] [PMC free article] [PubMed] [Google Scholar]
- 27.Olson JS, Foley EW, Maillett DH, Paster E V. Measurement of Rate Constants for Reactions of O<sub>2</sub>, CO, and NO with Hemoglobin Hemoglobin Disorders. New Jersey: Humana Press; 2003. pp. 065–091. doi: 10.1385/1-59259-373-9:065 [DOI] [PubMed] [Google Scholar]
- 28.Carpentier B, Gautier A, Legallais C. Artificial and bioartificial liver devices: present and future. Gut. 2009;58: 1690–702. doi: 10.1136/gut.2008.175380 [DOI] [PubMed] [Google Scholar]
- 29.Chen G, Palmer AF. Hemoglobin-based oxygen carrier and convection enhanced oxygen transport in a hollow fiber bioreactor. Biotechnol Bioeng. 2009;102: 1603–1612. doi: 10.1002/bit.22200 [DOI] [PubMed] [Google Scholar]
- 30.Xu H, Bjerneld EJ, Käll M, Börjesson L. Spectroscopy of Single Hemoglobin Molecules by Surface Enhanced Raman Scattering. Phys Rev Lett. 1999;83: 4357–4360. doi: 10.1103/PhysRevLett.83.4357 [Google Scholar]
- 31.Poli de Figueiredo LF, Mathru M, Solanki D, Macdonald VW, Hess J, Kramer GC. Pulmonary Hypertension and Systemic Vasoconstriction May Offset the Benefits of Acellular Hemoglobin Blood Substitutes: J Trauma Inj Infect Crit Care. 1997;42: 847–856. doi: 10.1097/00005373-199705000-00015 [DOI] [PubMed] [Google Scholar]
- 32.Sakai H, Hara H, Yuasa M, Tsai AG, Takeoka S, Tsuchida E, et al. Molecular dimensions of Hb-based O(2) carriers determine constriction of resistance arteries and hypertension. Am J Physiol Heart Circ Physiol. 2000;279: H908–915. [DOI] [PubMed] [Google Scholar]
- 33.Tsai AG, Cabrales P, Manjula BN, Acharya SA, Winslow RM, Intaglietta M. Dissociation of local nitric oxide concentration and vasoconstriction in the presence of cell-free hemoglobin oxygen carriers. Blood. 2006;108: 3603–3610. doi: 10.1182/blood-2006-02-005272 [DOI] [PMC free article] [PubMed] [Google Scholar]
- 34.Vajpayee N, Graham SS, Bem S. Basic Examination of Blood and Bone Marrow. Henry’s Clinical Diagnosis and Management by Laboratory Methods. Elsevier; 2011. pp. 509–535.
- 35.Napolitano LM. Hemoglobin-based Oxygen Carriers: First, Second or Third Generation? Human or Bovine? Where are we Now? Crit Care Clin. 2009;25: 279–301. doi: 10.1016/j.ccc.2009.01.003 [DOI] [PubMed] [Google Scholar]
- 36.Carmichael FJ, Ali AC, Campbell JA, Langlois SF, Biro GP, Willan AR, et al. A phase I study of oxidized raffinose cross-linked human hemoglobin. Crit Care Med. 2000;28: 2283–2292. doi: 10.1097/00003246-200007000-00017 [DOI] [PubMed] [Google Scholar]
- 37.Palmer AF, Zhang N, Zhou Y, Harris DR, Cabrales P. Small-Volume Resuscitation From Hemorrhagic Shock Using High-Molecular-Weight Tense-State Polymerized Hemoglobins. J Trauma Inj Infect Crit Care. 2011;71: 798–807. doi: 10.1097/TA.0b013e3182028ab0 [DOI] [PubMed] [Google Scholar]
- 38.Eaton WA, Henry ER, Hofrichter J, Mozzarelli A. Is cooperative oxygen binding by hemoglobin really understood? Nat Struct Biol. 1999;6: 351–358. doi: 10.1038/7586 [DOI] [PubMed] [Google Scholar]
- 39.Sawicki CA, Gibson QH. Properties of the T State of Human Oxyhemoglobin Studied by Laser Photolysis*. http://www.jbc.org/content/252/21/7538.full.pdf [PubMed]
- 40.Mathews AJ, Olson JS. Assignment of rate constants for O2 and CO binding to α and β subunits within R- and T-state human hemoglobin. Academic Press; 1994;232: 363–386. doi: 10.1016/0076-6879(94)32055-1 [DOI] [PubMed] [Google Scholar]
- 41.Duling BR. Microvascular Responses to Alterations in Oxygen Tension. Circ Res. 1972;31: 481–489. doi: 10.1161/01.RES.31.4.481 [DOI] [PubMed] [Google Scholar]
- 42.Harder DR, Narayanan J, Birks EK, Liard JF, Imig JD, Lombard JH, et al. Identification of a putative microvascular oxygen sensor. Circ Res. 1996;79: 54–61. doi: 10.1161/01.RES.79.1.54 [DOI] [PubMed] [Google Scholar]
- 43.Jackson WF. Arteriolar oxygen reactivity is inhibited by leukotriene antagonists. Am J Physiol—Hear Circ Physiol. 1989;257: H1565–H1572. Available: http://ajpheart.physiology.org/content/257/5/H1565%0Ahttp://files/2262/Jackson%20-%201989%20-%20Arteriolar%20oxygen%20reactivity%20is%20inhibited%20by%20leuko.pdf%0Ahttp://www.ncbi.nlm.nih.gov/pubmed/2511767%0Ahttp://files/2264/H1565.html [DOI] [PubMed] [Google Scholar]
- 44.Erickson HP. Size and shape of protein molecules at the nanometer level determined by sedimentation, gel filtration, and electron microscopy. Biol Proced Online. 2009;11: 32–51. doi: 10.1007/s12575-009-9008-x [DOI] [PMC free article] [PubMed] [Google Scholar]
- 45.Boykins RA, Buehler PW, Jia Y, Venable R, Alayash AI. O-raffinose crosslinked hemoglobin lacks site-specific chemistry in the central cavity: Structural and functional consequences of ??93Cys modification. Proteins Struct Funct Genet. 2005;59: 840–855. doi: 10.1002/prot.20453 [DOI] [PubMed] [Google Scholar]
- 46.Buehler PW, Boykins RA, Jia Y, Norris S, Freedberg DI, Alayash AI. Structural and functional characterization of glutaraldehyde-polymerized bovine hemoglobin and its isolated fractions. Anal Chem. 2005;77: 3466–3478. doi: 10.1021/ac050064y [DOI] [PubMed] [Google Scholar]
- 47.Jia Y, Ramasamy S, Wood F, Alayash AI, Rifkind JM. Cross-linking with O -raffinose lowers oxygen affinity and stabilizes haemoglobin in a non-cooperative T-state conformation. Biochem J. 2004;384: 367–375. doi: 10.1042/BJ20040612 [DOI] [PMC free article] [PubMed] [Google Scholar]
- 48.Buehler Paul W., Boykins Robert A., Jia Yiping, Norris Scott, Freedberg Darón I. and, Alayash Abdu I.. Structural and Functional Characterization of Glutaraldehyde-Polymerized Bovine Hemoglobin and Its Isolated Fractions. American Chemical Society; 2005; doi: 10.1021/AC050064Y [DOI] [PubMed] [Google Scholar]
- 49.Ali AA, Ali GS, Steinke JM, Shepherd AP. Co-Oximetry Interference by Hemoglobin-Based Blood Substitutes. Anesth Analg. 2001; 863–869. doi: 10.1097/00000539-200104000-00012 [DOI] [PubMed] [Google Scholar]
- 50.Day TK. Current development and use of hemoglobin-based oxygen-carrying (HBOC) solutions. J Vet Emerg Crit Care. Blackwell Publishing; 2003;13: 77–93. doi: 10.1046/j.1435-6935.2003.00084.x [Google Scholar]
- 51.Allen JW, Bhatia SN. Formation of steady-state oxygen gradients in vitro: Application to liver zonation. Biotechnol Bioeng. 2003;82: 253–262. doi: 10.1002/bit.10569 [DOI] [PubMed] [Google Scholar]
- 52.Lindros KO. Zonation of cytochrome P450 expression, drug metabolism and toxicity in liver. Gen Pharmacol. 1997;28: 191–196. [DOI] [PubMed] [Google Scholar]
Associated Data
This section collects any data citations, data availability statements, or supplementary materials included in this article.
Supplementary Materials
This file outlines the equations and parameters for the COMSOL model used to analyze oxygenation in a single hollow fiber contained in the bioreactor.
(DOCX)
Table containing the biophysical properties for each of the PolyhHbs synthesized in this study.
(XLSX)
Data Availability Statement
All relevant data are within the paper and its Supporting Information files.


