

Mice born by C-section developed increased body weight and lacked microbiota developmental changes observed in control mice.
Abstract
Epidemiological evidence supports a direct association between early microbiota impact—including C-section—and obesity. We performed antibiotic-free, fostered C-sections and determined the impact on the early microbiota and body weight during development. Mice in the C-section group gained more body mass after weaning, with a stronger phenotype in females. C-section–born mice lacked the dynamic developmental gut microbiota changes observed in control mice. The results demonstrate a causal relationship between C-section and increased body weight, supporting the involvement of maternal vaginal bacteria in normal metabolic development.
INTRODUCTION
C-section is a lifesaving practice that is needed in 10 to 15% of births to avoid risking the life of mother or child (1, 2). However, C-section delivery is often overused, with some regions of the world reaching 43% of births (3). Concomitantly with the increase in C-section, obesity (4–6) and immune-related diseases [type 1 diabetes (7, 8), allergies (3, 9), and celiac disease (10)] are on the rise.
C-section circumvents natural exposure to the vaginal microbiota during labor and birth and, in addition, involves preventive antibiotics, which have also been related to increased risk of the modern diseases mentioned above. Early impacts on the developing microbiota lead to increased obesity in animal models (11, 12). Here, we determined the effect of antibiotic-free, fostered C-sections on body weight gain and gut microbiota during early development in mice.
RESULTS
C-section causes increased body weight gain
A total of 34 C-section–born fostered mice were compared with 35 control mice (fig. S1). C-section–delivered mice showed higher postweaning body mass gain (Fig. 1) and total body mass (fig. S2), in relation to vaginally delivered controls. Overall, mice gained 33% more weight at age 15 weeks if they were born by C-section, but females showed a stronger phenotypic effect, with 70% higher weight gain (Fig. 1), and with body masses similar to those of males (fig. S2). Mice that were delivered by C-section also showed a marginal increase in the proportion of body fat at 15 weeks of age, as determined by dual-energy x-ray absorptiometry (DEXA; fig. S3). These results are consistent with the epidemiological association between C-section and increased risk of obesity (4, 13–16).
Fig. 1. Effect of C-section on developmental changes in body mass.
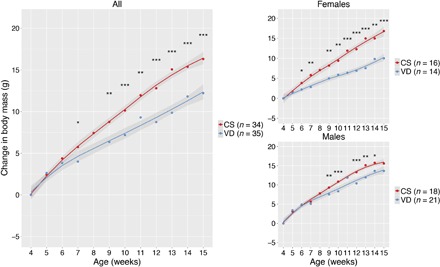
Change in body mass (in grams) in 69 mice discordant to birth mode during early development, relative to 4 weeks of age (postweaning). Lines represent the average, and the shaded area represents 95% confidence interval. Significance was determined by analysis of variance (ANOVA) test, with resampling. *P < 0.05, **P < 0.01, ***P < 0.001. At 15 weeks of age, C-section (CS) females gained 70% more weight than controls versus 14% increased weight gain in males. VD, vaginally born control.
C-section causes abnormal development of the fecal microbiota
By examining the early gut microbiota during the 4 weeks following weaning, we observed a significant segregation by delivery mode [analysis of similarities (ANOSIM), P = 0.001; Fig. 2 and figs. S4 to S8], in both genders and at all time points. Segregation by delivery mode was highest in female mice (fig. S5). Maturation of the microbiome structure in control mice occurred with a progressive approximation (reduction of UniFrac distances) to the fecal microbiota of 6-week-old animals. However, C-section mice showed no major changes in microbiome maturity or structure (Fig. 2, C and D) over the same 4-week period. Fecal microbiota diversity in control animals was highest at weaning and decreased with age (Fig. 3A and fig. S9), unlike in C-section–delivered mice that had a significantly lower α diversity at weaning, which increased with age (Fig. 3A). α diversity differences were consistent across different metrics [phylogenetic diversity (PD) whole tree, observed species, and Shannon index; Fig. 3 and figs. S7, S10, and S11]. Birth mode–discriminatory underrepresented taxa in C-section mice at weaning included Bacteroides, Ruminococcaceae, Lachnospiraceae, and Clostridiales, and overrepresented taxa included S24.7, Lactobacillus, and Erysipelotrichaceae (Fig. 3, B to D, and fig. S11). In general, the proportions of dominant taxa discriminant for birth mode decreased throughout the first 3 weeks after weaning (fig. S8).
Fig. 2. β diversity of gut communities from mice born vaginally or by C-section during early development.
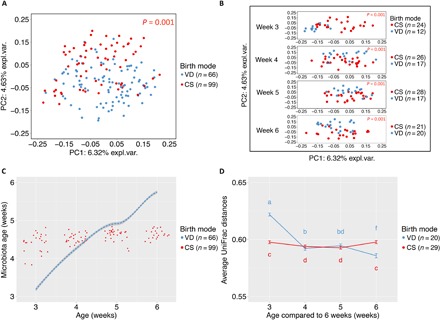
(A) Principal coordinate analysis (PCoA) of the fecal microbiota by birth mode at all time points. Communities segregate significantly by birth mode (P = 0.001). PC, principal coordinate. (B) PCoA of fecal microbiota of mice born vaginally or by C-section (by age). Differences in fecal microbiota were significant during early development, from weaning to week 6 (P = 0.001). (C) Microbiome maturity indices calculated by a random forest model trained on microbial communities from vaginally delivered mice. (D) Unweighted UniFrac distances of fecal communities at any age from 6 weeks of age of vaginally born mice. Distances are highest at weaning and at 6 weeks of age. For (A) and (B), significance was determined pairwise by ANOSIM test, with resampling 999 times. For (D), significance was determined pairwise by ANOVA test, with resampling 999 times.
Fig. 3. Birth mode differences in fecal α diversity and taxonomic composition during early development.
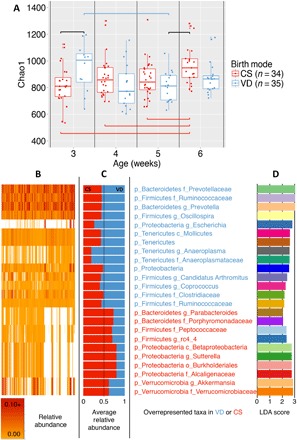
(A) Chao1 index. Diversity in controls was higher at weaning and drops between week 3 and week 5 but increases by week 6, whereas no major age changes were observed in C-section–born mice before week 5. Significance was determined pairwise by ANOVA test, with resampling 999 times; blue brackets compare vaginally born communities, red brackets compare C-section communities, and black brackets compare birth modes. (B) Heat map of relative abundance. (C and D) Average relative abundance of bacterial taxa (C) with significant Linear Discriminant Analysis (LDA) scores (D) by delivery mode from weaning to 6 weeks of age.
DISCUSSION
One limitation of this work is that we could not tell with precision when the phenotype arose before weaning, which is the time when the C-section offspring had already gained significantly more weight than the vaginally born controls (fig. S2). Regardless, developmental weight gains occur at increasingly higher rates in C-section–born animals than in control animals.
Unlike the procedure in humans, C-sections were performed in this work without the use of perinatal antibiotics. The compounded effect of both C-sections and antibiotics is unknown but would be expected to be stronger on the offspring phenotype than C-section alone. Another difference with human C-sections is that our mouse C-section involves fostering because survival C-section attempts were not successful. Future work will be needed to discriminate between the effects of birth mode and fostering.
Early gut microbiota abnormalities associated with C-section are consistent with alterations in bacterial modulation of development in relation to the normal pioneer maternal microbiota, which protects from excessive weight gain. The bacterial taxa found here that are associated with vaginal delivery (Bacteroides, Ruminococcaceae, and Clostridiales) have previously been associated with lean phenotypes in mice (11, 17).
Further research is needed to identify the antiobesogenic individual taxon or combination of taxa responsible for the effects observed here. The results of this work support the idea that birth acquisition of maternal vaginal microbes is needed for normal metabolic development and present important new information of significance in the context of the global obesity epidemics.
MATERIALS AND METHODS
Mice
Experiments were approved by the New York University School of Medicine Institutional Animal Care and Use Committee (NYUSoM IACUC) (protocol IACUC 16-00878). Conventional outbred Swiss Webster mice were maintained under a 12-hour light cycle and fed autoclaved low-fat chow (Purina Pico Rodent #5053). Adult female mice (n = 11) from Taconic Biosciences were time-mated. On gestational day E19, five pregnant females underwent C-section [n = 34 pups (18 males and 16 females)], and litters were fostered by mothers that had delivered vaginally within the previous 48 hours. Six control dams delivered vaginally [n = 35 pups (21 males and 14 females); fig. S1]. Body weight was measured weekly, from weaning to week 15 of age, and fecal samples were collected during early development, from weaning to week 6 of age. DEXA was performed at 15 weeks of age.
DNA extraction and sequencing
Total DNA was extracted from fecal samples using the MoBio PowerSoil kit according to the manufacturer’s instructions, modified as described in the Earth Microbiome Project protocol (http://press.igsb.anl.gov/earthmicrobiome/protocols-and-standards/dna-extraction-protocol/). The V4 region of the 16S ribosomal RNA (rRNA) gene was amplified by polymerase chain reaction (PCR) using barcoded primers, as previously described (18). Reagents for DNA extraction and for PCR amplification were sequenced as controls (19). The amplicons were pooled in equimolar ratios and were sequenced on the Illumina MiSeq platform (Genome Technology Center of NYU Medical Center) using a paired-end technique. 16S rRNA sequences were uploaded to the public database Qiita (study ID #11156).
Data analysis
The effect of delivery mode on the changes in body weight was evaluated by ANOVA test, with resampling. The 16S rRNA gene sequence analyses were performed with the QIIME suite of software tools (v1.9) (20). The filtered sequence reads (Phred Q ≥ 20) were used to pick the operational taxonomic units (OTUs), with an open-reference OTU picking method based on 97% identity to entries in the Greengenes database (v13_8). After the chimeric sequences were removed using ChimeraSlayer (21), communities were rarefied to 3100 reads per sample. The unweighted/weighted UniFrac distances (22) were calculated to obtain the pairwise β diversity (similarities between two communities), which was further evaluated by ANOSIM test using the vegan package in R to test the significance of delivery mode with 999 permutations. The effect of age on microbial community was analyzed by comparing the UniFrac distance between fecal communities at any age and those from vaginally born mice at week 6, using ANOVA test, with resampling. Linear discriminant analysis effect size (LEfSe) (23) was used to search for bacterial taxa that had the largest effects on discriminating grouping factors, that is, delivery mode, by a combination of uni- and multivariate analysis. On the basis of microbial community composition, a random forest model was built with fecal samples from vaginally delivered mice as the training set to predict the maturity indices of mice born via C-section using the randomForest package in R, as previously reported (24).
Supplementary Material
Acknowledgments
Funding: This work was partially supported by the C&D Research Fund (to M.G.D.-B.), the Emch Fund (to M.G.D.-B.), and an Institutional Research Training award T32 AI007180 (K.A.M.). Sequencing at the NYU Genome Technology Center was partially supported by the Cancer Center Support grant no. P30CA016087 at the Laura and Isaac Perlmutter Cancer Center. Author contributions: M.G.D.-B. conceived the study. K.A.M. and M.G.D.-B. designed the study. K.A.M., C.R.L., Y.Y., and Y.C. collected and processed the samples and measured the body weights. K.A.M., J.C.D., J.W., and M.G.D.-B. analyzed and interpreted the data. K.A.M. and M.G.D.-B. wrote the manuscript. Competing interests: M.G.D.-B. has intellectual property and equity and is a Science Advisory Board member of Commense. All other authors declare that they have no competing interests. Data and materials availability: 16S rRNA sequences were uploaded to the public database Qiita (study ID #11156). All data needed to evaluate the conclusions in the paper are present in the paper and/or the Supplementary Materials. Additional data related to this paper may be requested from the authors.
SUPPLEMENTARY MATERIALS
Supplementary material for this article is available at http://advances.sciencemag.org/cgi/content/full/3/10/eaao1874/DC1
fig. S1. Experimental design.
fig. S2. Actual body mass in 69 mice discordant to birth mode during early development.
fig. S3. Percent fat in 24 mice discordant to birth mode at 15 weeks of age.
fig. S4. PCoA of Bray-Curtis distances between fecal communities from weeks 3 to 6 in mice born vaginally or by C-section.
fig. S5. Fecal β diversity in males and females discordant to birth mode at different ages.
fig. S6. Fecal β diversity in mice delivered by C-section or vaginally born controls by gender, at different ages.
fig. S7. Fecal intra– and inter–birth-mode-group UniFrac community distances in male and female mice at different ages.
fig. S8. Fecal intra– and inter–gender-group UniFrac community distances in C-section and vaginally born controls at different ages.
fig. S9. Fecal α diversity in mice discordant to birth mode at different ages.
fig. S10. Rarefaction curves of PD whole tree and observed species α diversity metrics.
fig. S11. LEfSE of communities at weaning (week 3) and young adulthood (week 6) by delivery mode.
fig. S12. Average relative abundance of 24 birth mode LEfSe–discriminant taxa over 3 to 6 weeks of age.
table S1. Number of fecal specimens from mouse lineages differing in birth mode.
REFERENCES AND NOTES
- 1.Hannah M. E., Hannah W. J., Hewson S. A., Hodnett E. D., Saigal S., Willan A. R.; Term Breech Trial Collaborative Group , Planned caesarean section versus planned vaginal birth for breech presentation at term: A randomised multicentre trial. Lancet 356, 1375–1383 (2000). [DOI] [PubMed] [Google Scholar]
- 2.Ye J., Zhang J., Mikolajczyk R., Torloni M. R., Gülmezoglu A. M., Betran A. P., Association between rates of caesarean section and maternal and neonatal mortality in the 21st century: A worldwide population-based ecological study with longitudinal data. BJOG 123, 745–753 (2016). [DOI] [PMC free article] [PubMed] [Google Scholar]
- 3.Betrán A. P., Ye J., Moller A.-B., Zhang J., Gülmezoglu A. M., Torloni M. R., The increasing trend in caesarean section rates: Global, regional and national estimates: 1990–2014. PLOS ONE 11, e0148343 (2016). [DOI] [PMC free article] [PubMed] [Google Scholar]
- 4.Barros A. J. D., Santos L. P., Wehrmeister F., Motta J. V. S., Matijasevich A., Santos I. S., Menezes A. M. B., Gonçalves H., Assunção M. C. F., Horta B. L., Barros F. C., Caesarean section and adiposity at 6, 18 and 30 years of age: Results from three Pelotas (Brazil) birth cohorts. BMC Public Health 17, 256 (2017). [DOI] [PMC free article] [PubMed] [Google Scholar]
- 5.Huh S. Y., Rifas-Shiman S. L., Zera C. A., Rich Edwards J. W., Oken E., Weiss S. T., Gillman M. W., Delivery by caesarean section and risk of obesity in preschool age children: A prospective cohort study. Arch. Dis. Child. 97, 610–616 (2012). [DOI] [PMC free article] [PubMed] [Google Scholar]
- 6.Mueller N. T., Mao G., Bennet W. L., Hourigan S. K., Dominguez-Bello M. G., Appel L. J., Wang X., Does vaginal delivery mitigate or strengthen the intergenerational association of overweight and obesity? Findings from the Boston Birth Cohort. Int. J. Obes. 41, 497–501 (2017). [DOI] [PMC free article] [PubMed] [Google Scholar]
- 7.Phillips J., Gill N., Sikdar K., Penney S., Newhook L. A., History of cesarean section associated with childhood onset of T1DM in Newfoundland and Labrador, Canada. J. Environ. Public Health 2012, 635097 (2012). [DOI] [PMC free article] [PubMed] [Google Scholar]
- 8.EURODIAB ACE Study Group , Variation and trends in incidence of childhood diabetes in Europe. Lancet 355, 873–876 (2000). [PubMed] [Google Scholar]
- 9.Bager P., Wohlfahrt J., Westergaard T., Caesarean delivery and risk of atopy and allergic disease: Meta-analyses. Clin. Exp. Allergy 38, 634–642 (2008). [DOI] [PubMed] [Google Scholar]
- 10.Decker E., Engelmann G., Findeisen A., Gerner P., Laaβ M., Ney D., Posovszky C., Hoy L., Hornef M. W., Cesarean delivery is associated with celiac disease but not inflammatory bowel disease in children. Pediatrics 125, e1433–e1440 (2010). [DOI] [PubMed] [Google Scholar]
- 11.Cox L. M., Yamanishi S., Sohn J., Alekseyenko A. V., Leung J. M., Cho I., Kim S. G., Li H., Gao Z., Mahana D., Zárate Rodriguez J. G., Rogers A. B., Robine N., Loke P., Blaser M. J., Altering the intestinal microbiota during a critical developmental window has lasting metabolic consequences. Cell 158, 705–721 (2014). [DOI] [PMC free article] [PubMed] [Google Scholar]
- 12.Cox L. M., Blaser M. J., Pathways in microbe-induced obesity. Cell Metab. 17, 883–894 (2013). [DOI] [PMC free article] [PubMed] [Google Scholar]
- 13.Blustein J., Attina T., Liu M., Ryan A. M., Cox L. M., Blaser M. J., Trasande L., Association of caesarean delivery with child adiposity from age 6 weeks to 15 years. Int. J. Obes. 37, 900–906 (2013). [DOI] [PMC free article] [PubMed] [Google Scholar]
- 14.Goldani H. A. S., Bettiol H., Barbieri M. A., Silva A. A. M., Agranonik M., Morais M. B., Goldani M. Z., Cesarean delivery is associated with an increased risk of obesity in adulthood in a Brazilian birth cohort study. Am. J. Clin. Nutr. 93, 1344–1347 (2011). [DOI] [PubMed] [Google Scholar]
- 15.Mueller N. T., Whyatt R., Hoepner L., Oberfield S., Dominguez-Bello M. G., Widen E. M., Hassoun A., Perera F., Rundle A., Prenatal exposure to antibiotics, cesarean section and risk of childhood obesity. Int. J. Obes. 39, 665–670 (2015). [DOI] [PMC free article] [PubMed] [Google Scholar]
- 16.Flemming K., Woolcott C. G., Allen A. C., Veugelers P. J., Kuhle S., The association between caesarean section and childhood obesity revisited: A cohort study. Arch. Dis. Child. 98, 526–532 (2013). [DOI] [PubMed] [Google Scholar]
- 17.Ridaura V. K., Faith J. J., Rey F. E., Cheng J., Duncan A. E., Kau A. L., Griffin N. W., Lombard V., Henrissat B., Bain J. R., Muehlbauer M. J., Ilkayeva O., Semenkovich C. F., Funai K., Hayashi D. K., Lyle B. J., Martini M. C., Ursell L. K., Clemente J. C., Van Treuren W., Walters W. A., Knight R., Newgard C. B., Heath A. C., Gordon J. I., Gut microbiota from twins discordant for obesity modulate metabolism in mice. Science 341, 1241214 (2013). [DOI] [PMC free article] [PubMed] [Google Scholar]
- 18.Caporaso J. G., Lauber C. L., Walters W. A., Berg-Lyons D., Huntley J., Fierer N., Owens S. M., Betley J., Fraser L., Bauer M., Gormley N., Gilbert J. A., Smith G., Knight R., Ultra-high-throughput microbial community analysis on the Illumina HiSeq and MiSeq platforms. ISME J. 6, 1621–1624 (2012). [DOI] [PMC free article] [PubMed] [Google Scholar]
- 19.Salter S. J., Cox M. J., Turek E. M., Calus S. T., Cookson W. O., Moffatt M. F., Turner P., Parkhill J., Loman N. J., Walker A. W., Reagent and laboratory contamination can critically impact sequence-based microbiome analyses. BMC Biol. 12, 87 (2014). [DOI] [PMC free article] [PubMed] [Google Scholar]
- 20.Caporaso J. G., Kuczynski J., Stombaugh J., Bittinger K., Bushman F. D., Costello E. K., Fierer N., Peña A. G., Goodrich J. K., Gordon J. I., Huttley G. A., Kelley S. T., Knights D., Koenig J. E., Ley R. E., Lozupone C. A., McDonald D., Muegge B. D., Pirrung M., Reeder J., Sevinsky J. R., Turnbaugh P. J., Walters W. A., Widmann J., Yatsunenko T., Zaneveld J., Knight R., QIIME allows analysis of high-throughput community sequencing data. Nat. Methods 7, 335–336 (2010). [DOI] [PMC free article] [PubMed] [Google Scholar]
- 21.Edgar R. C., Haas B. J., Clemente J. C., Quince C., Knight R., UCHIME improves sensitivity and speed of chimera detection. Bioinformatics 27, 2194–2200 (2011). [DOI] [PMC free article] [PubMed] [Google Scholar]
- 22.Lozupone C., Lladser M. E., Knights D., Stombaugh J., Knight R., UniFrac: An effective distance metric for microbial community comparison. ISME J. 5, 169–172 (2011). [DOI] [PMC free article] [PubMed] [Google Scholar]
- 23.Segata N., Izard J., Waldron L., Gevers D., Miropolsky L., Garrett W. S., Huttenhower C., Metagenomic biomarker discovery and explanation. Genome Biol. 12, R60 (2011). [DOI] [PMC free article] [PubMed] [Google Scholar]
- 24.Bokulich N. A., Chung J., Battaglia T., Henderson N., Jay M., Li H., Lieber A. D., Wu F., Perez-Perez G. I., Chen Y., Schweizer W., Zheng X., Contreras M., Dominguez-Bello M. G., Blaser M. J., Antibiotics, birth mode, and diet shape microbiome maturation during early life. Sci. Transl. Med. 8, 343ra382 (2016). [DOI] [PMC free article] [PubMed] [Google Scholar]
Associated Data
This section collects any data citations, data availability statements, or supplementary materials included in this article.
Supplementary Materials
Supplementary material for this article is available at http://advances.sciencemag.org/cgi/content/full/3/10/eaao1874/DC1
fig. S1. Experimental design.
fig. S2. Actual body mass in 69 mice discordant to birth mode during early development.
fig. S3. Percent fat in 24 mice discordant to birth mode at 15 weeks of age.
fig. S4. PCoA of Bray-Curtis distances between fecal communities from weeks 3 to 6 in mice born vaginally or by C-section.
fig. S5. Fecal β diversity in males and females discordant to birth mode at different ages.
fig. S6. Fecal β diversity in mice delivered by C-section or vaginally born controls by gender, at different ages.
fig. S7. Fecal intra– and inter–birth-mode-group UniFrac community distances in male and female mice at different ages.
fig. S8. Fecal intra– and inter–gender-group UniFrac community distances in C-section and vaginally born controls at different ages.
fig. S9. Fecal α diversity in mice discordant to birth mode at different ages.
fig. S10. Rarefaction curves of PD whole tree and observed species α diversity metrics.
fig. S11. LEfSE of communities at weaning (week 3) and young adulthood (week 6) by delivery mode.
fig. S12. Average relative abundance of 24 birth mode LEfSe–discriminant taxa over 3 to 6 weeks of age.
table S1. Number of fecal specimens from mouse lineages differing in birth mode.