

Geometrically optimized sampling of drug-dose combinations enables systematic identification of high-order drug synergies.
Abstract
Combinations of three or more drugs are used to treat many diseases, including tuberculosis. Thus, it is important to understand how synergistic or antagonistic drug interactions affect the efficacy of combination therapies. However, our understanding of high-order drug interactions is limited because of the lack of both efficient measurement methods and theoretical framework for analysis and interpretation. We developed an efficient experimental sampling and scoring method [diagonal measurement of n-way drug interactions (DiaMOND)] to measure drug interactions for combinations of any number of drugs. DiaMOND provides an efficient alternative to checkerboard assays, which are commonly used to measure drug interactions. We established a geometric framework to factorize high-order drug interactions into lower-order components, thereby establishing a road map of how to use lower-order measurements to predict high-order interactions. Our framework is a generalized Loewe additivity model for high-order drug interactions. Using DiaMOND, we identified and analyzed synergistic and antagonistic antibiotic combinations against Mycobacterium tuberculosis. Efficient measurement and factorization of high-order drug interactions by DiaMOND are broadly applicable to other cell types and disease models.
INTRODUCTION
Combinations with three or more drugs are the cornerstone of treatment for many diseases including cancer, HIV, and tuberculosis (TB). Therefore, it is important to understand how combining drugs changes treatment efficacy. In synergistic or antagonistic drug interactions, drugs in combination may be, respectively, more or less effective than what is expected from the individual drugs. Treatments that include a synergistic combination achieve the same efficacy with a relatively lower total dose, potentially improving efficacy, alleviating side effects, and shortening treatment (1, 2).
TB treatment remains difficult, and combinations of three or more drugs (high-order combinations) are the standard of care for active TB. The current treatment regimen for drug-sensitive TB uses a four-drug combination for 2 months, followed by a two-drug combination for at least 4 months (3). Drug-resistant TB therapy is more arduous, involving long-term, high-order combinations of antibiotics with severe side effects (4). Despite the critical importance of this information for treatment, high-order interactions are rarely measured and analyzed in any disease. For example, because of the high number of measurements required to measure three-way interactions by the standard checkerboard assay, there is a relative scarcity of these measurements. Targeted studies that have sought to predict three-way interactions from pairwise measurements in Escherichia coli have found that pairwise and three-way interaction measurements are correlated (5, 6). These prediction methods are likely to be useful in prioritizing combinations for further study, but cannot fill the need for experimental measurement of high-order interactions. In the case of TB, we lack measurement of high-order drug interactions and reliable, systematic measurement of pairwise interactions against Mycobacterium tuberculosis (Mtb), the causative agent of TB. Therefore, drug interactions are not routinely considered in drug regimen design (7–11). Thus, a more efficient methodology to measure drug interactions would enable us not only to comprehensively measure pairwise interactions but also to interrogate high-order drug combinations and establish tools to predict high-order synergistic combinations for further testing early in preclinical regimen design.
The absence of systematic studies of high-order drug interactions is due to three significant challenges. The first challenge is the experimental measurement of high-order drug interactions. Pairwise drug interactions are traditionally determined by a two-dimensional (2D) checkerboard assay (Fig. 1A). To evaluate D = 10 different doses for each drug in a pairwise combination, the response to D2 = 100 dose combinations must be measured, which requires the preparation and measurement of cell growth in one microplate. A high-order drug interaction among n drugs can be determined using a high-dimension checkerboard assay (12). However, this measurement technique is very expensive and can be logistically prohibitive (13): If D doses are used for each drug, then Dn dose combinations need to be assessed. If, for example, we were to measure a five-way drug interaction (n = 5) at a resolution of 10 doses for each drug (D = 10), a 5D checkerboard assay necessitates the measurement of cell response in 105 combinations, requiring 1000 microplates. Another serious limitation is that these tests would require vast amounts of drugs, and the cost and availability of drugs, especially natural products, preclude such experiments. Because we lack efficient measurement procedures, drug interactions of four or more drugs remain uncharacterized, and there are few examples in literature that report three-way drug interactions.
Fig. 1. DiaMOND for measuring pairwise drug interactions.
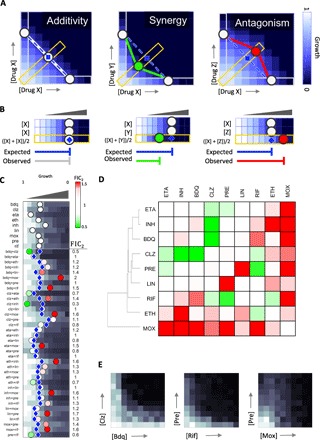
(A) Simulated 2D checkerboard assay as demonstration of additive (left), synergistic (middle), and antagonistic (right) pairwise drug combinations. In each assay, one drug is linearly increased on each axis, and growth inhibition (white to blue color bar) is recorded for each concentration combination. A combination of a drug with itself will yield linear isophenotypic contours (isoboles). Drug combinations with linear, concave, or convex isoboles are classified as additive, synergistic, or antagonistic, respectively. To efficiently approximate the isoboles, DiaMOND samples the most information-rich dose responses of the checkerboard: the single-drug dose responses (white rectangles) and the 1:1 two-drug combination dose response (yellow rectangle; along the diagonal of the checkerboard). The dashed blue line connecting the observed single-drug dose responses approximates the additivity isobole for a given phenotype (for example, IC50), and the intersection of this line with the two-drug dose response is the expected dose in the null model (e1; blue diamond). The circles indicate the drug doses that result in the particular phenotype for each dose response. In this setting, the blue diamond (e1) will be the same distance as, closer to, or further from the origin in additive, synergistic, or antagonistic combinations. The circles are colored by drug interaction type throughout the manuscript: white, additivity; green, synergy, red, antagonism. (B) DiaMOND experimental setup to measure pairwise drug interactions requires three dose-response experiments, where drug dose is linearly increased. Two dose responses are single-drug dose responses. In the third dose-response experiment (yellow rectangle), a 1:1 mixture of drug X and drug Y is linearly increased. This mixture has half the concentration of both drug X and drug Y, and its dose response is the dose response of the diagonal sampling shown in (A). The expected dose (e1), shown by a blue diamond, is calculated using the geometric argument described in (A). When the observed dose is the same as, less than, or more than the expected dose, additivity, synergy, or antagonism is concluded, respectively. The brackets illustrate the expected (e1) and observed (o2) doses for the two-drug dose response (see also fig. S1). (C) All pairwise interactions among nine antibiotics tested in Mtb. The dose response of nine antibiotics and all 36 pairwise combinations is shown. Circles or blue diamonds mark the observed or expected IC50, respectively. Circles smaller or larger than expectation are marked by green or red, indicating synergy or antagonism. FIC2 scores obtained by dividing observed with expected IC50 are shown on the right of each two-drug dose response. (D) Hierarchical clustering of the pairwise interactions among nine antibiotics. The geometric mean of two biological replicates is represented. (E) Validation of two synergies and one antagonism via the traditional checkerboard method in Mtb. Simulated dose-response data are shown in blue gradient, and experimentally determined dose-response data are shown in grayscale gradient throughout.
Ideally, drug interactions are scored from a checkerboard assay relative to the simple null model, indicating that the interaction of a drug with itself is additive (14, 15). Thus, with the Loewe additivity model, if a combination’s effect is higher or lower than additivity, the combination is synergistic or antagonistic, respectively (Fig. 1A). We may visualize this intuitive interpretation of the checkerboard by evaluating the contour of a common phenotype (isobole). A straight contour indicates additivity, whereas concave and convex contours are observed in synergistic and antagonistic interactions, respectively (Fig. 1A). The shape of this curve is quantified using the fractional inhibitory concentration (FIC), the standard metric of interaction scores. In the absence of an efficient checkerboard assay, the Bliss multiplicative model has become a commonly used scoring system for determining drug interactions. The Bliss multiplicative model defines the expected phenotype [such as median inhibitory concentration (IC50) for 50% growth inhibition] as the multiplication of the phenotype induced by each drug, and therefore, Bliss scoring enables an efficient experimental setup where measurement at only four conditions is adequate to score a pairwise interaction. Hence, Bliss scoring is useful for understanding the interaction of drugs at therapeutically relevant concentrations (16). Despite this advantage in efficiency, the Bliss model lacks a null model; therefore, one cannot do a control drug interaction experiment that, by definition, will result in noninteraction (17). The same drug’s combination with itself might result in synergy, independence, or antagonism, depending on the concentration chosen to sample the drug’s dose response (18). In contrast, the Loewe additivity model produces a single interaction score, which is an integration of the whole range of concentrations that may be combined. Thus, a measurement methodology that is more efficient than a traditional checkerboard with Loewe additivity scoring would empower systematic measurement of pairwise and high-order drug interactions.
The second challenge is the evaluation and interpretation of high-order drug interactions. When two drugs are combined, the measured interaction is simply their pairwise interaction. However, when three drugs are combined, the measured interaction encapsulates three pairwise interactions and one three-way interaction. A three-way interaction, therefore, may refer to either (i) a total observed interaction, which compares the three-way combination effect with single drugs, or (ii) an emergent interaction, which compares the three-way combination effect with the expectation from the underlying pairwise interactions. For example, a three-way combination would have emergent synergy if the total interaction is more synergistic than the expectation based on the three pairwise interactions alone. In this setting, if pairwise interactions were antagonistic and total interaction was additive, then the emergent three-way interaction must be synergistic. Understanding the emergent effect of a high-order interaction that is not predicted by lower-order combinations requires a scoring framework to factorize high-order interaction scores into meaningful components. Score factorization was recently developed for three-way interactions scored with the Bliss independence model (19), but no such framework exists for the factorization of high-order drug interactions using intuitive Loewe additivity scoring.
The third challenge is predicting the strongest synergies among the large number of possible high-order drug combinations to facilitate efficient prioritization of optimal drug regimens. As noted above, the experimental measurement of even one five-way drug interaction is prohibitively expensive. However, there are, for example, 15,504 different five-way combinations possible among 20 drugs. An experimental screen of high-order drug interactions is therefore not possible, and finding synergistic high-order combinations requires the development of tools to predict synergistic combinations. Two recent studies used Bliss scoring to analyze three-way drug interactions in E. coli and in cancer cells and found that they are largely determined by the pairwise interactions among the constituent drugs (5, 6). Neither of these studies, however, systematically evaluated or analyzed the emergent interactions of high-order combinations. Several pairwise drug interaction screens have reported that synergy is rare, whereas antagonism is more common than additivity and synergy (20–23). Because any experimental search for synergy will necessarily screen a very small percentage for high-order combinations, the ability to predict high-order interactions is essential to prioritize candidate synergistic high-order combinations.
The absence of an efficient measurement technique for drug interactions has limited the ability to fully pursue these challenges to systematically measure drug interactions, understand central questions about high-order drug interactions, and prioritize synergistic combinations in preclinical testing. Here, we present a methodology that uses a diagonal sampling of the checkerboard assay to efficiently measure and score pairwise or high-order drug interactions, which extends on the theoretical work of Berenbaum (24). Our methodology, DiaMOND (diagonal measurement of n-way drug interactions), requires only n + 1 dose responses and produces the FIC of the n-way drug interaction. We used DiaMOND to measure all pairwise interactions among nine TB antibiotics and all possible high-order combinations among five antibiotics in Mtb, revealing synergies in three pairwise, three three-way, and two four-way combinations. With these drug interaction data, we generalized the Loewe additivity model to systematically explore high-order drug combinations and develop a framework that factorizes the components of a high-order drug interaction to resolve contributions from each emergent drug interaction. We demonstrate that high-order interactions can often be predicted by their lower-order combinations, but we also identified one three-way drug combination with strong emergent antagonism, highlighting the importance of measuring high-order interactions. Our study provides a unifying framework to measure, score, classify, and predict high-order drug interactions. We applied DiaMOND to identify and analyze synergistic drug combinations against Mtb; however, DiaMOND’s application is not limited to drug studies in Mtb and may also be used to systematically and efficiently measure and analyze the interactions of multiple drugs, cytokines, or other molecules on cellular behavior.
RESULTS
Diagonal sampling method to measure pairwise drug interactions
Pairwise drug interactions are traditionally measured by a 2D checkerboard assay. Examples of checkerboards for additive, synergistic, and antagonistic pairs are shown in Fig. 1A with simulated values. The synergy or antagonism of a drug pair is assessed by the shape of the isobole (or contour of the chosen phenotype, such as IC50 for 50% growth inhibition). For two drugs, X and Y, Loewe additivity is defined as . On a checkerboard assay, an FIC2 = 1 corresponds to the straight line connecting IC50X and IC50Y (Fig. 1A). Synergistic pairs achieve the same phenotype with lower concentrations of the combined drugs and their checkerboards have a concave contour, giving FIC2 scores between 0 and 1 (Fig. 1A, middle), and checkerboards of antagonistic pairs have convex contours with FIC2 scores > 1 (Fig. 1A, right).
We sought to minimize the number of measurements required by this assay and reasoned that the entirety of the checkerboard was not necessary to quantify the curvature of the contour. Instead, we aimed to sample the checkerboard in regions that provide the most information about the shape of the contour. To do so, we measure three dose responses for each pairwise interaction: (i) the dose response for drug X, (ii) the dose response for drug Y, and (iii) the dose response for an equipotent (1:1) mixture of drug X and drug Y (referred to hereafter as a two-drug dose response). These dose responses correspond to the horizontal, vertical, and diagonal (yellow) rectangles drawn on each checkerboard in Fig. 1A. For each dose response, one can identify the dose that produces a specified phenotype response, such as IC50. In Fig. 1A, we show how a line connecting the IC50 values for drug X, drug Y, and the two-drug combination approximates the contour. To quantify the curvature from these three dose responses, the expected IC50 (e1; blue diamonds in Fig. 1A) of the two-combination dose response is computed on the basis of the null hypothesis that the expected interaction is additive. Thus, e1 is the distance from the origin to the intersection of the straight line connecting IC50 values of single drugs with the two-drug dose response (bracketed in Fig. 1B and see fig. S1 and method S1 for calculation of e1 given two IC50 values).
The curvature of the contour can be approximated by the ratio of the observed IC50 of the two-drug combination (o2; circles in the two-drug dose responses in Fig. 1A) to the expected IC50 in additivity (e1; blue diamonds in Fig. 1A). We therefore define the FIC of a pairwise combination (FIC2) as
| (1) |
The FIC, in both traditional checkerboard assays and with DiaMOND, is not only a measure of contour curvature but also a quantification of the relative efficacy of the combination compared to single drugs. For example, an FIC2 score of 1 (Fig. 1B, left) corresponds to an additive interaction, whereas 0.5 (synergy) or 2 (antagonism) indicate that half or double the dose leads to the same effect, respectively (see fig. S1 for examples of step-by-step calculations of FIC2 given two single-drug and one two-drug dose responses).
The experimental setup for DiaMOND is shown in Fig. 1B, with simulated examples of additivity, synergy, and antagonism. The assay requires two single-drug dose responses and just one two-drug dose response, where the two-drug dose response is a 1:1 mixture of drug X and drug Y concentrations used for the single dose responses (Fig. 1B and fig. S1). This mixture will have half the concentration of both drug X and drug Y, and its dose response will be the dose response of the diagonal sampling shown in Fig. 1A (yellow outline).
Experimental measurement of pairwise drug interactions in Mtb
We used DiaMOND to measure all the pairwise interactions among nine first- and second-line antibiotics (Table 1) against Mtb. We generated the dose response for nine antibiotics individually and the two-drug combination dose response for the 36 pairwise combinations, each in biological duplicate. For each two-drug dose response, the expected IC50 (e1) was computed using single-drug IC50 values. Figure 1C shows one of our experimental screens, where the expected IC50 for each combination is indicated with a blue diamond. To compute FIC2 (Eq. 1), the observed IC50 of the combinations (o2; shown with a circle) was divided by the expected IC50 (e1). The FIC2 scores were highly correlated between biological replicates (Spearman’s correlation r = 0.86, P < 3.7 × 10⁻⁹; fig. S2). The expected and observed drug concentrations used for FIC calculations are not limited to IC50 values, and any measureable parameter from a dose response may be used. Because IC50 is broadly used to measure drug sensitivity in microbes and in cancer cell lines, we chose IC50 for this study. However, dose responses are usually nonlinear, and therefore the FICs may depend on the choice of what level of growth inhibition is used in the FIC calculations (for example, IC50 versus IC30 versus IC70). Taking advantage of the single-drug and two-drug dose responses measured with DiaMOND, we reanalyzed these data and computed FIC2 scores using IC30, IC40, IC60, and IC70. We found that the FIC scores correlated significantly in this range (fig. S3), suggesting that the FIC is not highly dependent on the choice of inhibition level. We conclude that DiaMOND’s measurement layout and scoring (FIC2) are reliable and robust.
Table 1. The drugs used in this study, their abbreviations, target processes, and the minimum inhibitory concentrations (MICs).
| Drug | Abbreviation | Target process | MIC (μg/ml) |
| Bedaquiline | BDQ | ATP synthase | 0.6 |
| Clofazimine | CLZ | DNA replication | 2.8 |
| Ethionamide | ETA | Mycolic acid | 3 |
| Ethambutol | ETH | Mycolic acid | 1.5 |
| Isoniazid | INH | Mycolic acid | 0.18 |
| Linezolid | LIN | Protein synthesis | 3 |
| Moxifloxacin | MOX | DNA gyrase | 0.35 |
| Pretomanid | PRE | Protein synthesis | 0.8 |
| Rifampicin | RIF | RNA polymerase | 0.06 |
To visualize the overall pattern of synergy and antagonism in the 36 pairwise combinations and the similarities in overall interaction patterns among the nine antibiotics, we show the geometric mean of interaction scores (FIC2) from both replicate experiments in Fig. 1D. We used a geometric mean rather than an arithmetic mean because the FIC is a ratio and therefore must be averaged by a geometric mean. For example, an FIC score of 0.5 means half the dose is required for the same effect and a score of 2 means that double the dose is required for the same effect. If we imagine two (noisy) experiments of the same pair that gives scores of 0.5 and 2, the conclusion would be that these drugs are additive. The arithmetic mean of 0.5 and 2 is 1.25, erroneously suggesting antagonism. However, the geometric mean of 0.5 and 2 is 1, and is scored correctly as additive.
In agreement with previous studies, pairwise synergy was rare and antagonism was common in our pairwise measurement set (20–23). However, we identified three pairs with strong and reproducible synergy: clofazimine + bedaquiline, clofazimine + isoniazid, and pretomanid + rifampicin. Of these, synergy between clofazimine and isoniazid and that between clofazimine and bedaquiline have been previously reported (25, 26), but the synergy between pretomanid and rifampicin against Mtb is novel. Other interactions such as the antagonism between moxiflaxocin and rifampicin and that between moxifloxacin and linezolid have been reported previously (16, 27). We note the tendency of moxiflaxocin to exhibit antagonism with nearly all antibiotics tested. Rifampicin + isoniazid was found to be mildly antagonistic, consistent with patient studies that showed antagonism or additivity depending on treatment dose (28–30). The lower bound and upper bound of FIC2 in this set were 0.45 (bedaquiline + clofazimine and clofazimine + isoniazid) and 1.90 (bedaquiline + moxiflaxocin), respectively. These FIC2 values correspond to combinations with approximately double or half the potency of the single drugs. We validated the clofazimine + bedaquiline and pretomanid + rifampicin synergy and the moxifloxacin + pretomanid antagonism using traditional checkerboard assays (Fig. 1E). We conclude that DiaMOND is an efficient and robust way to measure pairwise drug interactions, and we report a novel synergistic antibiotic pairing that had not yet been reported among TB drugs.
Diagonal sampling method to measure high-order drug interactions
In both DiaMOND and the traditional checkerboard assay, the experimental setup of a three-way drug interaction is an extension of the pairwise measurement technique. With a checkerboard assay, a 3D dose space is sampled exhaustively and the curvature of the contour as a plane (as opposed to a line for the pairwise assay) is measured (Fig. 2A). With DiaMOND, we instead sample the most information-rich areas of the 3D dose space with the goal of measuring the contour curvature. Like pairwise drug combinations, for three-way drug interactions, we measure the single-drug dose responses (X, Y, and Z) and the combination dose response (a 1:1:1 mixture of the three drugs). DiaMOND defines an additivity plane using the IC50 for individual drugs, as shown in Fig. 2A, with simulated examples. The distance from the origin to the intersection of this plane with the three-drug dose response is defined as the expected IC50 of the combination, given single drugs (e1; see method S1 for calculation of e1 given three IC50 values). The comparison of the observed IC50 (o3) and e1 is then used to obtain a three-way interaction FIC3 score
| (2) |
Fig. 2. DiaMOND for measuring high-order drug interactions.
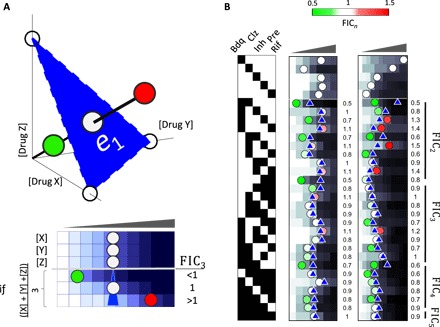
(A) Top: The blue surface connecting the IC50 of three single drugs is used to define the additive expectation. As in the 2D case, the expected dose based on additivity is determined by finding the intersection of the three-drug combination dose response and the blue surface. If the observed IC50 of the equipotent mixture of three drugs is smaller than, equal to, or larger than the additive expectation, synergy, additivity, or antagonism is concluded, respectively. Bottom: DiaMOND experimental setup to measure three-way drug interactions requires four dose-response experiments where drug dose is linearly increased. Three dose responses are single-drug dose responses. In the fourth dose-response experiment, a 1:1:1 mixture of drug A, drug B, and drug C is linearly increased. Expected dose, shown by a blue triangle, is geometrically calculated (method S1). When the observed dose is less than, identical to, or more than the expected dose, synergy, additivity, or antagonism is concluded, respectively. (B) Experimental measurement of all pairwise, three-way, four-way, and five-way interactions among five antibiotics in Mtb. Dose response of five antibiotics and all possible combinations are shown in duplicate. Circles or blue triangles mark the observed or expected IC50, respectively. Circles smaller or larger than expectation are marked by green or red, indicating synergy or antagonism. FICn scores obtained by dividing observed with expected IC50 in this replicate are shown on the right of each n-drug dose response. Simulated dose-response data are shown in blue gradient, and experimentally determined dose-response data are shown in grayscale.
DiaMOND can be directly scaled to measure the interaction score for combinations with any number of drugs. To produce an FICn score for an n-way combination, one needs n single-drug dose responses and one n-drug combination mixture dose response, totaling n + 1 dose-response experiments. Using the IC50 for each of the n single drugs, DiaMOND defines a hyperplane (the contour of additivity). The distance from the origin to the intersection of this hyperplane with the n-drug dose response is defined as the expected IC50 of the combination, given single drugs (e1). Calculation of e1 given IC50 measurements of n drugs is given in method S1. For example, measuring a five-way interaction would only take six dose-response experiments and, hence, can fit into one microplate, making DiaMOND 1000 times more efficient than a 5D checkerboard assay.
FICn is calculated as before
| (3) |
Experimental measurement of high-order interactions in Mtb
Thus, having developed an efficient method to measure high-order drug interactions, we next sought to use this method to find high-order synergistic combinations in Mtb. We applied DiaMOND to five antibiotics that showed pairwise synergy in the pairwise screen: bedaquiline, clofazimine, isoniazid, pretomanid, and rifampicin. We used DiaMOND to measure the interaction of a five-way combination of these antibiotics. This interaction was close to additivity (FIC5 = 0.93). To explore this interaction further, we measured all the pairwise, three-way, and four-way combination dose responses for these drugs in biological duplicate (Fig. 2B). Using DiaMOND, we then computed the interaction scores among all combinations of these five antibiotics (10 FIC2 values, 10 FIC3 values, 5 FIC4 values, and 1 FIC5 value). Our results were reproducible among duplicates (r = 0.56, P < 3 × 10⁻³; fig. S4).
To interpret FIC scores as synergistic, additive, or antagonistic, we generated a model of experimental error. Because a drug is, by definition, additive with itself, the FICn values obtained from interaction measurements of a drug against itself are expected to be 1, and any deviation from this is due to experimental error. We measured the FICn of isoniazid against itself for pairwise, three-way, four-way, and five-way combinations (fig. S5). As expected, the FICn scores from these experiments centered around 1 (mean = 1.00) with an SD of 0.09. We calculated a 95% confidence interval for additivity as 0.82 to 1.18; therefore, combinations with scores smaller or larger than this range are significantly synergistic or antagonistic.
To identify synergistic (and antagonistic) high-order drug combinations against Mtb, we evaluated the geometric mean of two replicates. We discovered one three-way combination (bedaquiline + clofazimine + isoniazid) with particularly strong three-way synergy (FIC3 = 0.62). In addition, we identified the three-way combinations bedaquiline + clofazimine + rifampicin and bedaquiline + pretomanid + rifampicin and four-way combinations bedaquiline + clofazimine + isoniazid + rifampicin and clofazimine + isoniazid + pretomanid + rifampicin as synergistic high-order combinations. We validated the three-way synergy of bedaquiline + clofazimine + isoniazid using a traditional 3D checkerboard of drug concentration combinations where each drug was increased linearly in one axis in a 6 × 6 × 6 matrix (fig. S6). We conclude that the DiaMOND approach can efficiently and reliably measure high-order drug interactions.
Factorization method of high-order drug interaction scores
We observed many high-order synergistic combinations from our exhaustive search among five Mtb drugs. This was not unexpected, because these five drugs were selected for having synergistic pairwise combinations. We next asked whether the high-order interactions scores (FICs) were due entirely to the strength of the underlying lower-order interactions. Thus, we aimed to quantify distinct contributions of the FICn: (i) the emergent interactions of the n-way interactions and (ii) the lower-order interactions that underlie the n-way interaction. DiaMOND can precisely break down an FICn score into these two components (fig. S7). We will first demonstrate this factorization for a three-way combination and then describe a general model for n-way combinations.
The expected value e1 used for FIC3 scoring above was calculated using the IC50 of three individual drugs. Alternatively, we can define expectation based on the strengths of the pairwise interactions. To do so, we construct an expected surface (magenta plane) with the IC50 of the three two-drug dose responses (Fig. 3A). This plane is then the expected contour of additivity accounting for the underlying interactions of the three pairwise interactions that comprise the three-drug combination. We define e2 as the distance from the origin to the intersection of this surface with the three-drug dose response. e2 corresponds to the expected concentration to give IC50 if there is additivity among three pairwise combinations. Notably, calculation of e1 and e2 requires three IC50 values, supplied from single-drug or two-drug dose responses, respectively. e1 = e2 if pairwise combinations are overall additive. If the e2 plane is closer to the origin than the e1 plane (e2 < e1), then pairwise combinations are overall synergistic, whereas if e2 > e1, then pairwise combinations are overall antagonistic.
Fig. 3. DiaMOND for measuring emergent high-order drug interactions.
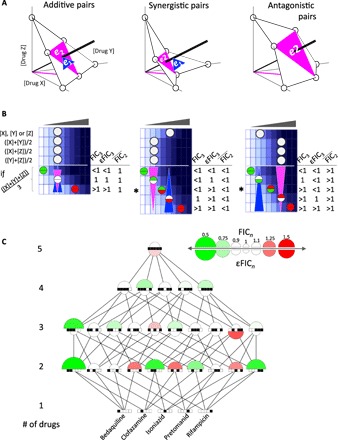
(A) Each circle indicates an observed IC50 in either single-drug or two-drug dose responses for a three-drug combination. The expected surfaces obtained by connecting the IC50 values observed in two-drug combinations are shown in magenta. For clarity, only one two-drug axis [X + Y]/2 is shown as a magenta line. If the observed IC50 of the equipotent mixture of three drugs is smaller than, equal to, or larger than the pairwise expectation, emergent synergy, additivity, or antagonism is concluded, respectively. The blue triangle represents the expected surface given single-drug IC50 values. When pairwise interactions are additive, synergistic, or antagonistic, the expectation given pairs (magenta triangle) will be equal to, smaller than, or larger than the expectation given singles, respectively (blue triangles). (B) Simulated dose responses are given for single drugs, pairwise drugs, and possible outcomes for three-drug dose responses. The blue and magenta triangles mark the additive expectation given single drugs or pairwise combinations, respectively. The top and bottom of the circles representing the observed IC50 values are colored according to the interaction given singles (FICn) and emergent interaction (εFICn) that would be concluded. While two interaction types are the same when drug pairs are additive, a three-drug pair may have opposite interaction types when pairs are synergistic or antagonistic (indicated by “*”). Simulated dose-response data are shown in blue gradient. (C) All interaction scores for two-, three-, four-, and five-way combinations among five antibiotics are shown as a network representation. Nodes are specific combinations, whose contents are indicated by the barcode. The color of a combination shows the FICn or εFICn (geometric mean of two replicates) of a combination, whereas the size corresponds to deviation from additivity (FICn = 1). Edges are drawn between each combination that differs by one drug.
We observe that
| (4) |
This operation factorizes a three-way drug interaction into two components: (i) o3/e2 is a measure of how different the three-way effect is than what would be expected given the two-drug dose-response results. We define o3/e2 as emergent FIC3 (εFIC3), using the same term used by Deshpande et al. (16) in their analysis with the Bliss multiplicative model. (ii) e2/e1 is a measure of the total effect of three pairwise interactions among three drugs. We define e2/e1 as lower-order FIC2 (λFIC2). Therefore, the total FIC3 score may be factored directly into emergent and lower-order components (see also fig. S7).
Emergent and lower-order scores (εFIC3 and λFIC2, respectively) are interpreted like the FIC, with 1 for additivity, <1 for synergy, or >1 for antagonism. For example, when each of the drug pairs in a three-way combination is additive, there is no net effect of drug interaction coming from pairwise interactions (λFIC2 = 1; Fig. 3B, left). In this case, the interaction score is due to the emergent three-way interaction; hence, FIC3 = εFIC3. When pairs in a three-way combination are synergistic (λFIC2 < 1) or antagonistic (λFIC2 > 1), this agreement is not necessarily true. For example, if the observed IC50 falls between e1 and e2, FIC3 and εFIC3 will have opposite interaction types (indicated by “*” in Fig. 3B). We note that both εFIC3 and λFIC2 scores for a particular combination are expected to correlate with FIC3, explaining the previous success in predicting three-way synergy using pairwise interactions (17, 18).
λFIC2 can be approximated by the geometric mean of the FIC2 scores of the three pairwise combinations (fig. S7). Then, FIC3 can be factorized as a product of εFIC3 and the geometric mean of three FIC2 scores ()
| (5) |
The recursive factorization of a four-way drug interaction is shown in method S2. The factorization of an n-order drug interaction is generalized from these examples. For n-way interactions, the expected plane that accounts for the lower-order interactions (en−1) is defined as the multidimensional plane defined by all the (n − 1)–way drug combinations. Therefore, we may write the following to factorize an n-way drug interaction into two components
| (6) |
Each of the FICn−1 may also be represented as , and the equation above takes a recursive form. It is solved as
| (7) |
FIC2 can also be represented as . Drugs are additive with themselves; therefore, FIC1 is 1, which makes FIC2 = εFIC2. By substituting this equivalency, Eq. 7 is transformed into the following equation that allows the quantification of each lower-order emergent interaction’s effect on the final high-order drug interaction observed.
| (8) |
Thus, DiaMOND’s measurements may be simply analyzed to parse total interaction scores into the product of the geometric mean of emergent interaction scores for each lower-interaction group (fig. S7). From this factorization, we can quantify the extent to which each lower-order component influences the FICn score of a high-order drug interaction.
Factorization of high-order drug interaction measurements in Mtb
To understand the relative contribution of the lower-order combinations and the emergent interaction of the high-order combinations to the overall FIC, we used this framework to factorize each of the high-order FICn we measured above into emergent (εFICn) and lower-order interactions (λFICn−1) (fig. S7). Using the two-, three-, and four-drug dose responses among five TB antibiotics, we computed the εFICn score for each high-order interaction experiment (20 three-way, 10 four-way, and 2 five-way). We used the geometric mean of two replicates as εFICn of a combination to evaluate the interactions (see the Supplementary Materials). The FICn and εFICn scores for all combinations are shown as nodes on a tree in Fig. 3C, where addition or subtraction of a drug is indicated with an edge. The most striking εFICn score was 1.3 for clofazimine + pretomanid + rifampicin. This emergent antagonism makes this three-way combination additive, despite the expected synergy given pairwise combinations. To a weaker extent, the same explanation applies for the five-way combination, for which synergy would be the expectation given lower-order interactions. An antagonistic εFIC5 score of 1.14 pushes the FIC5 score to 0.93, close to an additive interaction. FIC4 and εFIC4 scores for clofazimine + isoniazid + pretomanid + rifampicin were 0.78 and 0.9, respectively, indicating that this four-way combination is synergistic and also has emergent synergy. This contrasts with the three-way synergy of bedaquiline + clofazimine + rifampicin, which is synergistic (FIC3 = 0.78), but has no emergent synergy (εFIC3 = 1.06), suggesting that this three-way synergy is primarily due to pairwise synergies.
To understand how much the underlying components contribute to the overall higher-order interactions, we next evaluated the correlations of emergent and lower-order interaction scores to overall FICn in our full experimental set (fig. S7). Emergent interaction scores (εFICn) significantly correlated with total interaction scores (FICn) (Spearman’s r = 0.45, P = 9.6 × 10⁻³; Fig. 4A). Therefore, emergent interactions, which are independent of low-order interactions, are an important component of a high-order drug interaction. We next calculated a lower-order interaction score (λFICn−1) for each combination by dividing FICn with εFICn. λFICn−1 scores correlated with FICn, indicating that lower-order interactions also correlated with high-order interaction scores (r = 0.55, P < 1.0 × 10⁻³). However, εFICn and λFICn−1 scores did not have a significant correlation (r = −0.35, P = 5.2 × 10⁻²). Together, our analysis suggests that both lower-order interactions and emergent interactions correlate with the overall high-order interaction, but that the lower-order and emergent interactions are independent of each other.
Fig. 4. The relationship between high-order interactions and their components.
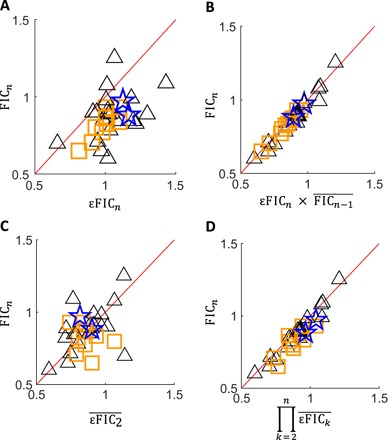
Three-, four-, and five-way interactions are denoted by triangles, squares, and stars, respectively. Each data point is obtained by factorization of one high-order interaction experiment. In each comparison, FICn is shown on the y axis. (A) Emergent interactions significantly correlate with FICn (Spearman’s r = 0.45, P = 9.6 × 10⁻³). (B) The product of emergent interaction and the geometric mean of all FICn−1 scores strongly correlates with FICn (Spearman’s r = 0.97, P = 3.1 × 10⁻²⁰). (C) The geometric mean of all pairwise interactions among the drugs in a high-order combination is not significantly correlated with FICn (Spearman’s r = 0.33, P = 0.06). However, significantly correlates with FIC3, which is observed by the trend of triangles (Spearman’s r = 0.55, P = 1.2 × 10⁻²). (D) The multiplication of the geometric mean of the emergent interaction scores for all orders strongly correlated with FICn (Spearman’s r = 0.90, P = 1.6 × 10⁻¹²).
Finally, we used our measured and calculated component scores to test the theoretical predictions made by our factorization methodology. λFICn−1 significantly correlated with the geometric mean of FICn−1 ( ; r = 0.97, P = 2.8 × 10⁻²¹; figs. S7 and S8), verifying the approximation used in Eq. 6. The multiplication of εFICn and also significantly correlated with FICn (r = 0.97, P = 3.1 × 10⁻²⁰; Fig. 4B), in agreement with Eq. 8.
Prediction of high-order interactions using lower-order emergent drug interactions
With DiaMOND, we have established the methodology for efficient measurement and analysis of pairwise and high-order drug combinations. However, systematic searches for synergistic high-order combinations are impeded by the large number of combinations, and even the improved efficiency of DiaMOND’s measurement procedure cannot fully enable systematic experiments. Previous work has shown that pairwise interactions could largely predict three-way drug interactions (5, 6). These studies suggest that prediction of three-way interactions from the nature of the underlying pairwise interactions, if quantitatively tractable, may enable us to enrich candidates for synergistic three-way combinations for further measurement.
We next aimed to use our high-order drug interaction scores and their factorization into emergent and lower-order contributions to test the hypothesis that lower-order interactions could be used for data-driven prediction of high-order interactions. The factorization of high-order interactions provides an immediate way to predict FICn (see above). Experimentally determined emergent interaction scores (εFIC) can be used in Eq. 8 to produce an approximation for FICn, using the definition of εFIC2 = FIC2 to simplify the recursive formula. As we have already determined all εFIC2, εFIC3, εFIC4, and εFIC5 scores for all combinations in our screen, we next calculated the scores for all three-way, four-way, and five-way interactions; the scores for all four-way and five-way interactions; and the score for the five-way interaction. According to Eq. 8, each of these score sets equally influences a high-order drug interaction score FICn. The multiplication of each of these score sets and εFICn of a high-order combination should approximate the FICn of the combination (see fig. S7 for examples of and FIC3 calculation). The final approximation of FICn depends on the data quality of experimental measurements of lower-order interactions, highlighting the importance of reproducibility in the prediction of high-order drug interactions.
When all combinations were considered, pairwise scores did not significantly correlate with high-order interaction scores (FICn; r = 0.33, P = 0.06; Fig. 4C). However, when only three-way interactions were considered (triangles), pairwise interaction scores ( significantly correlated with the interactions at high order (FICn; r = 0.55, P = 1.2 × 10⁻²). These observations suggest that a simple geometric mean of all FIC2 scores is a good predictor of three-way interaction scores, but that pairwise scores could not predict interactions of more than three drugs. In contrast, we find a significant but weaker correlation when and scores are included to predict FICn for four-way and five-way interactions, respectively (r = 0.45, P = 9.9 × 10⁻³), suggesting that lower-order interactions influence but do not strongly predict overall FIC. This suggests that the knowledge of all lower-order emergent interactions has some predictive potential, even in the absence of εFICn. When the high-order combination’s εFICn is also considered, the agreement between prediction and experiments was very strong (r = 0.90, P = 1.6 × 10⁻¹²) (Fig. 4D). Therefore, we conclude that the prediction of high-order drug interactions can be achieved by systematically measuring emergent interaction scores. These scores can be combined in Eq. 8 to make interaction predictions on high-order combinations and rank these combinations by likelihood of synergy.
DISCUSSION
Here, we present DiaMOND, a methodology to make robust measurements for pairwise or higher-order drug interactions. DiaMOND relies on the construction of dose responses for drug mixtures and comparison with the dose response of component drugs under the Loewe additivity model for drug interactions. Sampling a small part of the traditionally used experimental setup allows efficient measurements for pairwise or high-order drug interactions. DiaMOND’s efficiency also enables the practical use of Loewe additivity in producing immediately interpretable and widely used FIC interaction scores for combinations of many drugs. Drug interaction measurement by DiaMOND is broadly applicable for any agent that results in a specified phenotype. Here, we successfully applied DiaMOND to measure pairwise and high-order interactions among antibiotics effective against Mtb. We propose DiaMOND as an alternative to checkerboard assays for drug interaction measurements, especially for high-order interactions. The robustness of DiaMOND, despite the difficulty of working with slow-growing mycobacteria, suggests that DiaMOND may be applied to other challenging experimental systems.
With precise measurement of interactions among many drugs, we can evaluate the current guidelines and consider alternative regimens in search of better drug combination options for latent, drug-sensitive, and drug-resistant TB. Here, we uncovered surprisingly strong drug synergies including pairwise (bedaquiline + clofazimine, pretomanid + rifampicin), three-way (bedaquiline + clofazimine + isoniazid), and four-way (bedaquiline + clofazimine + isoniazid + rifampicin) combinations. Interestingly, none of the high-order interactions were as synergistic as pairwise synergies. However, note that multidrug regimens are often used to block resistance evolution paths (31). Although the identified three-way and four-way synergistic combinations have weaker synergy than pairwise combinations, they may be more effective against resistance. Of particular interest is the tendency of moxifloxacin to show frequent antagonism, including with rifampicin (32) or pretomanid, because moxifloxacin is used in combination with these antibiotics in clinical trials (33, 34). These observations are a reminder that synergy that is observed in vitro is not necessarily associated with a better treatment, because resistance evolution, adverse drug interactions, combination pharmacokinetics/pharmacodynamics, and other considerations may influence treatment success. Given the toxicity and adverse side effects of many second-line antibiotics and drugs in the development pipeline of TB therapeutics, a detailed, systematic, and quantitatively rigorous understanding of drug synergies and antagonisms may help accelerate the design of multidrug regimens for testing in animals and in adaptive clinical trials (3).
Apart from measuring a high-order interaction, DiaMOND can also factorize a high-order drug interaction into components. Here, we characterize a straightforward relationship between the three basic types of interaction scores: The total score is a product of the emergent interaction of the high-order interaction and the geometric means of each lower-order interaction group. This breakdown of interaction scores, applied to our compendium of drug interaction scores in Mtb, enabled us to address several important questions. First, we established that lower-order interactions are moderate predictors of high-order interactions. This may help us use easy-to-measure pairwise interactions to apply data-driven design of screens for high-order drug interactions instead of exhaustive searches. Even with the efficacy of DiaMOND, an exhaustive search of all high-order combinations among 20 drugs is not practical because this would take 100,000 microplates, whereas a comprehensive pairwise interaction screen requires many fewer plates (by four orders of magnitude). Second, despite the good predictive value of low-order interactions to higher orders, there were strong emergent interaction scores, highlighting the importance of experimental verification of high-order drug interaction measurements in the design of multidrug regimens.
DiaMOND’s conceptual framework to study specific drug interactions may be adapted to study interactions in a more nuanced way. For example, in TB, some interactions can be synergistic or antagonistic in animal models or during the course of clinical treatment depending on treatment timing and dose (16, 28–30). The dose dependency may be due to scoring by the Bliss methodology, which can yield fundamentally different interaction scores depending on drug concentration, or the dose dependencies may be due to contours of the checkerboard that are convex in one combination-dose region and concave in another. The DiaMOND methodology can be customized to identify interactions that are inherently dose dependent by expanding the regions of geometric sampling.
Combination therapy is used not only to treat TB and other infectious diseases but also for many cancers. With combination therapies, we have the opportunity to combine synergistic drugs but have been limited by a practical inability to systematically measure and prioritize drug combinations for testing. The DiaMOND methodology is efficient, inexpensive, and intuitive, and therefore may be used to develop a more balanced emphasis on data-driven modeling and experimental verification in preclinical drug regimen design for a broad range of disease models.
METHODS
Strains and culturing
A pantothenate and leucine auxotrophic strain of Mtb H37Rv was used for experiments (29). Bacteria were grown to mid-log phase with shaking at 37°C, in 7H9 medium supplemented with 0.05% Tween 80, 0.2% glycerol, 10% BBL Middlebrook OADC enrichment (VWR), leucine (50 μg/ml), and pantothenate (24 μg/ml).
Growth inhibition assays
Drugs were dissolved in dimethyl sulfoxide and stored at −20°C. The minimum inhibitory concentration for each drug is given in Table 1. Assays were performed in clear, flat-bottom 384-well microplates by dispensing nanoliter volumes of drugs using a digital drug dispenser (D300e Digital Dispenser, HP). Dispense locations were randomized within each plate using the software to minimize the plate position effect. Mid-log phase cultures were diluted to an optical density (OD) of 0.05 in fresh supplemented 7H9 medium, and 50-μl diluted cells were added to each well. Plates were sealed with aluminum plate seals and incubated without shaking at 37°C. After 5 days, aluminum seals were replaced with optically clear plate seals, and growth measurements (OD600) were made (Synergy HT, BioTek).
Data analysis
Using the randomization map from the digital dispense software, plate measurement data were reconstituted and analyzed (MATLAB, Mathworks), as described in Results and methods S1 and S2.
Supplementary Material
Acknowledgments
We thank K. Lewis for providing bedaquiline and A. Thurber, E. Geisinger, A. Palmer, and A. Camilli for critical reading of the manuscript. Funding: This work was supported by Turkish Academy of Sciences GEBIP Programme and Tubitak (The Scientific and Technological Research Council of Turkey) grant 115S934 to M.C. and an Alfred P. Sloan Foundation Research Fellowship, an NIH Director’s New Innovator Award (1DP2LM011952-01) and an NIH grant (P50 GM107618-01A1) to B.B.A. Author contributions: M.C. and B.B.A. designed the study. M.C. and E.B. conducted the experiments. M.C. and N.K. analyzed the data. M.C., J.L.-F., and B.B.A. wrote the paper. Competing interests: The authors declare that they have no competing interests. Data and materials availability: All data needed to evaluate the conclusions in the paper are present in the paper and/or the Supplementary Materials. Additional data related to this paper may be requested from the authors.
SUPPLEMENTARY MATERIALS
Supplementary material for this article is available at http://advances.sciencemag.org/cgi/content/full/3/10/e1701881/DC1
fig. S1. Data analysis pipeline to calculate FIC2 scores from dose-response growth data.
fig. S2. Scatterplot of replicate interaction scores (FIC2) for all pairwise drug combinations shown in Fig. 1 (C and D).
fig. S3. Correlation among FIC2 scores calculated at different levels of growth inhibition (IC30, IC40, IC50, IC60, and IC70) from the pairwise interaction data set described in Fig. 1 (C and D).
fig. S4. Scatterplot of replicate interaction scores (FICn) obtained for all two-way (FIC2), three-way (FIC3), four-way (FIC4), and five-way (FIC5) drug combinations in two replicates for the experiment shown in Fig. 2B.
fig. S5. Dose responses of isoniazid in combination with itself in one-way, two-way, three-way, four-way, and five-way combinations.
fig. S6. 3D isobole of the checkerboard assay for the isoniazid + clofazimine + bedaquiline interaction.
fig. S7. DiaMOND factorization model schematic.
fig. S8. Scatterplot of the calculated lower-order (λFICn−1) interaction scores and the geometric mean of FICn−1 scores () from the high-order measurements described in Figs. 2 and 3.
method S1. Derivation and formulas to calculate expectation doses.
method S2. DiaMOND equation for four-drug combination derived from Eq. 5, approximation, and recursion.
REFERENCES AND NOTES
- 1.Cokol M., Drugs and their interactions. Curr. Drug Discov. Technol. 10, 106–113 (2013). [DOI] [PubMed] [Google Scholar]
- 2.Zimmermann G. R., Lehár J., Keith C. T., Multi-target therapeutics: When the whole is greater than the sum of the parts. Drug Discov. Today 12, 34–42 (2007). [DOI] [PubMed] [Google Scholar]
- 3.Horsburgh C. R. Jr, Barry C. E. III, Lange C., Treatment of tuberculosis. N. Engl. J. Med. 373, 2149–2160 (2015). [DOI] [PubMed] [Google Scholar]
- 4.Espinal M. A., Kim S. J., Suarez P. G., Kam K. M., Khomenko A. G., Migliori G. B., Baéz J., Kochi A., Dye C., Raviglione M. C., Standard short-course chemotherapy for drug-resistant tuberculosis: Treatment outcomes in 6 countries. JAMA 283, 2537–2545 (2000). [DOI] [PubMed] [Google Scholar]
- 5.Zimmer A., Katzir I., Dekel E., Mayo A. E., Alon U., Prediction of multidimensional drug dose responses based on measurements of drug pairs. Proc. Natl. Acad. Sci. U.S.A. 113, 10442–10447 (2016). [DOI] [PMC free article] [PubMed] [Google Scholar]
- 6.Wood K., Nishida S., Sontag E. D., Cluzel P., Mechanism-independent method for predicting response to multidrug combinations in bacteria. Proc. Natl. Acad. Sci. U.S.A. 109, 12254–12259 (2012). [DOI] [PMC free article] [PubMed] [Google Scholar]
- 7.Pasipanodya J., Gumbo T., An oracle: Antituberculosis pharmacokinetics-pharmacodynamics, clinical correlation, and clinical trial simulations to predict the future. Antimicrob. Agents Chemother. 55, 24–34 (2011). [DOI] [PMC free article] [PubMed] [Google Scholar]
- 8.Gumbo T., Angulo-Barturen I., Ferrer-Bazaga S., Pharmacokinetic-pharmacodynamic and dose-response relationships of antituberculosis drugs: Recommendations and standards for industry and academia. J. Infect. Dis. 211 (suppl. 3), S96–S106 (2015). [DOI] [PubMed] [Google Scholar]
- 9.Gumbo T., Pasipanodya J. G., Wash P., Burger A., McIlleron H., Redefining multidrug-resistant tuberculosis based on clinical response to combination therapy. Antimicrob. Agents Chemother. 58, 6111–6115 (2014). [DOI] [PMC free article] [PubMed] [Google Scholar]
- 10.Gumbo T., Lenaerts A. J., Hanna D., Romero K., Nuermberger E., Nonclinical models for antituberculosis drug development: A landscape analysis. J. Infect. Dis. 211 (suppl. 3), S83–S95 (2015). [DOI] [PubMed] [Google Scholar]
- 11.Nuermberger E., Hanna D., Assessing the landscape of tools and approaches for novel tuberculosis regimen development. J. Infect. Dis. 211 (suppl. 3), S81–S82 (2015). [DOI] [PubMed] [Google Scholar]
- 12.Stein C., Makarewicz O., Bohnert J. A., Pfeifer Y., Kesselmeier M., Hagel S., Pletz M. W., Three dimensional checkerboard synergy analysis of colistin, meropenem, tigecycline against multidrug-resistant clinical Klebsiella pneumonia isolates. PLOS ONE 10, e0126479 (2015). [DOI] [PMC free article] [PubMed] [Google Scholar]
- 13.Wood K. B., Pairwise interactions and the battle against combinatorics in multidrug therapies. Proc. Natl. Acad. Sci. U.S.A. 113, 10231–10233 (2016). [DOI] [PMC free article] [PubMed] [Google Scholar]
- 14.Berenbaum M. C., What is synergy? Pharmacol. Rev. 41, 93–141 (1989). [PubMed] [Google Scholar]
- 15.Greco W. R., Bravo G., Parsons J. C., The search for synergy: A critical review from a response surface perspective. Pharmacol. Rev. 47, 331–385 (1995). [PubMed] [Google Scholar]
- 16.Deshpande D., Srivastava S., Nuermberger E., Pasipanodya J. G., Swaminathan S., Gumbo T., A faropenem, linezolid, and moxifloxacin regimen for both drug-susceptible and multidrug-resistant tuberculosis in children: FLAME path on the milky way. Clin. Infect. Dis. 63, S95–S101 (2016). [DOI] [PMC free article] [PubMed] [Google Scholar]
- 17.Chou T.-C., Theoretical basis, experimental design, and computerized simulation of synergism and antagonism in drug combination studies. Pharmacol. Rev. 58, 621–681 (2006). [DOI] [PubMed] [Google Scholar]
- 18.Foucquier J., Guedj M., Analysis of drug combinations: Current methodological landscape. Pharmacol. Res. Perspect. 3, e00149 (2015). [DOI] [PMC free article] [PubMed] [Google Scholar]
- 19.Beppler C., Tekin E., Mao Z., White C., McDiarmid C., Vargas E., Miller J. H., Savage V. M., Yeh P. J., Uncovering emergent interactions in three-way combinations of stressors. J. R. Soc. Interface 13, 20160800 (2016). [DOI] [PMC free article] [PubMed] [Google Scholar]
- 20.Yeh P., Tschumi A. I., Kishony R., Functional classification of drugs by properties of their pairwise interactions. Nat. Genet. 38, 489–494 (2006). [DOI] [PubMed] [Google Scholar]
- 21.Cokol M., Chua H. N., Tasan M., Mutlu B., Weinstein Z. B., Suzuki Y., Nergiz M. E., Costanzo M., Baryshnikova A., Giaever G., Nislow C., Myers C. L., Andrews B. J., Boone C., Roth F. P., Systematic exploration of synergistic drug pairs. Mol. Syst. Biol. 7, 544 (2011). [DOI] [PMC free article] [PubMed] [Google Scholar]
- 22.Chandrasekaran S., Cokol-Cakmak M., Sahin N., Yilancioglu K., Kazan H., Collins J. J., Cokol M., Chemogenomics and orthology-based design of antibiotic combination therapies. Mol. Syst. Biol. 12, 872 (2016). [DOI] [PMC free article] [PubMed] [Google Scholar]
- 23.Mason D. J., Stott I., Ashenden S., Weinstein Z. B., Karakoc I., Meral S., Kuru N., Bender A., Cokol M., Prediction of antibiotic interactions using descriptors derived from molecular structure. J. Med. Chem. 60, 3902–3912 (2017). [DOI] [PubMed] [Google Scholar]
- 24.Berenbaum M. C., A method for testing for synergy with any number of agents. J. Infect. Dis. 137, 122–130 (1978). [DOI] [PubMed] [Google Scholar]
- 25.Reddy M. V., Srinivasan S., Gangadharam P. R. J., In vitro and in vivo synergistic effect of isoniazid with streptomycin and clofazimine against Mycobacterium avium complex (MAC). Tuber. Lung Dis. 75, 208–212 (1994). [DOI] [PubMed] [Google Scholar]
- 26.Lamprecht D. A., Finin P. M., Rahman M. A., Cumming B. M., Russell S. L., Jonnala S. R., Adamson J. H., Steyn A. J. C., Turning the respiratory flexibility of Mycobacterium tuberculosis against itself. Nat. Commun. 7, 12393 (2016). [DOI] [PMC free article] [PubMed] [Google Scholar]
- 27.Drusano G. L., Sgambati N., Eichas A., Brown D. L., Kulawy R., Louie A., The combination of rifampin plus moxifloxacin is synergistic for suppression of resistance but antagonistic for cell kill of Mycobacterium tuberculosis as determined in a hollow-fiber infection model. mBio 1, e00139-10 (2010). [DOI] [PMC free article] [PubMed] [Google Scholar]
- 28.Chigutsa E., Pasipanodya J. G., Visser M. E., van Helden P. D., Smith P. J., Sirgel F. A., Gumbo T., McIlleron H., Impact of nonlinear interactions of pharmacokinetics and MICs on sputum bacillary kill rates as a marker of sterilizing effect in tuberculosis. Antimicrob. Agents Chemother. 59, 38–45 (2015). [DOI] [PMC free article] [PubMed] [Google Scholar]
- 29.Rockwood N., Pasipanodya J. G., Denti P., Sirgel F., Lesosky M., Gumbo T., Meintjes G., McIlleron H., Wilkinson R. J., Concentration-dependent antagonism and culture conversion in pulmonary tuberculosis. Clin. Infect. Dis. 64, 1350–1359 (2017). [DOI] [PMC free article] [PubMed] [Google Scholar]
- 30.Almeida D., Nuermberger E., Tasneen R., Rosenthal I., Tyagi S., Williams K., Peloquin C., Grosset J., Paradoxical effect of isoniazid on the activity of rifampin-pyrazinamide combination in a mouse model of tuberculosis. Antimicrob. Agents Chemother. 53, 4178–4184 (2009). [DOI] [PMC free article] [PubMed] [Google Scholar]
- 31.Baym M., Stone L. K., Kishony R., Multidrug evolutionary strategies to reverse antibiotic resistance. Science 351, aad3292 (2016). [DOI] [PMC free article] [PubMed] [Google Scholar]
- 32.Nijland H. M. J., Ruslami R., Suroto A. J., Burger D. M., Alisjahbana B., van Crevel R., Aarnoutse R. E., Rifampicin reduces plasma concentrations of moxifloxacin in patients with tuberculosis. Clin. Infect. Dis. 45, 1001–1007 (2007). [DOI] [PubMed] [Google Scholar]
- 33.Dawson R., Diacon A. H., Everitt D., van Niekerk C., Donald P. R., Burger D. A., Schall R., Spigelman M., Conradie A., Eisenach K., Venter A., Ive P., Page-Shipp L., Variava E., Reither K., Ntinginya N. E., Pym A., von Groote-Bidlingmaier F., Mendel C. M., Efficiency and safety of the combination of moxifloxacin, pretomanid (PA-824), and pyrazinamide during the first 8 weeks of antituberculosis treatment: A phase 2b, open-label, partly randomised trial in patients with drug-susceptible or drug-resistant pulmonary tuberculosis. Lancet 385, 1738–1747 (2015). [DOI] [PubMed] [Google Scholar]
- 34.Dawson R., Diacon A., PA-824, moxifloxacin and pyrazinamide combination therapy for tuberculosis. Expert Opin. Investig. Drugs 22, 927–932 (2013). [DOI] [PubMed] [Google Scholar]
Associated Data
This section collects any data citations, data availability statements, or supplementary materials included in this article.
Supplementary Materials
Supplementary material for this article is available at http://advances.sciencemag.org/cgi/content/full/3/10/e1701881/DC1
fig. S1. Data analysis pipeline to calculate FIC2 scores from dose-response growth data.
fig. S2. Scatterplot of replicate interaction scores (FIC2) for all pairwise drug combinations shown in Fig. 1 (C and D).
fig. S3. Correlation among FIC2 scores calculated at different levels of growth inhibition (IC30, IC40, IC50, IC60, and IC70) from the pairwise interaction data set described in Fig. 1 (C and D).
fig. S4. Scatterplot of replicate interaction scores (FICn) obtained for all two-way (FIC2), three-way (FIC3), four-way (FIC4), and five-way (FIC5) drug combinations in two replicates for the experiment shown in Fig. 2B.
fig. S5. Dose responses of isoniazid in combination with itself in one-way, two-way, three-way, four-way, and five-way combinations.
fig. S6. 3D isobole of the checkerboard assay for the isoniazid + clofazimine + bedaquiline interaction.
fig. S7. DiaMOND factorization model schematic.
fig. S8. Scatterplot of the calculated lower-order (λFICn−1) interaction scores and the geometric mean of FICn−1 scores () from the high-order measurements described in Figs. 2 and 3.
method S1. Derivation and formulas to calculate expectation doses.
method S2. DiaMOND equation for four-drug combination derived from Eq. 5, approximation, and recursion.