Abstract
Background
Blood-related hereditary diseases are widespread in Eastern and SouthWestern regions of Saudi Arabia until recently. In this study, we used Na+, K+ATPase as an enzymatic indicator for the diagnosis of the diseases.
Materials and methods
Individuals with different blood diseases (iron deficiency (n=13), anemia (n=14), thalassemia (n=16) and sickle cell anemia (n=12) were studied for Na+, K+-ATPase activity in the plasma membrane of red blood cell and compared with those of the healthy ones (n=20) of the same age and gender living in Jeddah, Saudi Arabia.
Results
There was a significant elevation in the specific activity of Na+, K+ATPase in individuals with anemia compared with those of control (0.0094 + 0.001 nmol / mg protein/min versus 0.0061 ± 0.001). On the other hand, there was a significant reduction in enzyme activity in thalassemia (0.0028 ± 0.002 nmol / mg protein/min) and sickle cell anemia cases (0.0042 ±0.001 nmol / mg protein/min) compared to the control group. The cut off value for Na+, K+ATPase activity is 0.005 µmol Pi/min-showing 94% sensitivity and 93% specificity for the differentiation of blood abnormality.
Conclusion
It can be recommended that the activity of Na+, K+-ATPase can be used for the diagnosis of individuals with blood diseases/disorders.
Keywords: Na+, K+-ATPase, red blood cell, plasma membrane, iron deficiency anemia, thalassemia, sickle cell anemia, indicator
Introduction
Iron deficiency may result from bleeding, inadequate intake through diet or malabsorption of iron. This can result in low hemoglobin (Hb) counts and anemia1,2. Thalassemia is a genetic disorder of hemoglobin production, in which there is a partial or complete failure to synthesize specific type of globins(α&β). This genetic disorder is found in people living along the shores of the Mediterranean and in the Middle Eastern and Asian Countries3,4. An important structural abnormality of the Hb chain is sickle cell hemoglobin (Hb S). It is caused from a single base mutation of adenine to thiamine, which leads to an amino acid change from glutamic acid to valine in the sixth position of the βglobin chain5,6.
Studies have revealed that Na+-K+ ATPase activity was altered in disrupted red blood cell membranes7,8, and this enzyme is believed to be the site of active transport of Na+ and K+ in intact red cells9. The enzyme is often called the (Na+- K+) pump because it pumps Na+ out and K+ into the cell against gradients with the concomitant hydrolysis of intracellular ATP10.
There are two ways by which the enzyme can transport Na+ and K+ through the membrane. The enzyme has a pocket or door that is open to the extracellular fluid. Alternatively, the pocket or door is open to the cytoplasm. By switching between the two states the enzyme transports Na+ and K+ through the membrane11.
Oxidative damage induced by free globin chains has been implicated in the pathogenesis of the membrane abnormalities observed in alpha and beta thalassemia. The Na+, K+ pump was reduced in thalassemia-like cells, whereas it was increased in severe alpha and beta thalassemia cells. Thus, oxidative damage causes the increased activity of K+, Cl- co-transport observed in thalassemia, and of the K+ loss observed in beta-thalassemia erythrocytes12. It has been suggested that the sickle cell mutations lead to the formation of unstable HbS and release of iron, which can result in lipid peroxidation and eventual cell damage and changes in membrane-bound ATPase activity13.
The aim of this study was to investigate the possibility of using Na+, K+-ATPase specific activity as a complementary tool for the diagnosis different blood diseases such as iron deficiency, thalassemia and sickle cell anemia.
Subjects and methods
Materials
Sucrose, magnesium chloride hexahydrat, ascorbic acid, sodium chloride, potassium chloride, ammonium molybdate, ethylenediaminetatra-acetic acid (EDTA), sodium hydroxide, sodium dodecyl sulphate (SDS), sulfuric acid (H2SO4), hydrochloric acid and tris (tris hydroxymethyl aminoethane) were purchased from BDH limited (Poole, England). Adenosine-5′-triphosphate disodum salt and Ouabain were obtained from Sigma Chemical Company (St. Louis, MO, USA).
Subjects
Human subjects included in this study were selected from four different hospitals in Jeddah area of Saudi Arabia (King Abdulaziz University Hospital, King Fahad Hospital, Al Thaqer Hospital and Maternity Hospital).
A total of 106 subjects were included in this study and were divided into two groups. The first group consisted of 63 normal healthy individuals and was used in this study as a control. This control group consisted of 34 males and 27 females of ages between 23 and 50 years. The second group (n= 43) consisted of patients with red blood cell disorders, such as iron deficiency anemia (n=13), thalassemia (n=14) and sickle cell anemia (n=16). Inclusion criteria included blood disease with no systemic disorder and exclusion criteria included diabetes, hypertension, cardiac disorder, and pregnancy. Detailed history, mental, physical status and clinical examination showed that the control group had healthy individuals and had not been subjected to any therapeutic drugs during the past 4 months of sampling. Patients with blood disorders were confirmed by clinical and biochemical examinations. The subjects were informed of their consent prior to drawing blood samples.
Collection of blood samples
Venous blood sample (2 ml) was collected in a heparinized tube from each subject and kept in an icebox. Plasma was separated by centrifugation at 3500 rpm at 4°C for 10 minutes. Precipitated red blood cells (RBC) were washed by isotonic solution (0.9 % w/v NaCl) three times. Another wash with deionized water was performed, and then stored at −20°C overnight. After thawing, the supernatant was separated by centrifugation at 8000 rpm for 30 min, plasma was used for the Na+- K+ ATPase assay.
Determination of the Na+, K+ -ATPase activity
The ATPase activity was quantified by measuring the release of Pi from ATP as described earlier14. A spectrophotometric method was adopted (the quantity of Pi in the assay was then determined spectrophotometrically against a standard curve derived from a solution of known phosphate concentration). Approximately, 0.1 ml of RBC homogenate was added to ATPase buffer (50 mM Tris-HCl, 3mM MgCl2. 6H2O, 10 mM KCl, 0.1mM EDTA, 100mM NaCl at pH 7.4 and +/− Ouabain) and incubated for 5 min at 37°C in a water bath and then 2 mM ATP was added and incubated further for 10 min. Ammonium molybdate solution was added to stop the reaction15. By adding 20 µl of ascorbic acid, the absorbance of color complex was measured at 750 nm16. The calorimetric method was similar to the method of Biuret17.
Statistical analysis
The data was analyzed using SPSS statistical package. T-test was used for the comparison of means. P values were considered to be statistically significant at < 0.005. Sensitivity and specificity of the enzyme activity were calculated and for that a p value of ≤0.05 was considered significant. Analysis of variance (ANOVA) was used to test for the significant difference between the groups when comparing samples. A receiver operating curve (ROC) curve analysis was used to calculate the accuracy of each marker. Between and within subject comparisons were made using t-tests.
Results
Iron deficiency (Anemia)
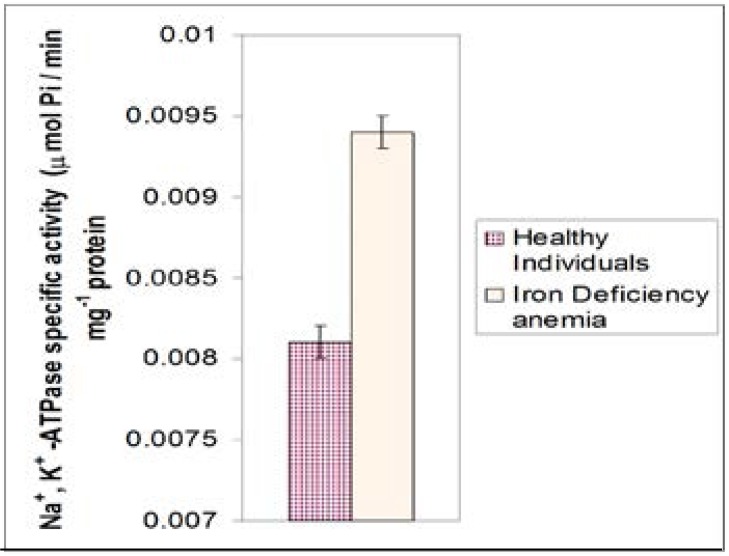
Figure 1 shows the mean activity of Na+, K+-ATPase in iron deficiency anemic patients compared with those of healthy individuals. Healthy individuals showed a significantly lower values (0.0081 ± 0.001 umol Pi/min. mg protein) compared to iron deficiency patients (0.0094 + 0.001 umol Pi/min. mg protein) and the difference was highly significant (P<0.001).
Figure 1.
Mean values of specific activity of Na+, K+ -ATPase in healthy males and females of ages 23–50 years in comparison with those of iron deficiency anemia patients.
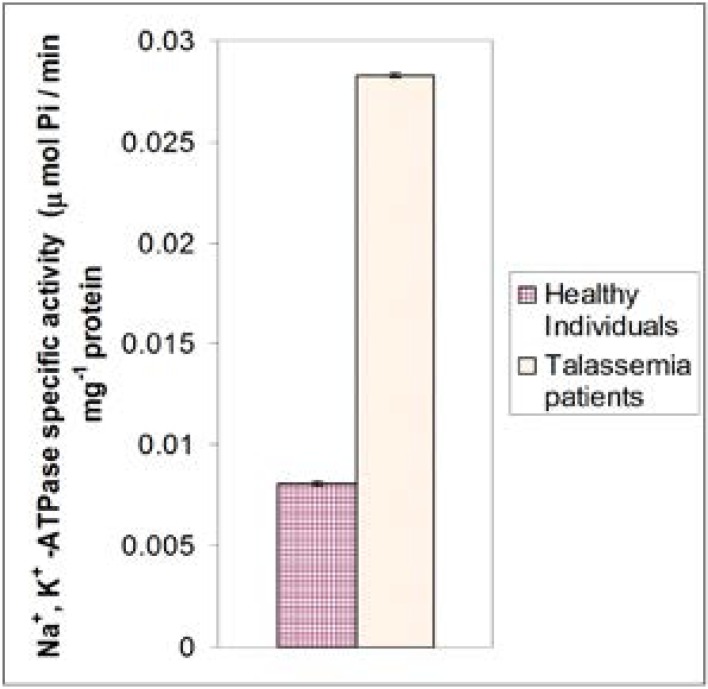
Figure 2 shows the mean activity of Na+, K+-ATPase of thalassemia patients compared with those of healthy individuals. The enzyme activity of thalassemia patients (0.0283 ± 0.002 umol Pi/min. mg protein) was higher compared to healthy individuals and the difference is highly significant (P<0.001).
Figure 2.
Mean values of specific activity of Na+, K+ -ATPase in healthy males and females of ages 23–50 years in comparison with those of thalassemia patients.
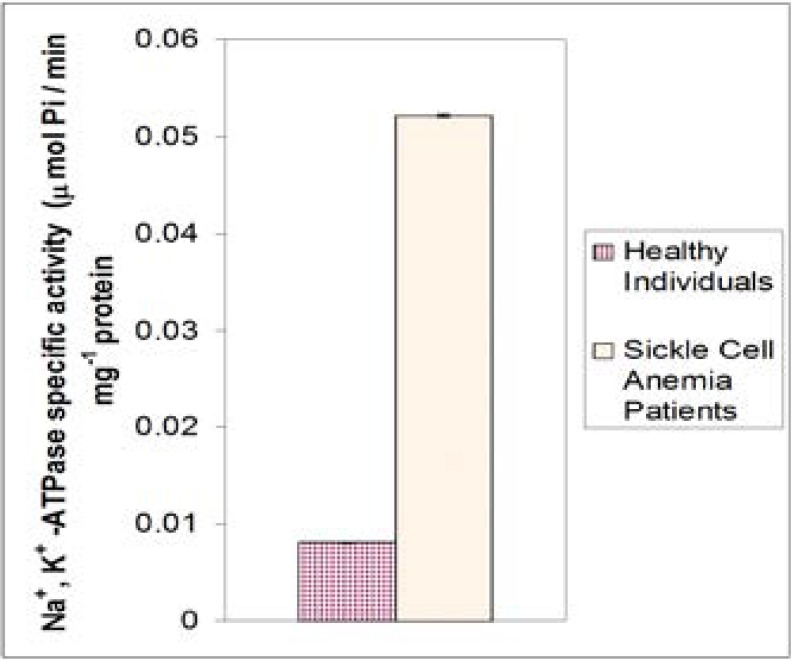
Figure 3 shows the mean activity of Na+, K+-ATPase of sickle cell anemia patients compared with those of healthy individuals. Sickle cell anemia patients had higher enzymatic activity (0.052 ± 0.001 umol Pi/min. mg protein) than healthy individuals (0.0081 ± 0.001 umol Pi/min. mg protein) and the difference was highly significant (P= 0.000)
Figure 3.
Mean values of specific activity of Na+, K+ -ATPase in healthy males and females of ages 23–50 years in comparison with those of sickle cell anemia patients.
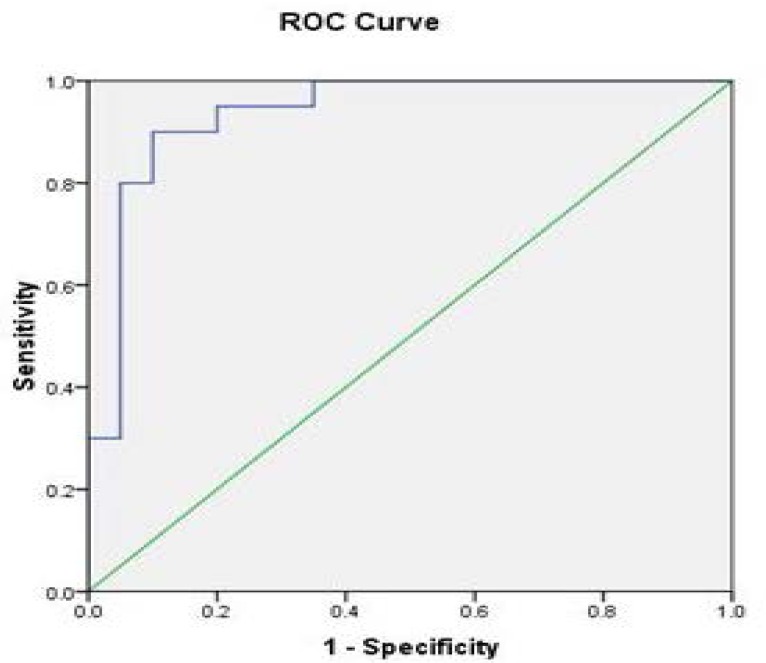
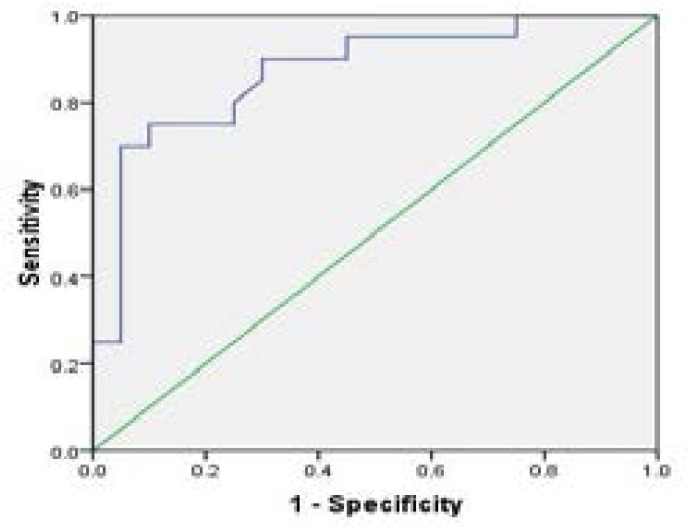
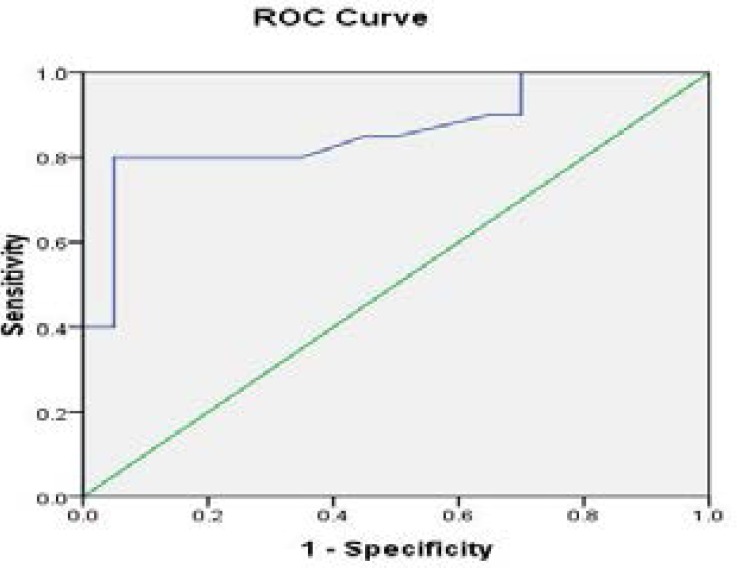
The receiver operating curve (ROC) analysis for Na+/ K+-ATPase activity in various groups of individuals are shown in Fig 4–6 and Tables (1–3). Na+/K+-ATPase supported the diagnostic profile, showing an area under curve (AUC) of 0.91 with a cut-off value of 12% (sensitivity, 94%; specificity, 93%). Na+/K+-ATPase activity increased in thalassemia and sickle cell anemia patients compared to the control group, while the enzyme activity decreased in iron deficiency anemia patients in comparison to control. The cut-off value as 89% for iron deficiency, 75% for thalassemia and 82% for sickle cell anemia.
Fig 4.
The receiver operating curve (ROC) of enzyme activity between iron deficiency anemia patients versus control group
Fig 6.
The receiver operating curve (ROC) of enzyme activity between for sickle cell anemia patients versus control group
Table 1.
Test result variable (s): Na+,K+ -ATPase
Under the nonparametric assumption
Null hypothesis: true area = 0.5
Table 3.
Test results variable (s): Na+, K+ ATPase
| Area | Std. Errora | Asymptotic Sig.b |
Asymptotic 95% Confidence Interval | |
| Lower Bound | Upper Bound | |||
| .871 | .058 | .000 | .758 | .984 |
The test result variable(s): Cortisol has at least one tie between the positive actual state group andthe negative actual state group. Statistics may be biased.
Under the nonparametric assumption
Null hypothesis: true area = 0.5
Fig 5.
The receiver operating curve (ROC) of enzyme activity between thalassemia patients versus control group
Table 2.
Test Result Variable(s): Na+, K+ -ATPase.
| Area | Std. Errora | Asymptotic Sig.b | Asymptotic 95% ConfidenceInterval |
|
| Lower Bound | Upper Bound | |||
| .861 | .061 | .000 | .741 | .982 |
The test result variable(s): Cortisol has at least one tie between the positive actual state group and the negative actual state group. Statistics may be biased.
Under the nonparametric assumption
Null hypothesis: true area = 0.5
Discussion
Na+/K+-ATPase is a membrane-bound enzyme which is involved in the regulation of membrane potential, cell permeability for Na+, K+ and Ca2+ and neurotransmitters. It is also important in cell cycle and differentiation. The balance of Na+ and K+ between the intracellular and extracellular regions is the main requirement for cellular homeostasis and for different functions3. Therefore, the utilization of Na+/K+-ATPase activity as a biomarker for blood diseases is appropriate.
Previous studies have stated that, there is an elevation of Na+, K+-ATPase activity in the primary anemia patients. This elevation may compensate the mechanism for adaptation of the patients with low oxygen and its physiological role in the cell14.
The specimens of blood diseases collected in this study originated from three types: Iron deficiency anemia (IDA), thalassemia (Thala) and sickle cell anemia (SCA). Overall the mean specific activity of Na+, K+ -ATPase in Thala and SCA patients is higher compared with the healthy individuals (p<0.01 and p<0.05 respectively). These results are in accordance with those reported in a previous study that found a significant changes in the specific activity of ATPase in sickle cell anemia patients compared to control group18. The cation permeability of red cells containing hemoglobin S is changed markedly when the cells undergo sickling at low oxygen tension19. There was an increased turnover of cations with a rise in the cation leakage due to the distortion of the membrane surface. The loss of K+ exceeds the gain of Na+ in sickled cells so that water is lost from the cells. The net loss of K+ is inversely proportional to the oxygen tension and can serve as a criterion for the extent of the sickling20.
Several investigators have noted a rise in lactate production during the sickling process. This could be due to a response by the Embden Meyerhof glycolytic pathway to increase ATP production as active transport attempts to cope with the increased leakage. However, a low oxygen tension induces a rise in the intracellular pH, which is also a stimulus to glycolysis. In irreversibly sickled cells (ISC), even when oxygenated, the cell water and K+ are low while Na+ is moderately increased21.
It is likely that the increases in ATPase activity suggested the presence of younger red blood cell population in sickling patients. The higher ATPase activities in sickling cells are related to the increased proportion of young red blood cells in sickling patients22.
The cut off value for Na+, K+-ATPase activity is 0.005µmol Pi/min showing 94% sensitivity and 93% specificity for differentiation of abnormality.
Conclusion
The variation in the erythrocyte membrane Na+, K+-ATPase activity was modulated by the changes in the differences resulting from hematological disorders. Based on our results, we can suggest that the activity of Na+, K+-ATPase can be used as an indicator for diagnosis of individuals with blood diseases.
Acknowledgment
This project was funded by the Deanship of Scientific Research (DSR) at King Abdulaziz University, Jeddah, under grand No.(HiCi-84-130-1435). The authors, therefore, acknowledge with thanks DSR for technical and financial support.
References
- 1.Agil A, Sadrazadeh S M. Hydroxy-urea protects erythrocytes against oxidative damage. Redox Rep. 2000;5(1):29–34. doi: 10.1179/rer.2000.5.1.29. [DOI] [PubMed] [Google Scholar]
- 2.Bolsover S R, Hyams J S, Jones S, Shephard E A, White H A. From Genes to Cells. New York: John Wiley & Sons, Inc.; 1997. [Google Scholar]
- 3.Goldstein I, et al. Association between sodium- and potassium-activated adenosine triphosphatase alpha isoforms and bipolar disorders. Biol Psychiatry. 2009;65:985–991. doi: 10.1016/j.biopsych.2008.10.033. [DOI] [PubMed] [Google Scholar]
- 4.Dobretsov M, Stimers JR. Neuronal function and alpha3 isoform of the Na/KATPase. Front Biosci. 2005;10:2373–2396. doi: 10.2741/1704. [DOI] [PubMed] [Google Scholar]
- 5.Goldstein I, et al. Involvement of Na(+), K(+)-ATPase and endogenous digitalislike compounds in depressive disorders. Biol Psychiatry. 2006;60:491–499. doi: 10.1016/j.biopsych.2005.12.021. [DOI] [PubMed] [Google Scholar]
- 6.Keller S, Frishman WH. Neuropsychiatric effects of cardiovascular drug therapy. Cardiol Rev. 2003;11:73–93. doi: 10.1097/01.CRD.0000053453.89776.2D. [DOI] [PubMed] [Google Scholar]
- 7.Gornall AG, Bardawill G J, David M M. Determination of seru protein by means of the biuret reaction. J Biol Chem. 1949;177:751. [PubMed] [Google Scholar]
- 8.Haslett C, Chilvers E R, Hunter J A A, Boon N A. Davidson's Principles and Practice of Medicine. 18th edn. New York: Churchill Livingstone Inc.; 1999. [Google Scholar]
- 9.Hoffbrand A V, Pettit J E. Essential Hematology. 3th edn. Oxford: Blackwell Scientific Publications; 1993. [Google Scholar]
- 10.Kimelberg H K, Papahadjopoulos D. Phospholipid requirement of Na+, K+ -ATPase activity: head group specificity and fatty acid fluidity. Biochemica Biophysica Acta. 1972;272:282. doi: 10.1016/0005-2736(72)90334-3. [DOI] [PubMed] [Google Scholar]
- 11.Kumar P, Clark M. Clinical Medicine. 3rd edn. London: W.B. Saunders Company Ltd; 1994. [Google Scholar]
- 12.Madan G, Luthram, David A. Increased Ca++, Mg++, Na+, K+ ATPase activities in erythrocytes of sickle cell anemia. Blood. 1982;60:1332–1336. [PubMed] [Google Scholar]
- 13.Marija J N. SPSS/PC+ for the IBM PC/XT/AT. Chicago USA: SPSS INC.; 1985. [Google Scholar]
- 14.Mentzer W C, August C S, Nathan DG. The effects of androgen administration in sickle cell anemia. Pediatr Res. 1969;3:378. [Google Scholar]
- 15.Miller D M. In: Monosaccharide transport in human erythrocytes; in Red Cell Membrane Structure and Function. Jameson G A, Greenwalt T J, editors. Philadelphia: J. B. Lippincott; 1978. [Google Scholar]
- 16.Olivieri O, De-Franceschi L, Capellini M D, Girelli D, Corrocher R, Brugnara C. Oxidative damage and erythrocyte membrane transport abnormalities in thalassemias. Blood. 1994;84(1):315–320. [PubMed] [Google Scholar]
- 17.Post R L, Merritt C R, Kinsolving C R, Albright C D. Membrane adenosine triphosphatase as a participant in the active transport of sodium and potassium in the human erythrocyte. J Biol Chem. 1960;235:1796. [PubMed] [Google Scholar]
- 18.Sergeant G R. Sickle Cell Anemia. 2nd edn. Oxford: Oxford University Press; 1992. Possidente B, McEldowney S, Pabon A (1995) Aging lengthens circadian period for wheel-running activity in C57BL mice. Physiol Behav 57:575–579. [Google Scholar]
- 19.Steiner J. A questionnaire study of risk-taking in psychiatric patients. Br J Med Psychol. 1972;45:365–374. doi: 10.1111/j.2044-8341.1972.tb02219.x. [DOI] [PubMed] [Google Scholar]
- 20.Skou J C. Further investigation on a Mg++, Na+ activated adenosine triphosphatase, possibly related to the active, linked transport of Na+ and K+ across the nerve membrane. Biochim Biophys Acta. 1960;42:6. [Google Scholar]
- 21.Tosteson D C, Carlsen E, Dunham E T. The effects of sickling onion transport. I. Effect of sickling on potassium transport. J Gen Physiol. 1955;39:3. doi: 10.1085/jgp.39.1.31. [DOI] [PMC free article] [PubMed] [Google Scholar]
- 22.Looney SW, el-Mallakh RS. Meta-analysis of erythrocyte Na,K-ATPase activity in bipolar illness. Depress Anxiety. 1997;5:53–65. doi: 10.1002/(sici)1520-6394(1997)5:2<53::aid-da1>3.0.co;2-6. [DOI] [PubMed] [Google Scholar]


