Abstract
A mathematical model is presented for the growth of yeast that incorporates both dimorphic behaviour and nutrient diffusion. The budding patterns observed in the standard and pseudohyphal growth modes are represented by a bias in the direction of cell proliferation. A set of spatial indices is developed to quantify the morphology and compare the relative importance of the directional bias to nutrient concentration and diffusivity on colony shape. It is found that there are three different growth modes: uniform growth, diffusion-limited growth (DLG) and an intermediate region in which the bias determines the morphology. The dimorphic transition due to nutrient limitation is investigated by relating the directional bias to the nutrient concentration, and this is shown to replicate the behaviour observed in vivo. Comparisons are made with experimental data, from which it is found that the model captures many of the observed features. Both DLG and pseudohyphal growth are found to be capable of generating observed experimental morphologies.
Keywords: dimorphic yeast, diffusion-limited growth, agent-based models
1. Introduction
Yeasts are unicellular organisms belonging to the fungal kingdom that are typically between 4 and 40 micrometres in diameter. In contrast with moulds, which grow in elongated tubes of one or more cells called hyphae, yeasts typically grow as individual unconnected cells, sometimes referred to as the yeast form. Some species of yeast, designated dimorphic, can grow either in a colony of individual cells or in a linked chain of elongated cells, referred to as a pseudohypha, which resembles the tubular true hyphae of other fungi. The ale and baker's yeast Saccharomyces cerevisiae usually grows by budding in the yeast phase, but it can be induced to switch to the pseudohayphal phase under certain stress conditions [1]. Yeast species such as Yarrowia lipolytica and Candida albicans are naturally dimorphic and the switch from yeast-like to pseudohyphal growth is intrinsic to the latter species' activity as a human pathogen [2]. In addition, it has been argued that yeast cells are a useful model eukaryotic organism [3]. This diverse range of applications makes it of great interest to study the growth and, in particular, the morphogenesis of yeast cells.
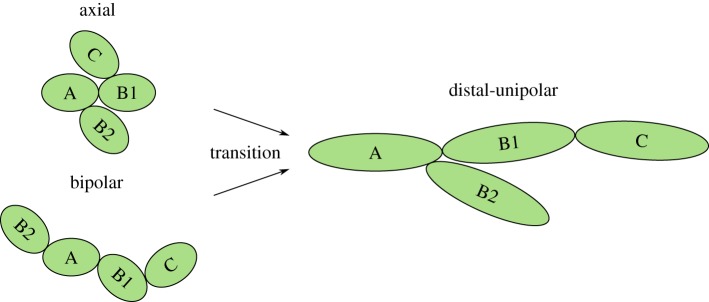
Yeast colony morphology is controlled by the manner in which individual cells reproduce and the dimensions of the new cells produced. Typically, yeast cells reproduce asexually through mitosis, in which new cells are formed from protrusions, termed buds, that form on existing cells. In favourable growth conditions, such as a nutrient-rich environment, two patterns of bud-site selection are typically observed: the axial pattern and bipolar pattern [4], both of which are illustrated in figure 1. In the axial pattern, exhibited by haploid cells, the first bud forms near the bud scar, and subsequent buds form near previous budding sites, while diploid cells undergo bipolar budding, in which buds form at the opposite pole to that occupied by the previous bud.
Figure 1.
The budding patterns exhibited by yeast cells. In each case an initial cell A produces daughters B1 and B2, while B1 produces the daughter C. In the axial pattern new cells form near the birth scar. The bipolar pattern features daughter cells either near the birth scar or directly opposite. During pseudohyphal growth the cells switch to distal-unipolar budding, in which daughter cells form opposite to the birth scar, cells are elongated and daughters remain attached to mother cells. (Online version in colour.)
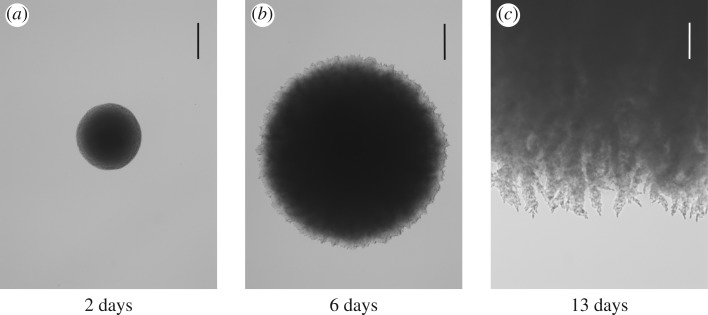
Environmental conditions can trigger a switch in the growth patterns of both cell types, which alters the colony morphology. One such example is pseudohyphal growth, such as exhibited by the colony shown in figure 2. This growth pattern is characterized by three features: (I) a change to the distal-unipolar growth pattern; (II) the elongation of cells and (III) the adhesion of daughter cells to their mother. In the distal-unipolar pattern (figure 1) cells bud at the pole directly opposite the bud scar, while the cell elongation causes the axial aspect ratio to increase from approximately 1.5 up to 3.5 [5]. The chains of connected elongated cells that form during pseudohyphal growth are known as pseudohyphae as they resemble the single long hyphae cells of filamentous fungi. Pseudohyphal growth of S. cerevisiae is typically triggered by an external stress, such as the presence of fusel alcohols [6,7], which is thought to be a type of quorum sensing [1], heat [8] or low levels of mating pheromones [9]. Of particular interest here is pseudohyphal growth in response to nutrient limitation, which is a form of scavenging [1,5]. Through this response, non-motile yeast cells are able to search for nutrients away from the colony or invade a host organism [10].
Figure 2.
The onset of pseudohyphal growth in a yeast colony seeded from a single cell of S. cerevisiae strain Σ1278b (diploid, prototrophic) after (a) 2 days, (b) 6 days and (c) 13 days of growth on 55 mm plates with yeast nitrogen base (YNB) ase agar, at a depth of 2 mm (DifcoTM YNB w/o amino acids and ammonium sulfate, cat. no. 233520, with 2% glucose, 50 μM ammonium sulfate and 2% twice washed bacto agar). Plates were incubated at 30°C. Images are a typical representation of triplicate biological replicates. The scale bars represent (a, b) 500 μm and (c) 200 μm. The colony initially grows uniformly in all directions and so has a circular boundary. By day 6, some evidence of filamentous growth has appeared, which is clearly visible by day 13.
Both experimental observations [11] and continuous coupled reaction–diffusion models [12,13] have shown that colonies of the motile bacterium Bacillus subtilis can produce growth patterns reminiscent of pseudohyphal yeast. Experimental studies [14–16] have shown that these patterns depend on both the nutrient concentration and the composition of the growth medium, and similar observations have been made for non-motile bacteria [15]. This suggests that bacterial colony morphology is influenced by diffusion-limited growth (DLG), which arises due to the interaction between cells and a second diffusing substance, such as nutrient or a byproduct of cell growth. It is known that yeast colony shape depends upon both the species of yeast and the limiting nutrient [17], while comparisons between in vivo data and a one-dimensional cellular automaton model coupled to a continuous nutrient model suggest that DLG alone does not control the colony morphology for all yeast species and nutrient types [18]. An off-lattice model has shown, however, that changes to the cell growth pattern are not able to alter the morphology without the inclusion of growth inhibition due to crowding [19].
Mathematical modelling clearly provides a promising avenue for identifying and quantifying the mechanisms that lead to filamentous growth. Discrete lattice-based models have been used extensively to understand pattern formation in cell colonies, such as the Eden model [20] and the diffusion-limited aggregation model [21], which represent growth in high and low nutrient concentrations, respectively. In the context of a growing colony, the latter is referred to as DLG. The interaction between growing cells and a diffusing species has been represented implicitly by probabilistic growth rules [22], through crowding effects [23], and using coupled cellular automata [24]. The effect of agar concentration and nutrient availability on yeast colony morphology has been investigated using coupled reaction–diffusion equations [25], while continuous models have also been used to analyse the stability of the colony front, albeit in the context of bacterial growth [13]. Using a hybrid model, comprising discrete non-motile cells on a lattice and a continuous nutrient field, it has been shown that DLG can be induced by increasing the nutrient consumption rate of the cells [26].
To understand the mechanisms that influence colony shape, we must be able to quantify the observed patterns. Bacterial colonies have been described by fractal dimension [11,14] and related scaling laws [12], while fingers growing from bacterial colonies have been quantified by the dimensionless width and amplitude [13]. Yeast invasiveness has been classified using the total colony volume and invasive colony volume [27,28], while a systematic analysis of 427 features identified six as important for classifying colony morphology, with the fractal dimension, average entropy texture within the colony and the area of the colony structure the most important features [29]. The size of the colony perimeter relative to that of its area and the coefficient of variation of the colony boundary as a function of angle have also been used to describe yeast colonies [25]. Much use has been made of normalized spatial counts [30,31] and pair correlation functions to describe spatial patterns of cell colonies [32–36]. In particular, normalized count functions and pair correlation functions have been used to define measures of cell distributions in the radial and angular directions for a growing colony of yeast cells [37].
While mathematical models have the potential to assist in the classification of yeast strains and mutants, this can only be realized if the simulated data can be compared with experimental data. Approximate Bayesian computation (ABC) allows the generation of probability distributions for parameters of interest [38,39], which provide more information than simple point estimates such as would be generated using a least-squares match. ABC algorithms require large numbers of simulations in order to generate the required distributions, which means that these techniques are only practical if the model solutions can be computed efficiently. This requires a careful balance between model accuracy and computational complexity.
Despite the substantial body of existing work, the models developed so far do not provide a sufficient understanding of the filamentous growth of yeast. In particular, no model incorporates all three key features (I, II and III from above) of pseudohyphal growth. Furthermore, there is little understanding of how pseudohyphal and DLG interact and, consequently, only a limited understanding of the conditions leading to filament-like patterns. We seek to address these questions using an efficient mathematical model for the dimorphic growth of yeast cells. Building upon the lattice-based discrete-time model developed by Matsuura [24], cells are represented by squares on a lattice, while a single species of nutrient is represented by particles that perform a random walk through the lattice. The changes in cell polarity and shape (properties I and II, respectively) that occur during pseudohyphal growth are modelled by modifying the original model of Matsuura [24] to include a bias in the direction of the cell growth, while cell–cell adhesion (property III) is enforced automatically by specifying that all cells are non-motile.
The model is used to examine the influence of nutrient diffusivity, nutrient concentration and the directional bias on the observed growth pattern. This was not possible using previous models, which did not incorporate both the diffusion of nutrient and the key features of pseudohyphal growth. The model thus offers a significant new insight into the relative impact on the morphology of each phenomenon, providing, for the first time, a theoretical understanding of the conditions under which each is important. The change in morphology that arises from pseudohyphal growth due to nutrient deprivation is investigated by increasing the bias as the surrounding nutrient concentration decreases. The morphology is measured using spatial statistics based upon those developed by Binder et al. [37], which have been shown to be suitable for use with experimental data. Using these statistics, we identify the dominant growth mechanisms in different regions of the parameter space. Importantly, the model developed here is efficient while still capturing important biological features, making it highly suitable for use with ABC algorithms and thus providing the first viable avenue for estimating physical parameters from experimental observations of pseudohyphal growth.
The remainder of this article is structured as follows. The mathematical model and statistics are described in §2 and the accuracy of the discrete nutrient model is discussed. In §3, the model is used to examine the influence of directional bias, nutrient concentration and nutrient diffusivity on the morphology, and the dominant growth mechanisms are identified. Some experimental comparisons are discussed in §4, while two extensions to the model are explored in §5. The main conclusions are summarized in §6.
2. Mathematical model
2.1. Model description
We adapt the single-layer diffusion model introduced by Matsuura [24], which is discrete in both time and space. Examining the experimental image in figure 2c, it is evident that a small section of the colony boundary, which grows in the radial direction, closely resembles rectilinear growth normal to the boundary. As inspection of this region is sufficient for determining the growth mode, we are thus able to determine the morphology by simulating only a small section of the boundary, which greatly reduces the number of computations required in the simulations. This approach avoids the difficulties of simulating a colony having a nearly circular boundary on a rectangular grid. The yeast cells are thus confined to a grid with Lx and Ly points in the x- and y-directions, respectively. The total area of the lattice is A = LxLy. Each point within the grid may be occupied by at most one yeast cell, with the number of cells at any time denoted by ν and the corresponding average cell density defined by ρ = ν/A. It is convenient to denote the initial number of cells ν0, so that the number of new cells is νg = ν − ν0. A single nutrient species is modelled by discrete packets containing mass m of nutrient that move on the same grid as the yeast cells. Each site of the lattice can hold any non-negative integral number of nutrient packets, regardless of whether that point is also occupied by a yeast cell. As an initial condition, we place a line of Lx cells across the row y = 1 of the grid, which matches the condition used by Matsuura [24] and represents a small portion of a colony boundary. We also specify the initial number of nutrient packets n0, which are placed uniformly at random across the domain to give a total initial nutrient mass of m0 = mn0. The initial average nutrient concentration is given by c0 = m0/A, which is not necessarily uniform across the domain. The domain is taken to be periodic across the boundaries x = 1 and x = Lx but not in the y-direction. For a grid point (x, y) not on a boundary, we take the neighbouring cells to be the von Neumann neighbourhood consisting of (x + 1, y), (x − 1, y), (x, y + 1) and (x, y − 1). On a periodic boundary, the y co-ordinates are taken modulo Ly. On a non-periodic boundary, any point that lies outside the domain is ignored. At this juncture, we do not set values for the length, time and mass scales.
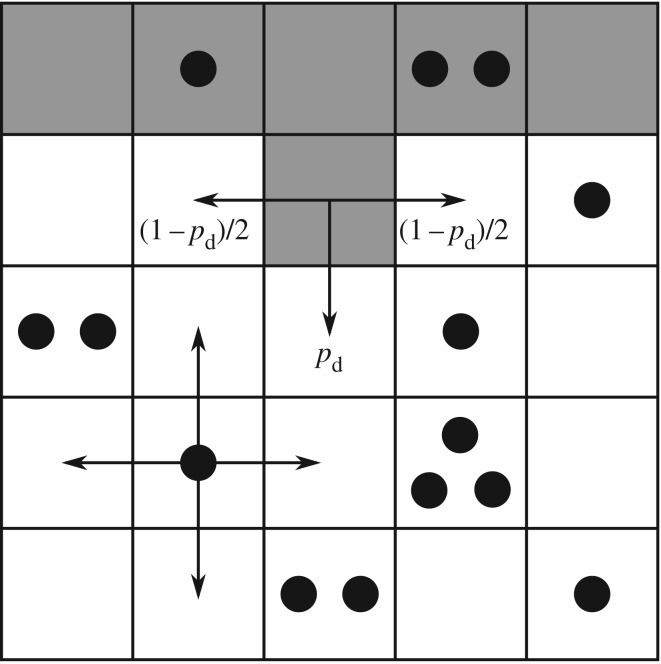
Given some state of the cells and nutrient, the state at the next time step is found by performing three operations: yeast cells may absorb nutrient; yeast cells may reproduce; and nutrient packets may move throughout the lattice. These mechanisms, illustrated in figure 3, operate as follows. Every yeast cell may absorb and store a nutrient packet with probability pa provided that there is a nutrient packet on the same lattice point and the cell contains less than the maximum nutrient capacity ms. Every yeast cell with at least mass mr of nutrient stored attempts to reproduce with probability pr by creating a new yeast cell in a neighbouring unoccupied grid location. As one neighbouring lattice site will always contain the mother cell, each cell can reproduce in three directions and hence can reproduce no more than three times. This limit reflects the crowding that occurs within a yeast colony. If the site selected for reproduction is occupied, then the reproduction event is aborted. When reproducing, the cell consumes mr nutrient. Following Matsuura [24], we set ms = 4; however, any choice for ms is possible provided ms ≥ mr. The original model is modified so as to introduce a bias in the direction of cell reproduction that depends upon cell polarity. The proximal pole of the daughter cell is set to be the side adjacent to the mother cell, with the distal pole on the opposite side. The cell axis is defined to be the line joining these two poles. A reproducing cell creates a daughter in the site adjacent to its distal pole with probability pd, and otherwise creates the daughter cell in either one of the two perpendicular sites with probability (1 − pd)/2, as illustrated in figure 3. Because no more than one cell can occupy a given site, a cell cannot create a daughter at the site adjacent to its proximal pole. The case  corresponds to unbiased growth, while
  results in a bias towards growth in the direction of the cell axis, and
  a bias towards perpendicular growth. The exclusion rule means that each cell may reproduce no more than three times. At each time step, every nutrient packet walks randomly through the domain with probability pm, and each selected packet moves s times at each iteration to one of the four adjacent sites with equal probability. We choose to vary s rather than pm so as to allow a comparison with the original study by Matsuura [24]. Increasing s corresponds to increasing the diffusivity of the nutrient. The model parameters are summarized in table 1. Other features sometimes included in models of cell growth, such as metabolic states, cell death and subsequent lysis, and the production of cell waste products, are not included for reasons of simplicity.
Figure 3.
Illustration of the modified Matsuura [24] model with directional bias. The yeast cells (grey cells) and nutrient packets (black dots) are confined to a lattice. Yeast cells absorb nutrient and reproduce into neighbouring cells. Cells reproduce away from their mother in the direction of the cell axis with probability pd, with the remaining probability spread evenly between the two directions perpendicular to the cell axis. Nutrient diffuses randomly through the lattice.
Table 1.
Typical parameter values for the modified form of the model developed by Matsuura [24]. The parameters marked with an asterisk have been chosen to match those in the original model.
| parameter | symbol | value |
|---|---|---|
| absorption probability | pa | 0.5 |
| reproduction probability | pr | 0.5 |
| nutrient movement probability | pm | 0.8 |
| directional bias | pd | 0–1 |
| initial number of nutrient packets | n0 | 102–105 |
| initial nutrient concentration | c0 | 1–7 |
| maximum nutrient storage* | ms | 4 |
| nutrient for reproduction* | mr | 3 |
| number of nutrient steps | s | 1–37 |
2.2. Quantifying the spatial pattern
To describe the influence of the model parameters on the colony morphology, we require metrics that summarize the spatial pattern of the cells. Binder et al. [37] established that the morphology of disc-like yeast colonies could be quantified using scaled counts and a pair-correlation function computed from experimental data, which were summarized by three indices that measured: (i) the variation in the azimuthal direction; (ii) the variation in the radial direction; and (iii) the local aggregation of cells. Here, we develop analogues of the first two of these indices that are applicable to a rectangular geometry and provide a sufficient description of the pattern.
A colony of cells may be represented by a matrix M such that
so that the number of occupied sites is given by
with corresponding mean density ρ = ν/(LxLy). To describe the pattern, the cells are placed into the sets
with associated bin counts  and
and  .
.
To quantify the horizontal pattern, we first compute the standard deviation of cx(j), given by
 |
where μx is the mean of cx(j). For non-exclusion processes, the standard deviation may be normalized by the value attained when all cells reside in a single bin [30]. While this has also been used as an upper bound for exclusion processes [31], if the number of cells is larger than the bin size Ly, then this upper bound can never be realized. If exclusion is considered, then a smaller upper bound on the standard deviation is
 |
where νy = ν mod Ly. This corresponds to arranging the cells so as to create as many full bins as possible and placing any leftover cells in another bin. If the number of bins divides the number of cells exactly, then it is possible to have an equal number of cells in each bin, which corresponds to σx = 0; however, such an arrangement is not always possible in an exclusion process. In general, the minimum standard deviation is given by
 |
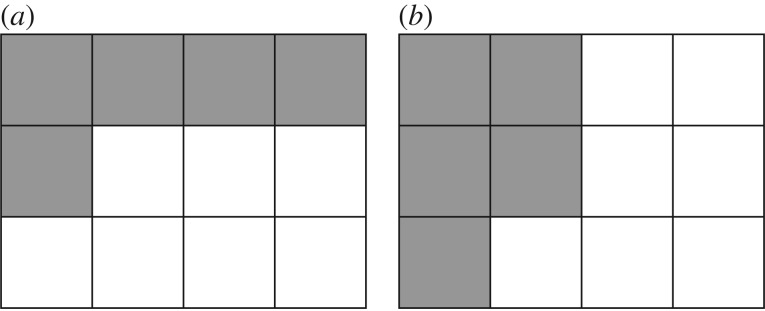
where νx = ν mod Lx, which corresponds to arranging the cells as evenly as possible across the bins. Examples of these two distributions are shown in figure 4. When Lx divides ν exactly, this expression yields σmin = 0. We then define the horizontal index
| 2.1 |
This index provides a measure of the randomness in a given pattern and is an analogue of the azimuthal index of Binder et al. [37]. The index takes the value 0 for a pattern in which the cells are spread as evenly as possible across each value of x, and is unity when the cells are clustered in as few bins as possible.
Figure 4.
Examples of a lattice with Lx = 4, Ly = 3 and ν = 5 cells showing distributions corresponding to (a) the smallest standard deviation σmin and (b) the largest standard deviation σmax. These two extremes are used to scale the standard deviations for other cell distributions. While these distributions are not unique, the values of σmin and σmax are.
As an analogue for the second index, we first define the total colony size R to be the maximum y index of the occupied cells, while the size Rp of the non-filamentous portion of the colony is defined to be the largest value of y at which cy attains its maximum. The vertical index is then given by
| 2.2 |
Larger values of Iy correspond to greater variation in the y-direction.
2.3. Accuracy of the discrete nutrient model
Compared to a continuum model, the discrete nutrient model employed here is advantageous as it facilitates the representation of the interaction between cells and nutrient packets, avoiding the need to couple the discrete cell model to a numerical solution method for a continuous diffusion model. In using this approximation, care must be taken to ensure the diffusion solution is resolved sufficiently so that the final cell distribution is independent of the number of nutrient packets. This is assessed using the spatial indices defined in §2.2.
In the original formulation of Matsuura [24], each packet in the model represents one unit of nutrient, which provides a relatively coarse approximation to the true nutrient diffusion. There is, however, no restriction on the nutrient content of each packet. If the total starting nutrient mass m0 is spread evenly across n0 nutrient packets, the mass of each packet is
which may take on rational values. The original model of Matsuura [24] corresponds to the case n0 = m0 and, for any fixed value of m0, increasing n0 provides a better approximation to the continuum limit.
To investigate the accuracy of the discrete model, we first consider a representative problem with nutrient diffusion only and compare the solutions from the discrete model to the continuous analogue. For the discrete problem, we consider a domain with dimensions Lx = Ly = 100 initially populated randomly with nutrient at lattice sites with coordinates satisfying 46 ≤ x ≤ 55, with total mass m0 = 105. The number of steps is nominally set to s = 1. The solution at each iteration is averaged over all values of y to provide a one-dimensional representation of the diffusion.
The corresponding continuum problem has domain half-width L = 49.5, while the populated region has half-width a = 5. When s = 1 it is known that the nutrient concentration at position x and time t, denoted by C(x, t), is governed by the linear diffusion equation [40]. When s > 1, each nutrient packet can undergo multiple motility events at a given time step, which simply corresponds to a change in the diffusion timescale. Taking this into account by rescaling time, the continuum model for general s is governed by
where Dn = spm/4 is the coefficient of diffusion.
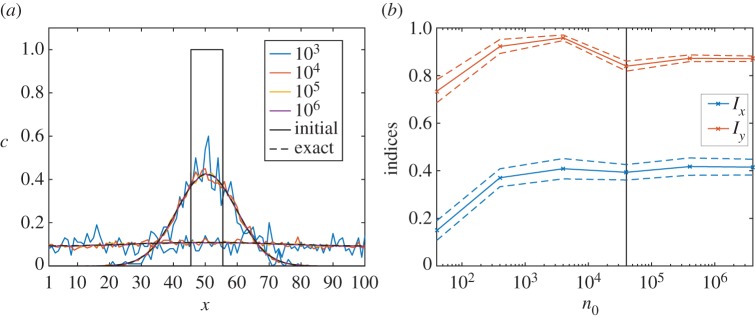
The packet concentrations from the discrete model calculated using different initial packet numbers n0 are plotted in figure 5a, along with the initial condition and series solution to the continuum model. As n0 increases, the discrete solutions approach the continuum solution and, by n0 = 106, the discrete and continuum solutions are indistinguishable at the plotted resolution.
Figure 5.
(a) Solutions to the example diffusion problem at times 20 and 400, along with the initial condition. As the number of packets n0 increases, the averaged simulation data approach the continuum solution. The data corresponding to 106 packets are indistinguishable from the continuum solution to graphical accuracy. (b) The indices Ix and Iy plotted against n0 for 50 iterations of unbiased growth with s = 2 and m0 = 4 × 10⁴ computed until ρ = 0.5. The horizontal axis is plotted on a logarithmic scale. The black vertical line marks the point at which m0 = n0. The mean indices are approximately constant for n0 ≥ m0.
While this analysis suggests that a large number of nutrient packets are required in order to find an accurate solution to the diffusion model, we are, ultimately, only interested in determining the values of the indices Ix and Iy. To investigate the dependence of these on n0, we consider the full model with both cell growth and nutrient diffusion for unbiased growth with s = 2 and m0 = 4 × 10⁴ on a lattice with Lx = Ly = 100, corresponding to the initial concentration c0 = 4. The model is run up to ρ = 0.5 using values of n0 between 40 and 4 × 10⁶. For each value of n0 we compute 50 realisations and calculate the averages of the associated indices. To facilitate a comparison between different values of n0, the cells are allowed to absorb multiple nutrient packets at each iteration up to a maximum total mass of 1. The value of each index is plotted against n0 in figure 5b, from which we observe that both indices are approximately constant for n0 ≥ m0. The mean values of both indices at n0 = m0 have relative errors of no more than 0.06 compared to the values found with the largest number of packets n0 = 4 × 10⁶. This indicates that increasing the accuracy of the discrete nutrient model beyond n0 = m0 does not result in a significant change in the spatial indices.
While results for only one set of parameters has been shown here, we note that the same outcome is found when using other values for s and c0. We thus conclude that accurate values of Ix and Iy may be obtained for relatively small values of n0. In particular, setting n0 = m0 provides a good estimate of the indices and this choice will be used for the remainder of this study.
3. Directional bias and morphology
3.1. Unbiased growth
As a reference point, we first consider colony growth in the absence of directional bias, which corresponds to setting  and represents bipolar growth. Following previous experimental [16] and mathematical studies [24,25], we investigate how both the initial nutrient level and the nutrient diffusivity affect the morphology. We take Lx = Ly = 100 and consider initial nutrient concentrations c0 between 1 and 7, and nutrient step numbers s varying from 1 to 37, which are chosen to best illustrate the observed behaviour. For convenience, we refer to each solution by the corresponding ordered pair (s, c0). In each case, the solution is computed until ρ = 0.5, or until all the nutrient is consumed, so as to provide a comparison of the morphology between each set of parameters. While there is enough nutrient for the colony to reach ρ = 0.5 for simulations with c0 > 1.47, in practice some nutrient may be stored within cells that are unable to reproduce, which means that the simulation cannot reach the threshold density. To illustrate the general behaviour for each set of parameters (s, c0), we compute 50 realizations.
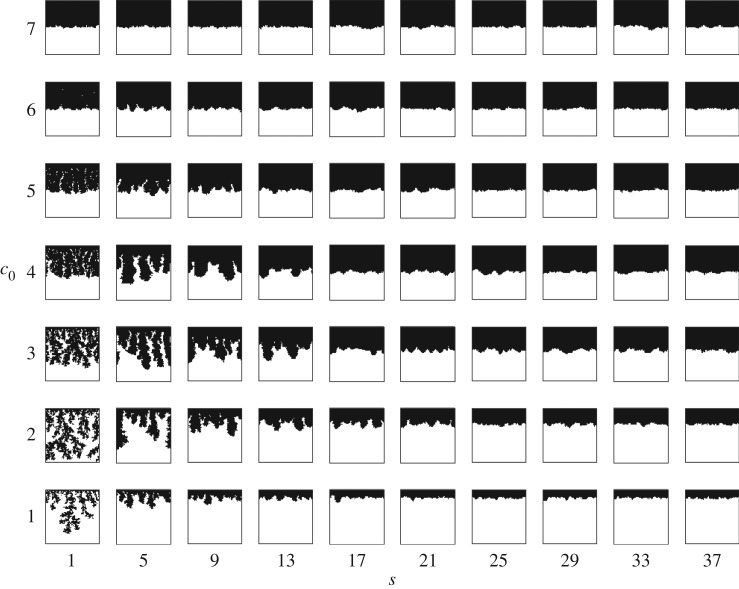
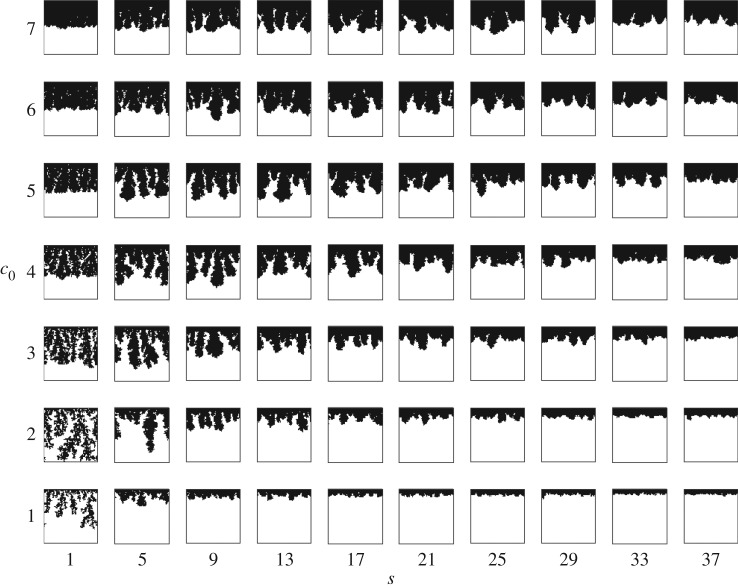
Representative morphologies for each pair (s, c0) are shown in the phase diagram in figure 6. For s = 1 and c0 ≤ 2, the colony grows into thin branches reminiscent of DLG growth. Significantly, this suggests that the colony can undergo filamentous growth without any bias in the direction of cell growth. This behaviour was not shown in the corresponding diagram given by Matsuura [24, fig. 6, p. 318] for the multilayer version of the model. For 5 ≤ s ≤ 17 and c0 ≤ 5, the colony grows in thicker branches. If either s or c0 becomes sufficiently large, then the colony grows uniformly, irrespective of the value of the other parameter.
Figure 6.
Typical simulated colony shapes corresponding to unbiased growth ( ) for initial nutrient concentrations c0 between 1 and 7, and nutrient steps s from 1 to 37. All subfigures have the same axis limits. If either s or c0 is small, the morphology resembles filamentous growth; while, as either parameter is increased, the growth becomes more uniform.
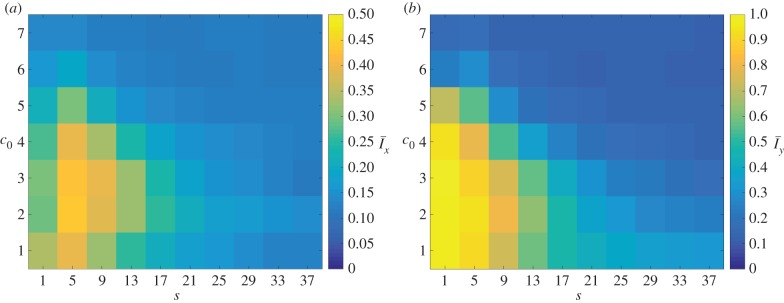
The changes in morphology are quantified by the spatial indices Ix and Iy. To illustrate the general behaviour of the colony growth we compute the mean value of each index over 50 realizations. The mean values of the indices over these realizations are denoted by  and
and  , respectively, and are plotted in figure 7. The indices show that the greatest filamentous growth, occurs at low values of s and c0, and that this decreases as either s or c0 increases. While the indices all share this general trend, the rate of change of each with respect to s and c0 is not the same, which indicates that each index provides unique information about the spatial pattern. By providing a quantitative measure of the morphology, the plots in figure 7 represent an improvement on previous phase diagrams, which classify morphology qualitatively, based on observations, rather than measurements [15,16].
Figure 7.
The mean values (a)  and (b)
  of the indices computed from 50 iterations of simulated unbiased growth (
 ) for a domain with Lx = Ly = 100. In general, both indices decrease as either s or c0 increase. (Online version in colour.)
3.2. Biased growth
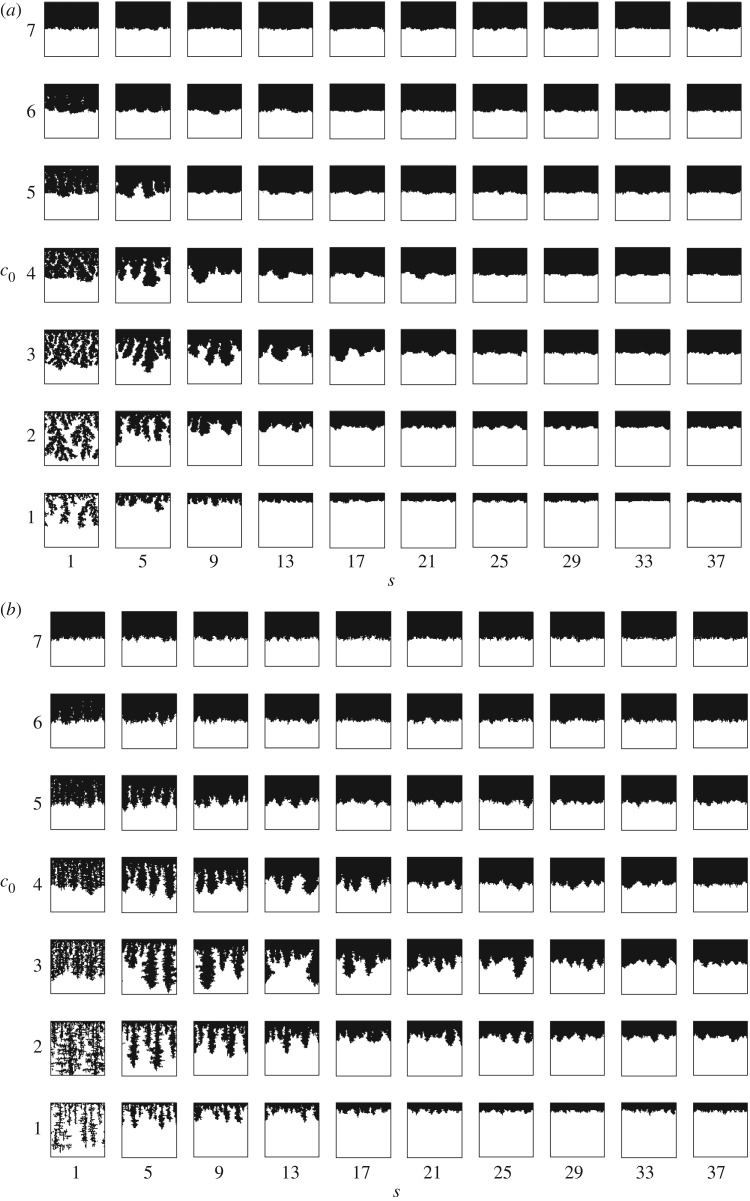
To illustrate the effect of directional bias on the morphology, we consider two extreme cases: pd = 0.2 and pd = 0.8. In the former case, daughter cells grow perpendicular to the cell axis, which runs between the proximal and distal poles, 80% of the time, similar to the axial growth pattern; whereas, in the latter, daughter cells grow from the distal pole 80% of the time, which resembles the distal-unipolar growth pattern. Solutions are computed for the same values of s and c0 as in the unbiased case.
Typical colony shapes for pd = 0.2 are plotted in figure 8a. Notably, simulations with s ≤ 13 and c0 ≤ 4 produce filamentous patterns despite a preference for perpendicular growth. This behaviour is a form of DLG, similar to the behaviour observed in non-motile bacteria at low-nutrient concentrations [16]. Representative colonies for pd = 0.8 are shown in figure 8b. The large value of pd results in straight filaments that are typically longer than those for unbiased growth.
Figure 8.
Typical simulated colonies with (a) axial (pd = 0.2) and (b) distal-unipolar growth (pd = 0.8) for initial nutrient concentrations c0 between 1 and 7, and nutrient steps s varying from 1 to 37 for a domain with Lx = Ly = 100. All subfigures have the same axis limits. At some values of s and c0 the morphology changes significantly with pd, while at others there is little change.
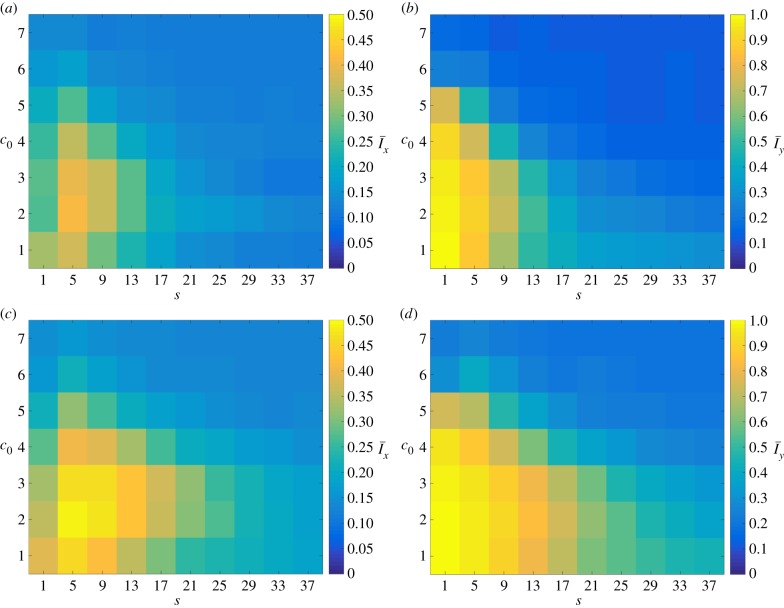
The changes in behaviour due to varying pd are quantified by the mean values of the indices Ix and Iy, plotted in figure 9, computed using 50 realizations for each pair (s, c0). By inspecting the indices, the changes in morphology observed between the two values of pd can be placed broadly into three categories. When both s and c0 are small, the colonies display large index values regardless of pd, such as at (s, c0) = (1, 1). Similarly, large values of both s and c0 generate colonies with low indices, as seen for (s, c0) = (37, 7). Within the intermediate region the growth pattern depends strongly on the bias pd. For example, colonies with (s, c0) = (21, 3), show a significant increase in both indices between pd = 0.2 and 0.8. Thus, morphologies in this region may be altered by adjusting the directional bias. This matches the dimorphic behaviour of real-world yeast colonies, which may exist within this parameter regime.
Figure 9.
The mean values  and
and  for data simulated on a domain with Lx = Ly = 100 with (a and b) axial growth (pd = 0.2) and (c and d) distal-unipolar growth (pd = 0.8). In general, increasing pd causes Ix and Iy to increase, which indicates a greater level of filamentous growth. (Online version in colour.)
These three growth regimes may be delineated using one of the spatial indices. We first define  to be the value of Ix for distal-unipolar (biased) growth divided by the average value computed for bipolar (unbiased) growth at the same parameter values (s, c0). The three growth regimes are then defined by the following criteria:
| 3.1a |
| 3.1b |
| 3.1c |
These three regions, plotted in figure 10, partition the parameter space with respect to s and c0 based upon how each parameter pair is affected by the change to distal-unipolar growth. Within the uniform and DLG regions the morphology is relatively insensitive to the cell growth pattern, remaining uniform or filamentous, respectively, regardless of the growth pattern. The intermediate zone consists of a region between the DLG and uniform zones in which the morphology varies significantly with the growth pattern.
Figure 10.
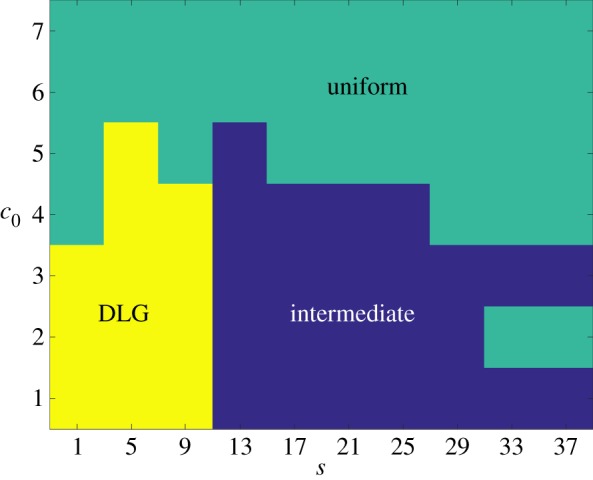
The DLG, uniform and intermediate growth regions computed from 50 realizations of simulated data on a domain with Lx = Ly = 100. In the intermediate region, the growth pattern depends strongly on the directional bias; while, outside this region, the growth pattern is determined by the step size s and initial concentration c0. (Online version in colour.)
As discussed above, all simulations are computed until the cell density ρ reaches 0.5 or all nutrient is consumed. All of the colonies that do not achieve the target density lie in the region c0 ≤ 3. In each case, the mean density increases with the bias pd, meaning that colonies with a greater bias produce a larger number of cells. This illustrates that the growth mode of the cells has an impact on the survival of the colony, and thus the ability to alter this growth mode provides an evolutionary advantage.
4. Experimental case studies
4.1. Methodology
We consider two experimental case studies: the onset of filamentous growth and very mature colony growth. For each study, we seek to infer the dominant growth mode in the experimental data by comparing the morphology with the behaviour predicted by the model. We emphasize that these comparisons are to illustrate general behaviour only and rigorous comparisons of model results with experimental data are left for future work.
A yeast colony was seeded from a single cell of Σ1278b (diploid, prototrophic) on 55 mm plates with yeast nitrogen base (YNB) agar, at a depth of 2 mm (DifcoTM YNB w/o amino acids and ammonium sulfate, cat. no. 233520, with 2% glucose, 50 μM ammonium sulfate and 2% twice washed bacto agar). Plates were incubated at 30°C. Each image is a typical representation of three biological replicates.
4.2. Onset of filamentous growth
As an example of the onset of filamentous growth, we consider the experimental image from figure 2c, which was taken 13 days after inoculation with a single cell, at which time the colony had a diameter of approximately 3.2 mm. To identify the growth mechanism that generated this pattern, we compare this image to simulations of both unbiased growth ( ) and biased growth (pd = 0.8). To achieve sufficient resolution in the simulations, we set Lx = 300 and Ly = 100, and 50 realizations were computed over the same range of parameters as in §3. As the simulation represents only a small section of the boundary, it is not appropriate to make a comparison using the value of Iy, which must be computed from an entire colony. The data and simulations are hence compared using Ix alone, with the experimental image yielding Ix = 0.266. For each value of the bias pd, we rank the simulations by how closely Ix matches the experimental value, select the top 100 cases and identify to which of the three regions shown in figure 10 they correspond.
With unbiased growth, the best match is provided by (s, c0) = (1, 4) in the uniform region, for which Ix differs by less than 1.2 × 10⁻⁵, while the top 100 matches all lie within 8.5 × 10⁻³ of the experimental value. We find that 81% of these matches come from the DLG region, 7% are from the intermediate region and 12% are from the uniform region. For the biased example, the best match is given by (s, c0) = (29, 3), which lies in the intermediate region, and differs from the experimental value by only 8.6 × 10⁻⁵. In contrast with the unbiased example, the top 100 matches are more diverse, comprising 18% DLG growth, 46% intermediate growth and 36% uniform growth.
While the composition of the top 100 results differs between the unbiased and biased examples, each of these is able to produce similar morphologies. To illustrate this, we compare the best match from the DLG region computed using unbiased growth, which was the fifth-best match overall for unbiased growth, and the best match from the intermediate region computed using biased growth, which was also the best match overall for unbiased growth. These simulations had parameters (s, c0) = (13, 3) and (s, c0) = (29, 3), respectively, and are plotted in figure 11. Both simulated images show similar behaviour and have values of Ix within 1.5 × 10⁻⁴ of the experimental image. Consequently, this model suggests that it is impossible to tell DLG from pseudohyphal growth by examining images using Ix alone.
Figure 11.
Examples of the onset of filamentous growth. Shown are (a) an experimental image with Ix = 0.266, (b) the fifth-best match using Ix with unbiased growth ( ), which has parameters (s, c0) = (13, 3) and comes from the DLG region, and (c) the best match for distal-unipolar growth (pd = 0.8), which has parameters (s, c0) = (29, 3) and comes from the intermediate region. The two simulated results yield similar morphologies but come from different growth regions, which suggests that both mechanisms are able to produce comparable results.
4.3. Very mature colony growth
As a second case study, we consider the morphology of a colony after 58 days of growth under the same conditions as previously, shown in figure 12a, which represents a very mature yeast colony. As a model comparison we use a domain with Lx = Ly = 200 with seed cells placed at every grid point within 60 units of the domain centre, which represents a region of uniform growth. This initial condition reduces the number of computations required and avoids the issues inherent in simulating colonies with circular boundaries on a rectangular grid. We consider unbiased growth ( ) and consider a range of parameters (s, c0), in each case computing the simulation until ρ = 0.5 or all nutrient is consumed. This value is chosen so as to provide a similar level of growth to the experimental image. We aim only to compare the growth patterns produced by the experimental colony and the simulations, rather than make a precise match.
Figure 12.
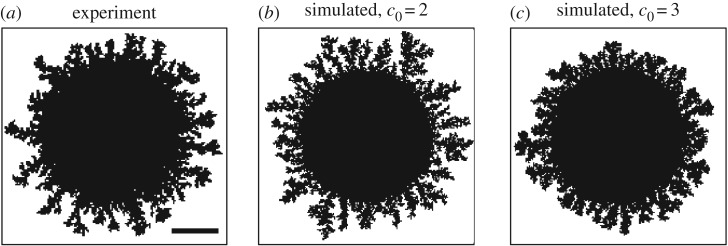
An example of a very mature colony. (a) The experimental image was taken after 58 days of growth and converted into binary. The scale bar represents 2 mm. The experimental conditions are as described in §4.1. This colony has indices Ir = 0.29 and Iθ = 0.113. Model simulations are computed using Lx = Ly = 200 and s = 1, with unbiased growth ( ) and initial nutrient concentrations (b) c0 = 2, with indices Ir = 0.27 and Iθ = 0.119, and (c) 3, with indices Ir = 0.23 and Iθ = 0.0936. The model simulations provide good quantitative and qualitative matches to the experimental behaviour, which suggests that it is not possible to distinguish the filamentous growth of this colony from DLG.
To compare the model simulations with the experimental image, we use two of the spatial indices developed by Binder et al. [37] for disc-like colonies that motivated the indices Ix and Iy; respectively, these are Iθ, which measures angular variation, and Ir, which measures radial variation. To match the definition of Ix we here define Iθ to be the square root of the version used by Binder et al. [37]. For both indices, the data are grouped into 50 bins, which has been found to provide sufficient resolution, with radial bins used to compute Ir and angular bins used for Iθ.
The experimental image in figure 12a has indices Ir = 0.29 and Iθ = 0.113. Computing a single realization of the model using (s, c0) = (1, 2) produces a colony with Ir = 0.27 and Iθ = 0.119, while a single realization with (s, c0) = (1, 3) produces a colony with Ir = 0.23 and Iθ = 0.0936, both of which are plotted in figure 12. Each simulation closely resembles the experimental image qualitatively, while the index values show that these also provide a good quantitative match. Both sets of parameters lie within the DLG region, while simulations outside of this region produce smaller indices that do not provide a good match to the experimental image. Further, simulations with biased (pseudohyphal) growth are able to produce similar patterns. This suggests that, when measured by Ir and Iθ, it is not possible to distinguish the filamentous growth of the colony in figure 12a from a morphology produced by DLG alone.
5. Extensions
5.1. Ongoing nutrient consumption
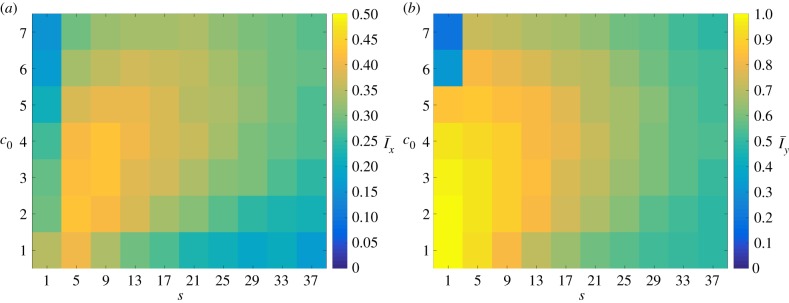
As in the original formulation of Matsuura [24], it has been assumed that the cells require a specified amount of stored nutrient so as to reproduce but do not need to consume nutrient to survive; however, in practice, cells require ongoing nourishment for maintenance [41]. The consumption of nutrient may be modelled by removing the limit ms on the total amount of nutrient each cell can store. Typically colony shapes with this restriction removed are shown in figure 13, while the mean indices from 50 simulations for a range of values for s and c0 are plotted in figure 14. This change in ms causes increases in  and
and  , plotted in figure 13, compared to the values obtained for limited nutrient consumption from figure 6. This occurs because removing the storage limit reduces the amount of nutrient available over the course of the simulation, which leads to DLG and hence greater non-uniform behaviour across almost all parameters.
Figure 13.
Typical simulated colonies for a domain with Lx = Ly = 100 and unbiased growth ( ) for initial nutrient concentrations c0 between 1 and 7, and nutrient steps s varying from 1 to 37 with ongoing nutrient consumption. All subfigures have the same axis limits. In general, ongoing nutrient consumption causes greater levels of filamentous growth when compared with growth without ongoing nutrient consumption, shown in figure 6.
Figure 14.
The mean values (a)  and (b)
  of the indices from 50 iterations of simulated unbiased growth (
 ) on a domain with Lx = Ly = 100 with Lx = Ly = 100 and ongoing nutrient consumption. Ongoing nutrient consumption shifts the values of the indices but does not introduce new growth patterns. (Online version in colour.)
By computing simulations with ongoing nutrient consumption and pd = 0.8, we are able to identify the three growth regions (3.1), which are shown in figure 15. Including ongoing nutrient consumption causes a shift in the location of the three growth regions identified in §3, and thus must be considered when predicting experimental results based on known physical parameters. We emphasize, however, that ongoing nutrient consumption does not affect the existence of the three growth regions from §3 but only alters the values of s and c0 at which they occur. While the model could be further extended to include the degradation of stored nutrient by the cells, this would again only alter the location of the growth regions and hence is not considered here. Future models that include ongoing nutrient consumption should incorporate nutrient degradation in order to provide a more realistic representation of this process.
Figure 15.
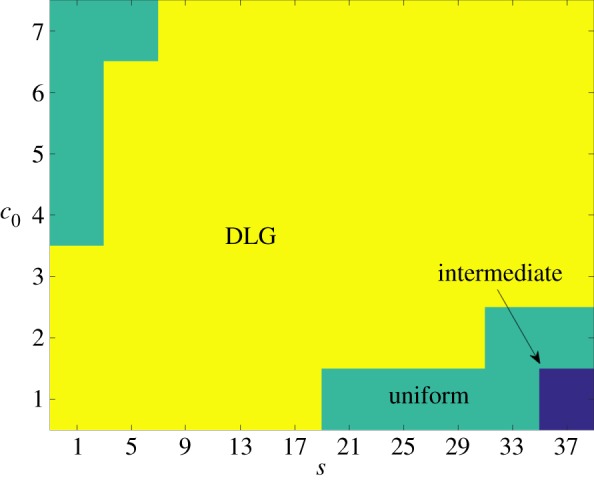
The DLG, uniform and intermediate growth regions computed with ongoing nutrient consumption from 50 iterations on a domain with Lx = Ly = 100. In the intermediate region, the growth pattern depends strongly on the directional bias; while, outside this region, the growth pattern is determined by the step size s and initial concentration c0. (Online version in colour.)
5.2. Bias due to nutrient concentration
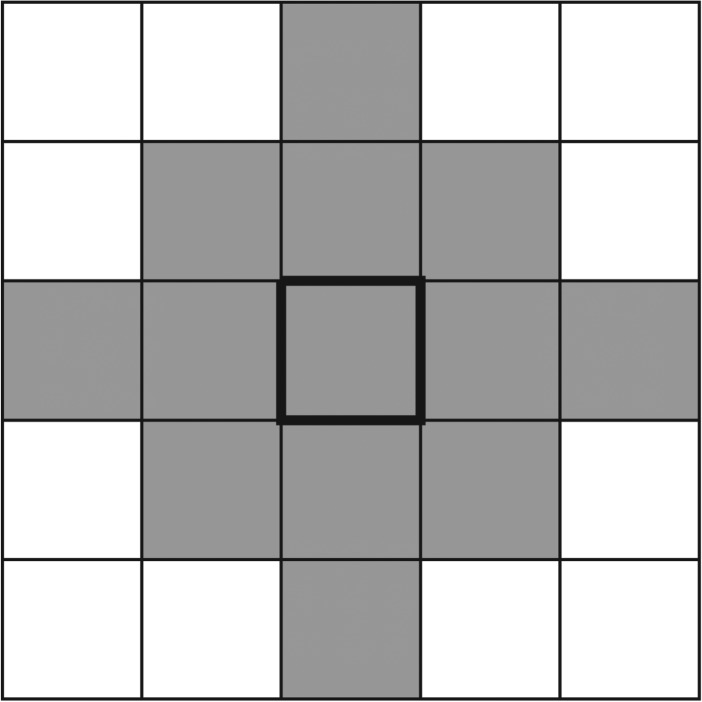
The examples considered thus far have demonstrated that increasing the directional bias causes some colonies to change from uniform to filamentous growth. In all of these examples, the bias has been held constant throughout the simulation; however, in practice the transition to pseudohyphal growth of a yeast colony is typically attributed to nutrient deprivation, which can occur either when the medium contains little nutrient or when nutrient cannot diffuse with sufficient speed to feed the colony. This transition may be modelled by taking the initial bias to be  , corresponding to uniform growth, and increasing this value as the local nutrient concentration falls. For the purposes of this study, we define the local concentration c at a given cell to be the average concentration within the lattice points that can be reached in at most two steps, as illustrated in figure 16.
Figure 16.
The region used to define the local nutrient concentration. The shaded locations represent all locations within two steps of the central square, indicated by a thick border.
We here consider two forms for this change. The first is a linear transition from unbiased growth ( ) at nutrient concentrations above some critical concentration ct to biased growth (pd = 1) at local concentration c = 0. This corresponds to setting
 |
In the second form, the growth is uniform ( ) for local concentrations c > ct and jumps to a bias of 0.8 for 0 < c < ct, which is described by
 |
To facilitate a general investigation of this transition, the value of ct is chosen to be the minimum amount of nutrient required to reach ρ = 0.5 with Lx = Ly = 100 and ν0 = 100, so that
In practice, the value of ct depends on the strain of yeast used and must be determined experimentally.
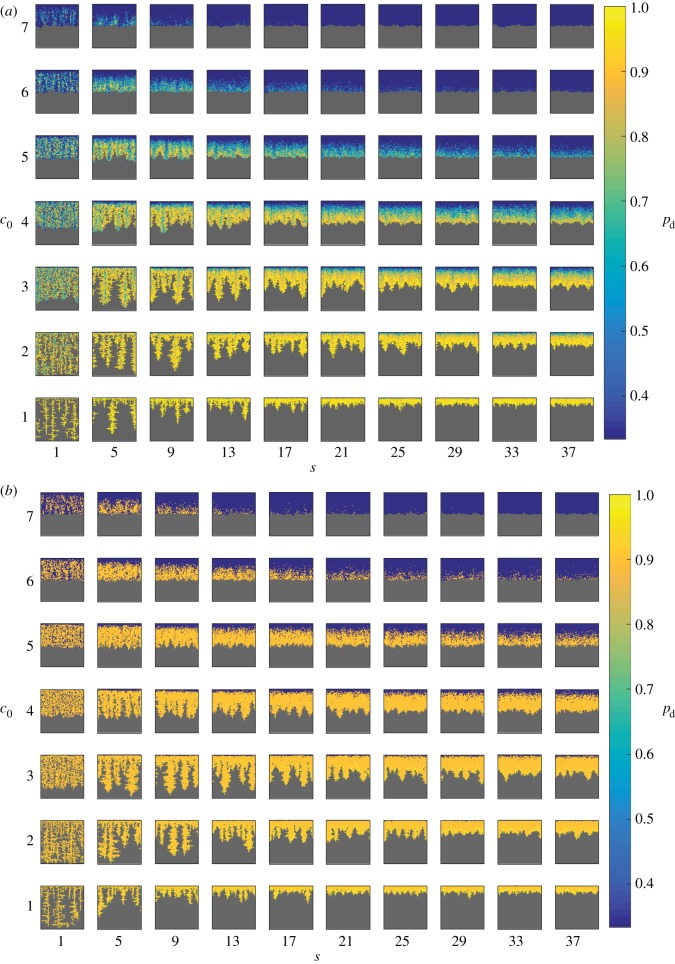
Typical colony shapes for the two bias rules are shown in figure 17 for a range of initial nutrient concentrations c0 and nutrient steps s, with cells coloured by the value of pd of their mother cell at the time of birth. Comparing the two cases, it is clear that the linear and step cases result in noticeably different biases at each parameter pair (s, c0), as indicated by the differences in colour between the two figures. The mean indices  and
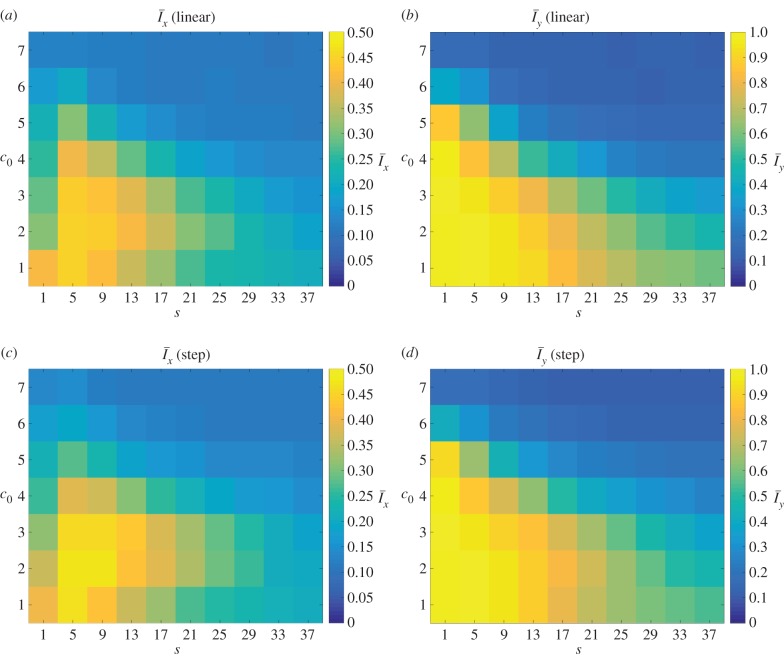
and  are computed from 50 realizations of each pair of parameters and are plotted in figure 18. Both indices indicate that similar patterns are produced by both bias rules, with the most significant difference being a larger value of
  at (5, 2) for the step rule compared to the linear rule. This suggests that both the linear and step bias rules produce similar colony morphologies, despite the differences in the bias pd throughout the colonies.
Figure 17.
Typical simulated colony shapes with varying bias pd for initial nutrient concentrations c0 between 1 and 7, and nutrient steps s from 1 to 37. All subfigures have the same axis limits. Shown are the results using the (a) linear and (b) step bias rules. Cells are coloured by the value of pd of their mother cell at the time of birth. While the rules produce different values of pd throughout the colonies, the final morphologies are similar. (Online version in colour.)
Figure 18.
Mean values  and
and  of the indices for 50 realizations of simulated colony growth using the (a and b) linear and (c and d) step bias rules. The mean values of the indices are similar for both transition rules. (Online version in colour.)
Both of the bias rules cause increases in the indices at intermediate values of s and c0 compared to the values for uniform unbiased growth plotted in figure 7. This is in agreement with the results from §3, where it was found that the growth pattern is strongly dependent upon the bias at intermediate values of s and c0. The increase in the indices also agrees with the experimental observation that nutrient deprivation leads to pseudohyphal growth.
6. Conclusion
We have developed a two-dimensional agent-based model for the growth of yeast cells that incorporates both dimorphic growth behaviour and nutrient diffusion. In this model, non-motile yeast cells occupy sites on a lattice and absorb discrete nutrient packets that walk randomly throughout the same lattice. The growth pattern is specified by adjusting the bias in the direction of cell proliferation. Improving on previous work, this model accounts for all three key features of pseudohyphal growth: (I) a change to the distal-unipolar growth pattern; (II) the elongation of cells and (III) the adhesion of daughter cells to their mother. The model developed captures the important biological features of pseudohyphal growth while remaining computationally efficient, and hence is highly suitable for use with statistical inference methods, such as ABC algorithms, to compute parameter estimates from experimental data. The spatial patterns that develop were quantified using two indices Ix and Iy, which are related to similar indices that have been used by Binder et al. [37] to quantify experimental images of yeast colonies. Larger values of these indices indicate stronger filamentous patterns. Simple rules have been used to link the bias to the nutrient level, which replicates the real-world behaviour of yeast colonies.
In general, increasing the bias causes an increase in both indices, indicating that the bias is correctly capturing the transition to pseudohyphal growth. By varying the initial nutrient concentration and diffusivity, and comparing the average value of Ix computed for a number of realizations, the parameter space may be divided into three regions: the uniform region, in which the colony front is smooth; the DLG region, in which the front is always rough; and the intermediate region, in which the morphology depends strongly upon the bias level. If the transition to pseudohyphal growth is solely due to budding pattern and cell length, then real-world colonies probably exist in this region. Outside of the intermediate region the morphology is largely determined by the nutrient concentration and diffusivity.
Comparing simulations of unbiased and biased growth showed that both DLG and pseudohyphal growth can produce similar patterns, and both mechanisms can provide a good match to experimental images when measured using the spatial indices employed here. This suggests that both mechanisms may contribute to the morphology and that it is not possible to distinguish DLG from pseudohyphal growth using the indices alone without knowing the precise growth conditions. The experimental results of Chen et al. [25] show that yeast colony morphology changes as the agar concentration varies between 1.5% and 6% with glucose (nutrient) levels between 0.5% and 2%. The diffusion of sodium and caesium has been measured in gels of up to 4% agar at 10°C and 25°C, from which it was found that the diffusion coefficient could be approximated by Dn = D0(1 − 0.023ω), where D0 is the diffusion coefficient in water and ω is the weight percentage of agar [42]. This suggests that the diffusivity varies little with agar concentration. There is thus a need for a greater understanding of the role that nutrient diffusivity plays in yeast colony morphology; in particular, how this varies with agar concentration, and how this interacts with pseudohyphal growth patterns. The model developed here provides an avenue for exploring these questions, which was not possible using previous models. Furthermore, there is scope to use this model to understand the growth of other microbial colonies and to compare the dominant mechanisms leading to non-uniform morphologies, providing a complete theory of these processes.
The degree of pseudohyphal growth in the model may be adjusted by varying the directional bias parameter. By tuning this parameter using experimental data and, for example, ABC algorithms, the model has the potential to facilitate the identification of strain-specific growth characteristics, paving the way for the development of strain-classification schemes. The identification of strain-specific features is also vital to the analysis of gene-deletion assays. Furthermore, the greater understanding of yeast cell growth provided by this model allows the cell behaviour to be explored and optimized, either to encourage growth, such as is desired for food production, or to prevent it, such as in the case of yeast colony growth on medical equipment.
While the model considered here captured the general behaviour of yeast colony growth, all of the patterns were constrained to a lattice. This limited the number of daughter cells to three and constrained the patterns that could be realized. In practice, cells can produce approximately 24 daughters, and approximately seven when confined within a colony, and bud in a variety of directions [43]. In addition, the budding pattern of pseudohyphal growth and the corresponding elongation of cells have both been represented by an increase in the directional bias. These factors are likely to have an influence on the colony morphology. Future work will consider off-lattice models with fewer restrictions on cell growth and that incorporate changes in cell shape explicitly. Consideration must also be given to the effect on the nutrient level of lysis products from dead cells.
Both DLG and pseudohyphal growth appear similar when measured by Ix; however, it is possible that a more sophisticated measure, including a combination of different metrics, could distinguish these growth modes. Future work will thus continue to investigate and develop suitable spatial measures, along with techniques for categorizing colony morphology using these measures.
Supplementary Material
Supplementary Material
Supplementary Material
Acknowledgements
The Σ1278b yeast strain used in the experiments was supplied by the Fink Laboratory at the Whitehead Institute for Biomedical Research.
Data accessibility
The processed experimental image analysed in figure 11 is included in the electronic supplementary material. The code used to generate the simulations is available in the online electronic supplementary material.
Authors' contributions
B.J.B., J.M.G., J.F.S., S.G.O. and V.J. conceived and designed the experiments. J.M.G. performed the experiments and collected the data. H.T. and B.J.B. undertook the mathematical modelling and data analysis. H.T., B.J.B., J.M.G., J.F.S., S.G.O. and V.J. wrote and edited the paper. All authors gave final approval for publication.
Competing interests
We declare that we have no competing interests.
Funding
H.T. and B.J.B. were supported by Australian Research Council Discovery Project DP160102644, awarded to B.J.B. and S.G.O. V.J., J.M.G. and J.F.S. were supported by Australian Research Council Discovery Project DP130103547 awarded to V.J. and S.G.O.
References
- 1.Cullen PJ, Sprague GF. 2012. The regulation of filamentous growth in yeast. Genetics 190, 23–49. ( 10.1534/genetics.111.127456) [DOI] [PMC free article] [PubMed] [Google Scholar]
- 2.Nigg M, Bernier L. 2017. Large-scale genomic analyses of in vitro yeast–mycelium dimorphism in human, insect and plant pathogenic fungi: from ESTs to RNAseq experiments. Fungal Biol. Rev. 31, 131–142. ( 10.1016/j.fbr.2017.04.001) [DOI] [Google Scholar]
- 3.Botstein D, Chervitz SA, Cherry M. 1997. Yeast as a model organism. Science 277, 1259–1260. ( 10.1126/science.277.5330.1259) [DOI] [PMC free article] [PubMed] [Google Scholar]
- 4.Cullen PJ. 2015. Investigating filamentous growth and biofilm/mat formation in budding yeast. Cold Spring Harbor Protocols 2015, 235–238. ( 10.1101/pdb.top077495) [DOI] [PMC free article] [PubMed] [Google Scholar]
- 5.Gimeno CJ, Ljungdahl PO, Styles CA, Fink GR. 1992. Unipolar cell divisions in the yeast S. cerevisiae lead to filamentous growth: regulation by starvation and RAS. Cell 68, 1077–1090. ( 10.1016/0092-8674(92)90079-r) [DOI] [PubMed] [Google Scholar]
- 6.Dickinson JR. 1996. ‘Fusel’ alcohols induce hyphal-like extensions and pseudohyphal formation in yeasts. Microbiology 142, 1391–1397. ( 10.1099/13500872-142-6-1391) [DOI] [PubMed] [Google Scholar]
- 7.Lorenz MC, Cutler NS, Heitman J. 2000. Characterization of alcohol-induced filamentous growth in Saccharomyces cerevisiae. Mol. Biol. Cell 11, 183–199. ( 10.1091/mbc.11.1.183) [DOI] [PMC free article] [PubMed] [Google Scholar]
- 8.Zaragoza O, Gancedo JM. 2000. Pseudohyphal growth is induced in Saccharomyces cerevisiae by a combination of stress and cAMP signalling. Antonie van Leeuwenhoek 78, 187–194. ( 10.1023/A:1026594407609) [DOI] [PubMed] [Google Scholar]
- 9.Erdman S, Snyder M. 2001. A filamentous growth response mediated by the yeast mating pathway. Genetics 159, 919–928. [DOI] [PMC free article] [PubMed] [Google Scholar]
- 10.Casalone E, Barberio C, Cappellini L, Polsinelli M. 2005. Characterization of Saccharomyces cerevisiae natural populations for pseudohyphal growth and colony morphology. Res. Microbiol. 156, 191–200. ( 10.1016/j.resmic.2004.09.008) [DOI] [PubMed] [Google Scholar]
- 11.Matsushita M, Fujikawa H. 1990. Diffusion-limited growth in bacterial colony formation. Phys. A Stat. Mech. Appl. 168, 498–506. ( 10.1016/0378-4371(90)90402-e) [DOI] [Google Scholar]
- 12.Lacasta AM, Cantalapiedra IR, Auguet CE, Penaranda A, Ramirez-Piscina L. 1999. Modeling of spatiotemporal patterns in bacterial colonies. Phys. Rev. E 59, 7036–7041. ( 10.1103/physreve.59.7036) [DOI] [PubMed] [Google Scholar]
- 13.Giverso C, Verani M, Ciarletta P. 2015. Branching instability in expanding bacterial colonies. J. R. Soc. Interface 12, 20141290 ( 10.1098/rsif.2014.1290) [DOI] [PMC free article] [PubMed] [Google Scholar]
- 14.Fujikawa H, Matsushita M. 1989. Fractal growth of Bacillus subtilis on agar plates. J. Phys. Soc. Jpn. 58, 3875–3878. ( 10.1143/JPSJ.58.3875) [DOI] [Google Scholar]
- 15.Fujikawa H. 1994. Diversity of the growth patterns of Bacillus subtilis colonies on agar plates. FEMS Microbiol. Ecol. 13, 159–167. ( 10.1111/j.1574-6941.1994.tb00062.x) [DOI] [Google Scholar]
- 16.Ohgiwari M, Matsushita M, Matsuyama T. 1992. Morphological changes in growth phenomena of bacterial colony patterns. J. Phys. Soc. Jpn. 61, 816–822. ( 10.1143/jpsj.61.816) [DOI] [Google Scholar]
- 17.Walther T, Reinsch H, Ostermann K, Deutsch A, Bley T. 2005. Coordinated development of yeast colonies: an experimental analysis of the adaptation to different nutrient concentrations—part 1. Eng. Life Sci. 5, 115–124. ( 10.1002/elsc.200422459) [DOI] [Google Scholar]
- 18.Walther T, Reinsch H, Ostermann K, Deutsch A, Bley T. 2005. Coordinated development of yeast colonies: quantitative modeling of diffusion-limited growth—part 2. Eng. Life Sci. 5, 125–133. ( 10.1002/elsc.200420060) [DOI] [Google Scholar]
- 19.Jönsson H, Levchenko A. 2005. An explicit spatial model of yeast microcolony growth. Multiscale Model. Simul. 3, 346–361. ( 10.1137/040603255) [DOI] [Google Scholar]
- 20.Eden M. 1961. A two-dimensional growth process. In Proc. of the Fourth Berkeley Symp. on Mathematical Statistics and Probability: Held at the Statistical Laboratory University of California, June 20–July 30, 1960 (ed. J Neyman). Contributions to probability theory, vol. 2, pp. 223–239. Berkeley, CA: University of California Press. [Google Scholar]
- 21.Witten TA Jr, Sander LM. 1981. Diffusion-limited aggregation, a kinetic critical phenomenon. Phys. Rev. Lett. 47, 1400–1403. ( 10.1103/physrevlett.47.1400) [DOI] [Google Scholar]
- 22.Laszlo JA, Silman RW. 1993. Cellular automata simulations of fungal growth on solid substrates. Biotechnol. Adv. 11, 621–633. ( 10.1016/0734-9750(93)90031-h) [DOI] [PubMed] [Google Scholar]
- 23.Ermentrout GB, Edelstein-Keshet L. 1993. Cellular automata approaches to biological modeling. J. Theor. Biol. 160, 97–133. ( 10.1006/jtbi.1993.1007) [DOI] [PubMed] [Google Scholar]
- 24.Matsuura S. 2000. Random growth of fungal colony model on diffusive and non-diffusive media. Forma 15, 309–319. [Google Scholar]
- 25.Chen L, Noorbakhsh J, Adams RM, Samaniego-Evans J, Agollah G, Nevozhay D, Kuzdzal-Fick J, Mehta P. 2014. Two-dimensionality of yeast colony expansion accompanied by pattern formation. PLOS Comput. Biol. 10, e1003979 ( 10.1371/journal.pcbi.1003979) [DOI] [PMC free article] [PubMed] [Google Scholar]
- 26.Gerlee P, Anderson ARA. 2007. Stability analysis of a hybrid cellular automaton model of cell colony growth. Phys. Rev. E 75, 051911 ( 10.1103/physreve.75.051911) [DOI] [PubMed] [Google Scholar]
- 27.Zupan J, Raspor P. 2008. Quantitative agar-invasion assay. J. Microbiol. Methods 73, 100–104. ( 10.1016/j.mimet.2008.02.009) [DOI] [PubMed] [Google Scholar]
- 28.Zupan J, Raspor P. 2010. Invasive growth of Saccharomyces cerevisiae depends on environmental triggers: a quantitative model. Yeast 27, 217–228. ( 10.1002/yea.1746) [DOI] [PubMed] [Google Scholar]
- 29.Ruusuvuori P, et al. 2014. Quantitative analysis of colony morphology in yeast. BioTechniques 56, 18–27. ( 10.2144/000114123) [DOI] [PMC free article] [PubMed] [Google Scholar]
- 30.Phelps JH, Tucker CL. 2006. Lagrangian particle calculations of distributive mixing: limitations and applications. Chem. Eng. Sci. 61, 6826–6836. ( 10.1016/j.ces.2006.07.008) [DOI] [Google Scholar]
- 31.Binder BJ, Landman KA. 2011. Quantifying evenly distributed states in exclusion and nonexclusion processes. Phys. Rev. E 83, 041914 ( 10.1103/physreve.83.041914) [DOI] [PubMed] [Google Scholar]
- 32.Binder BJ, Simpson MJ. 2013. Quantifying spatial structure in experimental observations and agent-based simulations using pair-correlation functions. Phys. Rev. E. 88, 022705 ( 10.1103/physreve.88.022705) [DOI] [PubMed] [Google Scholar]
- 33.Agnew DJG, Green JEF, Brown TM, Simpson MJ, Binder BJ. 2014. Distinguishing between mechanisms of cell aggregation using pair-correlation functions. J. Theor. Biol. 352, 16–23. ( 10.1016/j.jtbi.2014.02.033) [DOI] [PubMed] [Google Scholar]
- 34.Treloar KK, Simpson MJ, Binder BJ, McElwain DLS, Baker RE. 2014. Assessing the role of spatial correlations during collective cell spreading. Sci. Rep. 4, 5713 ( 10.1038/srep05713) [DOI] [PMC free article] [PubMed] [Google Scholar]
- 35.Binder BJ, Simpson MJ. 2015. Spectral analysis of pair-correlation bandwidth: application to cell biology images. Open Sci. 2, 140494 ( 10.1098/rsos.140494) [DOI] [PMC free article] [PubMed] [Google Scholar]
- 36.Dini S, Binder BJ, Fischer SC, Mattheyer C, Schmitz A, Stelzer EHK, Bean NG, Green JEF. 2016. Identifying the necrotic zone boundary in tumour spheroids with pair-correlation functions. J. R. Soc. Interface 13, 20160649 ( 10.1098/rsif.2016.0649) [DOI] [PMC free article] [PubMed] [Google Scholar]
- 37.Binder BJ, Sundstrom JF, Gardner JM, Jiranek V, Oliver SG. 2015. Quantifying two-dimensional filamentous and invasive growth spatial patterns in yeast colonies. PLOS Comput. Biol. 11, e1004070 ( 10.1371/journal.pcbi.1004070) [DOI] [PMC free article] [PubMed] [Google Scholar]
- 38.Marjoram P, Molitor J, Plagnol V, Tavaré S. 2003. Markov chain Monte Carlo without likelihoods. Proc. Natl Acad. Sci. USA 100, 15 324–15 328. ( 10.1073/pnas.0306899100) [DOI] [PMC free article] [PubMed] [Google Scholar]
- 39.Johnston ST, Simpson MJ, McElwain DLS, Binder BJ, Ross JV. 2014. Interpreting scratch assays using pair density dynamics and approximate Bayesian computation. Open Biol. 4, 140097 ( 10.1098/rsob.140097) [DOI] [PMC free article] [PubMed] [Google Scholar]
- 40.Phillips RB, Kondev J, Theriot J, Orme N, Garcia H. 2009. Physical biology of the cell. New York, NY: Garland Science. [Google Scholar]
- 41.Pirt SJ. 1965. The maintenance energy of bacteria in growing cultures. Proc. R. Soc. Lond. B 163, 224–231. ( 10.1098/rspb.1965.0069) [DOI] [PubMed] [Google Scholar]
- 42.Slade AL, Cremers AE, Thomas HC. 1966. The obstruction effect in the self-diffusion coefficients of sodium and cesium in agar gels. J. Phys. Chem. 70, 2840–2844. ( 10.1021/j100881a020) [DOI] [Google Scholar]
- 43.Mortimer RK, Johnston JR. 1959. Life span of individual yeast cells. Nature 183, 1751–1752. ( 10.2172/4329664) [DOI] [PubMed] [Google Scholar]
Associated Data
This section collects any data citations, data availability statements, or supplementary materials included in this article.
Supplementary Materials
Data Availability Statement
The processed experimental image analysed in figure 11 is included in the electronic supplementary material. The code used to generate the simulations is available in the online electronic supplementary material.


