Abstract
Background/Aims
MOD-4023 is a long-acting human growth hormone (hGH) in clinical trials for the treatment of growth hormone deficiency (GHD). A key goal is maintenance of serum concentrations of insulin-like growth factor (IGF) 1 within normal range throughout GH dosing. The study aimed to develop a pharmacokinetic model for MOD-4023 and a pharmacodynamic model for the effect of MOD-4023 on IGF-1 to allow estimation of peak and mean IGF-1 and to identify the optimal IGF-1 sampling day.
Methods
MOD-4023 (0.25, 0.48, or 0.66 mg/kg) was administered weekly for 12 months to 41 GH-naive GHD children (age 3–11 years). The control group (n = 11, age 4–9 years) received daily recombinant human growth hormone (r-hGH; 34 µg/kg). Sparse samples (4/subject) were obtained to determine serum concentrations of MOD-4023 or r-hGH and IGF-1.
Results
A 2-compartment pharmacokinetic model with first-order absorption fit MOD-4023 data well; a 1-compartment model was appropriate for r-hGH. For both, weight-normalized systemic parameters were preferred over allometric scaling. For MOD-4023, an indirect model fit IGF-1 SDS data well; baseline IGF-1 increased over time. At steady state, samples obtained 4 days following dose administration predicted mean IGF-1 SDS during the dosing interval well.
Conclusion
The IGF-1 profile is consistent with the weekly dosing interval. Sampling 4 days following dose administration allows estimation of mean IGF-1 SDS during the dosing interval in GHD patients.
Keywords: Growth hormone, Growth hormone deficiency, Growth hormone replacement, Growth in children, Insulin growth factor 1, Long-acting growth hormone, Weekly growth hormone, Pharmacokinetic/pharmacodynamic modeling
Introduction
Although recombinant human growth hormone (r-hGH) is both safe and effective for the treatment of growth hormone deficiency (GHD) in children [1], the requirement for daily administration may compromise adherence to therapy [2]. Therefore, the development of a growth hormone (GH) that requires less frequent administration, for example weekly, has become a priority for drug development. MOD-4023 is a long-acting human GH (hGH) based on C-terminal peptide technology [3]. This technology arose from the observation that human chorionic gonadotropin differs from luteinizing hormone by the addition of 28 amino acids to the carboxy terminus; this small difference in molecular structure markedly increases the human chorionic gonadotropin residence time in blood compared to luteinizing hormone. Taking advantage of this observation, these same 28 amino acids were fused onto the hGH sequence to develop MOD-4023.
MOD-4023 has been evaluated in 2 clinical trials in adults and in 1 clinical trial in children. In CP-4-001, 24 healthy men aged 19–45 years received either placebo or 4, 7, or 21 mg MOD-4023 and blood was sampled to determine MOD-4023 and insulin-like growth factor 1 (IGF-1) concentrations up to 14 days after dose administration. In CP-4-003, 44 GHD adults aged 23–60 years underwent titration of their daily r-hGH treatment to ensure that serum IGF-1 SDS was within the range −1.5/+1.5, following which MOD-4023 (18.5–123.4% of the weekly cumulative r-hGH dose) was administered weekly. MOD-4023 was then sampled through 24 h and IGF-1 through 36 h. Study CP-4-004 was conducted in children (details provided later).
Data from the 2 adult studies (phase 1: unpublished results; phase 2 [4]) were used to develop a pharmacokinetic model for MOD-4023 and a pharmacodynamic model for IGF-1, a biomarker for the effects of GH. These models were then applied to children. During clinical use of MOD-4023, IGF-1 SDS values will be applied to assess safety of weekly therapy and to determine any potential need for dose adjustment, with the goal of maintaining serum concentrations of IGF-1 within the broad normal range for age and sex. During the 1-week dosing interval, IGF-1 (and the resulting IGF-1 SDS) values fluctuate. Therefore, it is necessary to understand whether IGF-1 concentrations obtained at different time points in the weekly dosing interval can be employed to predict peak and mean IGF-1 over the dosing interval. Simulations using the optimal pharmacokinetic and pharmacodynamic models were used to address this issue.
Patients and Methods
Patients
Prepubertal children aged 3–11 years with a confirmed diagnosis of GHD were considered for inclusion in the trial. Other inclusion and exclusion criteria are reported by Zelinska et al. [5]. Children (Tables 1, 2) were randomized to 1 of 3 weekly doses of MOD-4023 (0.25, 0.48, or 0.66 mg/kg weekly; n = 41; 27 boys, 14 girls) or daily r-hGH (Genotropin, 0.034 mg/kg/day; n = 11; 8 boys, 3 girls). MOD-4023 doses were selected using the following criteria:
cohort 1: the weekly molar equivalent to a standard daily dose of r-hGH (0.025 mg/kg/day or 0.18 mg/kg/week)
cohort 2: the weekly molar equivalent of the maximal recommended dose for GHD treatment (0.05 mg/kg/day, based on the Growth Hormone Society Consensus Guideline [6])
cohort 3: the weekly molar equivalent of the maximal approved dose for other pediatric indications (0.068 mg/kg/day)
Table 1.
Dose regimen for MOD-4023 and r-hGH in treatment-naive GHD children
| Cohort | n | Drug | Dose | Equivalent to, mg hGH/kg | Frequency |
|---|---|---|---|---|---|
| 1 | 13 | MOD-4023 | 0.25 mg protein/kg | 0.18 | weekly |
| 2 | 15 | MOD-4023 | 0.48 mg protein/kg | 0.35 | weekly |
| 3 | 13 | MOD-4023 | 0.66 mg protein/kg | 0.48 | weekly |
| 4 | 11 | Genotropin | 0.034 mg/kg | – | daily |
Table 2.
Baseline demographic values for 52 children who received MOD-4023 (n = 41) or r-hGH (n = 11)
| Mean | SD | Median | Minimum | Maximum | |
|---|---|---|---|---|---|
| Age, years | 6.0 | 2.1 | 5.5 | 3 | 11 |
| Weight, kg | 16.1 | 4.4 | 15.2 | 9.1 | 26.3 |
| Height, cm | 101.1 | 13.4 | 97.1 | 80.3 | 127.1 |
| BMI | 15.9 | 4.1 | 15.6 | 6.49 | 38.18 |
| Baseline height SDS | −3.94 | 1.21 | −3.56 | −7.5 | −2.2 |
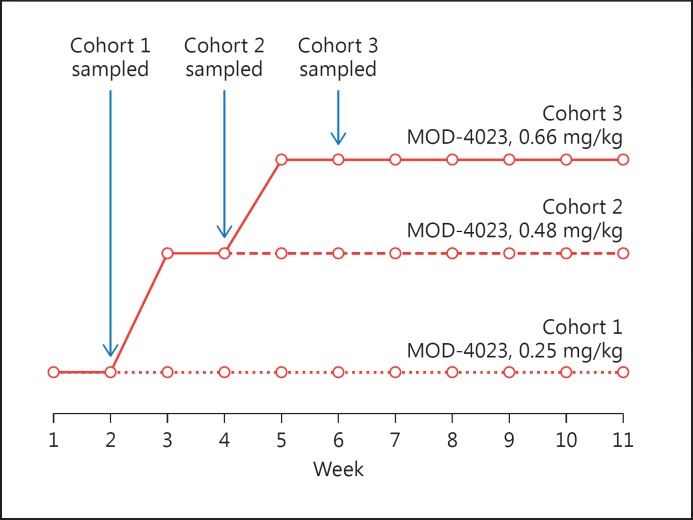
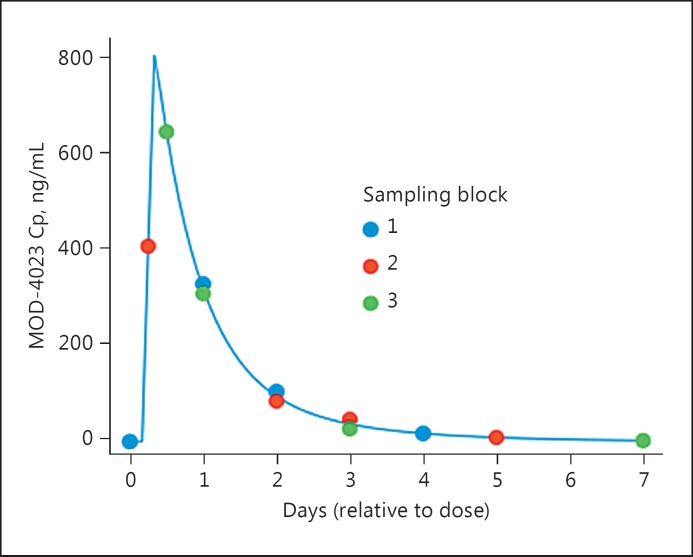
Subjects in cohorts 2 and 3 underwent dose escalation over 2 or 4 weeks, respectively (Fig. 1). Treatment continued for 12 months with periodic dose adjustments, as needed, based on the patients’ weight. To minimize the number of samples per subject, a sparse sampling regimen was used. For children dosed with MOD-4023, 4 samples (MOD-4023 and IGF-1) were obtained during the second steady-state dose (Fig. 2); additional samples were obtained intermittently through the remainder of treatment. For children dosed with r-hGH, 4 samples (r-hGH) were obtained over 24 h on day 14 of treatment. Informed consent was obtained in writing for all patients prior to study initiation. Ethics committees at all study sites reviewed and approved the study protocol.
Fig. 1.
Dose escalation regimen and sampling schedule for MOD-4023 in children. Circles indicate when doses were administered; arrows indicate when sampling occurred.
Fig. 2.
Sparse sampling regimen for MOD-4023 in children. The blue line is the MOD-4023 concentration profile for a typical subject. Circles indicate when during the dosing interval samples were obtained in each of the sampling blocks. Cp, serum concentration of MOD-4023.
MOD-4023, r-hGH, and IGF-1 Assays
MOD-4023 serum concentration was determined using an ELISA method; the lower limit of quantification was 0.15 ng/mL. r-hGH and IGF-1 serum concentration was determined using IDS-iSYS assays; the lower limit of quantification was 1.5 ng/mL for r-hGH and 10 ng/mL for IGF-1 (one sample was reported with an IGF-1 value of 5 ng/mL).
Pharmacokinetic and Pharmacodynamic Models
A 2-compartment linear time-invariant model was fit to the MOD-4023 concentrations; a 1-compartment model was appropriate for r-hGH. Absorption was assumed to be a first-order process with an absorption lag; bioavailability was permitted to vary between subjects. Systemic parameters of the model were clearance, distribution clearance, and distribution volumes, each normalized by bioavailability (parameters scaled by bioavailability are identified by the prefix “apparent”); parameters of the absorption model were absorption rate and absorption lag. Three approaches were used to evaluate whether body size affected the pharmacokinetic characteristics of MOD-4023 and r-hGH: no normalization for body size, scaling the systemic parameters by weight, and an allometric approach in which apparent clearances were scaled by weight raised to the 0.75 power and apparent distribution volumes were scaled by weight.
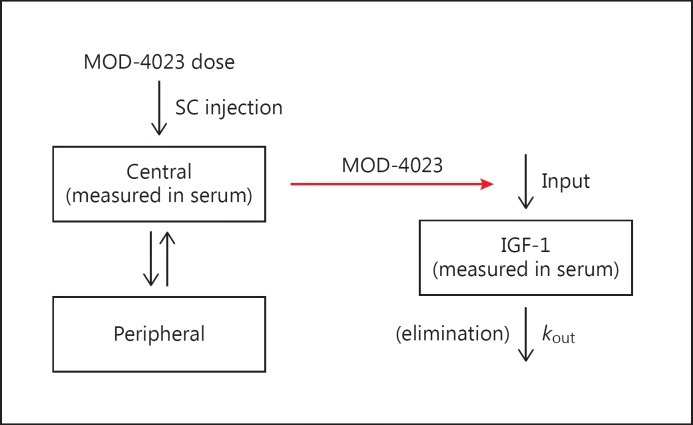
An indirect model (Fig. 3) proposed by Sun et al. [7] was fit to the IGF-1 data. IGF-1 values, rather than IGF-1 SDS values, were used in the analysis because IGF-1 SDS is a nonlinear transform of IGF-1. With this model, serum IGF-1 concentrations are a function of input and output (kout) rate constants. At steady state, input equals output. Output is the product of kout (the first-order rate constant for elimination of IGF-1) and IGF0 (the baseline value for IGF-1). Baseline input, therefore, equals kout × IGF0. Endogenous or exogenous GH increases input as a function of the GH concentration. Input, thus, is modeled as a sigmoid Emax equation:
where Cp is the serum concentration of MOD-4023, EC50 is the serum concentration of MOD-4023 producing half of the maximal increase in IGF-1 production, Emax is the maximal effect, and γ determines sigmoidicity (steepness) of the relationship.
Fig. 3.
Compartmental pharmacokinetic model for MOD-4023 (left) and indirect pharmacodynamic model for IGF-1 (right). In the pharmacokinetic model, MOD-4023 is administered subcutaneously and absorbed into the central compartment, then distributed to the peripheral compartment. In the pharmacodynamic model, the serum concentration of MOD-4023 affects the input the IGF-1 into the serum compartment; elimination of IGF-1 is a first-order process not affected by MOD-4023. SC, subcutaneous.
For both the pharmacokinetic and pharmacodynamic analyses, covariates (age, gender, hepatic and renal function, glomerular filtration rate estimated using the Schwartz equation [8]) were entered into the models if justified statistically (based on graphics and a reduction in the minimum value of the objective function). Analyses were performed employing mixed-effects (population) methods, using NONMEM software (Icon Development Solutions, Hanover, MD) and PLT Tools (PLTsoft, San Francisco, CA, USA).
Calculation of IGF-1 SDS
For certain analyses described below, IGF-1 values were transformed into SDS units (IGF-1 SDS) using tables provided by Bidlingmaier et al. [9]. Calculations were performed using the R language (r-project.org).
Simulations
To determine if MOD-4023 concentrations accumulated with weekly dosing, a simulation used the typical values for the population parameters. Graphics were prepared to examine for accumulation. To determine the relative time course of MOD-4023 and r-hGH, a simulation used the typical values for the population parameters for each entity. Graphics were prepared to compare the steady-state concentrations of each entity with MOD-4023 administered weekly and r-hGH administered daily.
Determining When to Sample to Estimate Mean and Peak IGF-1 SDS
Each subject's individual (post hoc) pharmacokinetic and pharmacodynamic parameters and their nominal dosing regimen were used to simulate the IGF-1 concentration profile at hourly intervals at steady state; IGF-1 SDS values were then calculated. For each subject, peak IGF-1 SDS was determined by examination of the profiles. Mean IGF-1 SDS was determined by averaging hourly values over the dosing interval. Graphics were prepared displaying individual peak and mean values against the values at each 24-h interval following administration of MOD-4023. The relationship between each of peak and mean values versus the value at each 24-h interval was determined by linear regression.
Results
Pharmacokinetics of MOD-4023
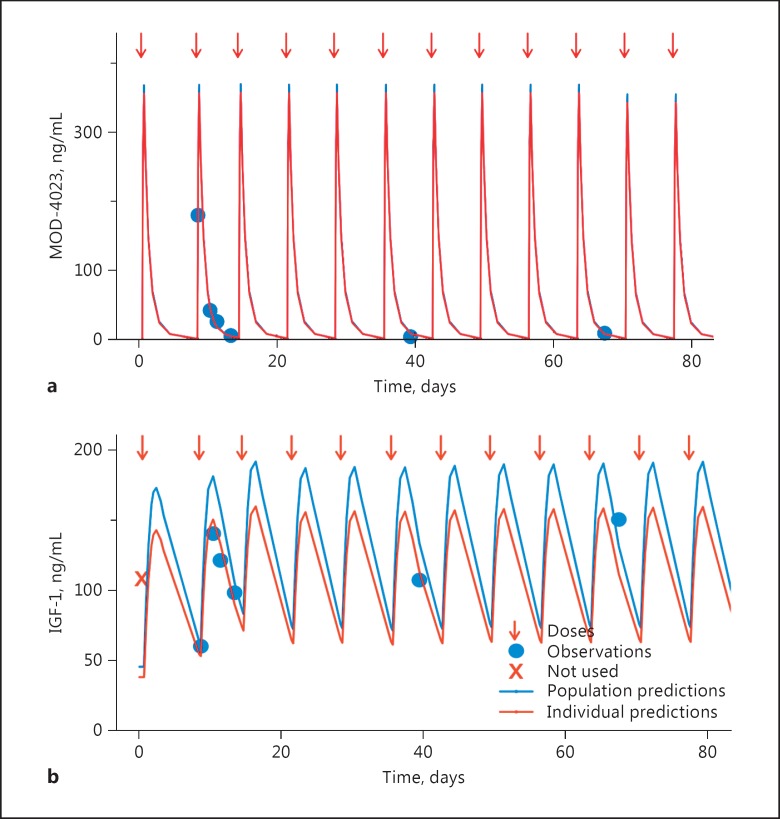
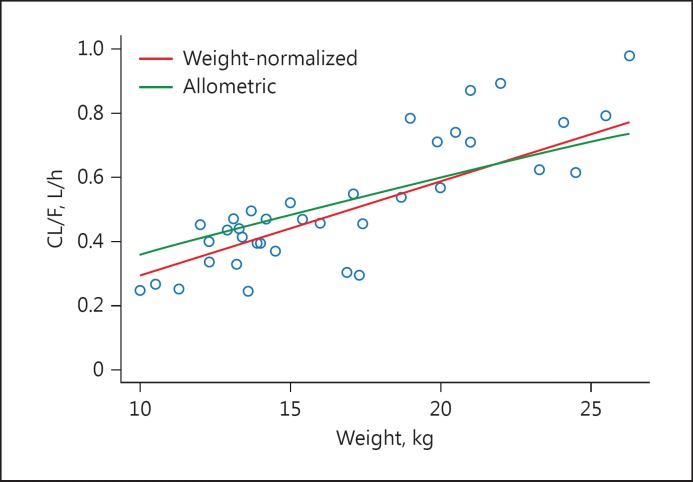
A 2-compartment pharmacokinetic model fit the MOD-4023 concentration profile data well: the relationship between observed and predicted concentrations was unbiased and variability was moderate (Fig. 4; online suppl. Fig. 1; see www.karger.com/doi/10.1159/000470842 for all online suppl. material). The weight-normalized model (Fig. 5) was preferred (as assessed by the objective function and graphics displaying individual parameters vs. weight) over the allometric-scaled model and the non-normalized model. There was no relationship between any of the covariates and any of the pharmacokinetic parameters. Parameters for the optimal model are displayed in Table 3.
Fig. 4.
Representative pharmacokinetic (a) and pharmacodynamic (b) fits in children. A child aged 9 years and weighing 24 kg was dosed at weekly intervals with 0.25 mg/kg MOD-4023. Doses are indicated with arrows. Measured MOD-4023 and IGF-1 concentrations are displayed as circles. The blue line displays the population fit of the model to the data. The red line (which in general overlies the blue line in the upper panel) displays the individual (post hoc) fit of the model to the data.
Fig. 5.
Values for apparent clearance (CL/F) for the weight-normalized and allometric models are displayed against weight. Circles represent post hoc estimates from the weight-normalized model (which were virtually identical to those from the allometric-scaled model). The lines represent the population values for apparent clearance over the range of weights. Based on the objective function from the 2 models, there was a slight preference for the weight-normalized approach.
Table 3.
Parameter estimates for the optimal pharmacokinetic model for MOD-4023 in GHD children
| Parameter | Estimate | Standard error | Interindividual variabilitya |
|---|---|---|---|
| Apparent clearance, L/h | 2.20077× (KG/77)b | 0.151755 | 0.3682c |
| Apparent central compartment volume, L | 53.3394× (KG/77)b | 5.69329 | 0.4998d |
| Apparent distribution clearance, L/h | 0.0830071× (KG/77)b | 0.0277278 | 0.3682c |
| Apparent peripheral compartment volume, L | 5.29237× (KG/77)b | 1.00201 | 0.4998d |
| Absorption rate, h−1 | 0.356689 | 0.195624 | –e |
| Absorption lag, h | 1.38494 | 0.203909 | –e |
Calculated as square root (omega2) where omega2 is the variance of the term quantifying interindividual variability; 68% of the population lies within this range of the typical value.
KG is weight in kg; 77 is applied to permit comparison of the parameter estimates to values from studies in adults.
The same term for interindividual variability was applied to apparent clearance and apparent distributional clearance.
The same term for interindividual variability was applied to the 2 apparent distribution volumes.
Interindividual variability was not permitted for this term in the optimal model.
Pharmacodynamics of MOD-4023
The indirect response model generally fit IGF-1 data well: the relationship between observed and predicted concentrations was unbiased and variability was moderate (online suppl. Fig. 2). The only covariate that was incorporated into the model was an increase in baseline IGF-1 as a function of age (Table 4): baseline IGF-1 increased by 21.8% per year, referenced to the value of age 6 years (which is the median age for these subjects).
Table 4.
Parameter estimates for the optimal pharmacodynamic model for IGF-1 in GHD children
| Parameter | Estimate | Interindividual variabilitya |
|---|---|---|
| Decay rate, h−1 | 0.0120121 | –b |
| Age factor | 1 + 0.21863 × (AGE – 6)c | –b |
| Baseline IGF-1, ng/mL | 12.2417 × age factor | 0.3844 |
| Emax | 22.6046 | –b |
| EC50, ng/mL | 109.809 | 0.3068 |
| Power term | 1.97888 | –b |
Calculated as square root (omega2) where omega2 is the variance of the term quantifying interindividual variability; 68% of the population lies within this range of the typical value.
Interindividual variability was not permitted for this term.
AGE is age in years; 6 is the median value.
Pharmacokinetics of r-hGH
A 1-compartment pharmacokinetic model fit the r-hGH concentration profiles without bias (not shown); variability was moderate to large. The weight-normalized model was preferred over the allometric-scaled model and the non-normalized model. There was no relationship between any of the covariates and any of the pharmacokinetic parameters. Parameters for the optimal model are displayed in Table 5.
Table 5.
Parameter estimates for the optimal pharmacokinetic model for r-hGH in GHD children
| Parameterc | Estimate | Interindividual variabilitya |
|---|---|---|
| Apparent clearance, L/h | 25.1748× KG/77b | 0.7209 |
| Apparent distribution volume, L | 40.0608× KG/77b | 1.179 |
| Absorption rate, h−1 | 0.202311 | 0.0044722823 |
| Absorption lag, h | 0.117979 | 0.4442 |
Calculated as square root (omega2) where omega2 is the variance of the term quantifying interindividual variability; 68% of the population lies within this range of the typical value.
KG is weight in kg; 77 is applied to permit comparison of the parameter estimates to values from studies in adults.
Interindividual variability was not permitted for this term in the optimal model.
Accumulation
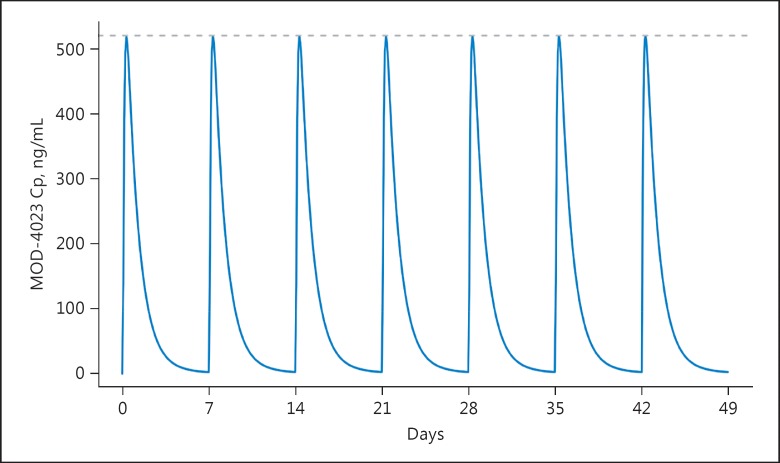
With weekly dosing, there was no accumulation of MOD-4023: steady-state conditions were attained by the second dose (Fig. 6).
Fig. 6.
A simulation based on the optimal model for MOD-4023 in children shows that steady-state conditions are reached by the second dose and that there is no accumulation (a thin dashed line is displayed at Cmax at steady state). The dose was 0.48 mg/kg. Cp, serum concentration of MOD-4023.
Comparison between the Pharmacokinetic Profiles of MOD-4023 and r-hGH
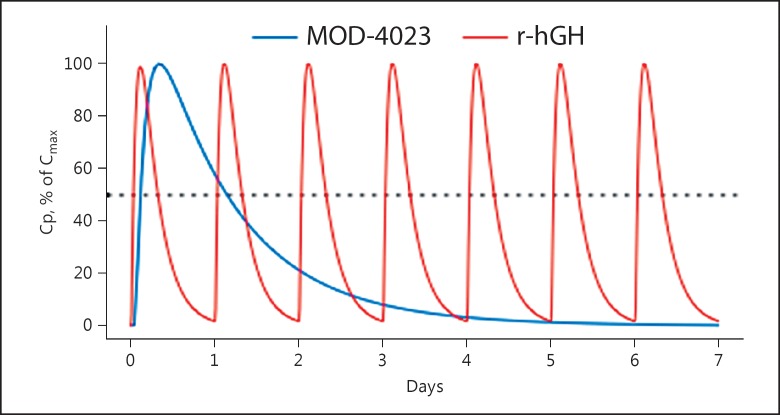
Following each dose of r-hGH, concentrations decreased to one-half of the peak value at 8.1 h, whereas MOD-4023 concentrations decreased to one-half of the peak at 27.4 h (Fig. 7).
Fig. 7.
A simulation based on the optimal models for MOD-4023 and r-hGH shows that residence time for MOD-4023 is markedly longer than that for r-hGH. Cp, serum concentration of MOD-4023.
Determining When to Sample to Estimate Mean and Peak IGF-1 SDS
Peak IGF-1 SDS
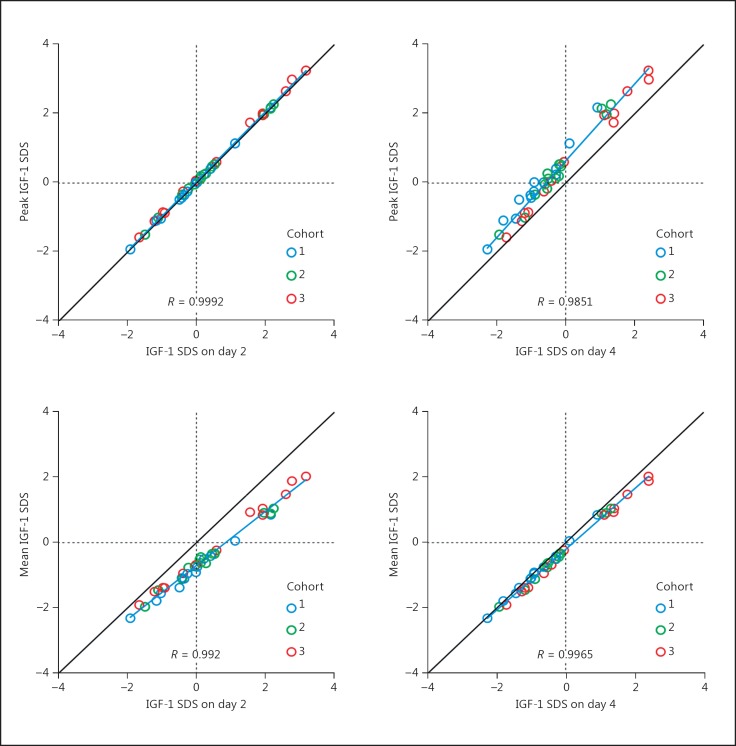
Samples obtained on day 2 (48 h following dose administration) predicted peak IGF-1 SDS well (Fig. 8): correlation was high (r > 0.99) and deviation from the line of unity was minimal. Values obtained on all other days (day 4 displayed) underestimated peak IGF-1 SDS.
Fig. 8.
Peak (top panels) and mean (bottom panels) IGF-1 SDS for each subject is plotted against the value at day 2 (left) or day 4 (right). All values are obtained from a simulation based on the optimal model. Colors distinguish cohorts. The line of identity (in black, at 45°), a regression line (blue), and the correlation coefficient are shown. Vertical and horizontal dotted lines appear at 0 SDS units.
Mean IGF-1 SDS
Samples obtained on day 4 (96 h following dose administration) predicted mean IGF-1 SDS well: correlation was high (r > 0.99) and deviation from the line of unity was minimal. Values obtained on days 2 and 3 overestimated mean IGF-1 SDS, whereas those obtained on days 6 and 7 underestimated mean IGF-1 SDS.
For both peak and mean IGF-1 SDS, there was a strong linear relationship with the value on any day; r, intercept, slope, and residual standard error for those relationships are displayed in Table 6. The relationship between each of peak and mean IGF-1 SDS values to values on any sampling day did not differ between cohorts.
Table 6.
The relationship (r, intercept, slope, and standard error of the estimate of a linear regression) between each of peak and mean IGF-1 SDS and the value obtained at day 0–7 is shown
| Day | Peak |
Mean |
||||||
|---|---|---|---|---|---|---|---|---|
| r | intercept | slope | residual SE | r | intercept | slope | residual SE | |
| 0a | 0.975 | 2.731 | 1.623 | 0.296 | 0.992 | 1.559 | 1.367 | 0.142 |
| 1 | 0.995 | 0.577 | 1.147 | 0.135 | 0.984 | −0.261 | 0.940 | 0.196 |
| 2 | 0.999 | 0.048 | 1.006 | 0.053 | 0.992 | −0.695 | 0.827 | 0.139 |
| 3 | 0.994 | 0.189 | 1.014 | 0.149 | 0.999 | −0.581 | 0.844 | 0.053 |
| 4 | 0.985 | 0.642 | 1.110 | 0.227 | 0.997 | −0.203 | 0.930 | 0.091 |
| 5 | 0.981 | 1.238 | 1.252 | 0.256 | 0.995 | 0.299 | 1.051 | 0.107 |
| 6 | 0.978 | 1.933 | 1.421 | 0.277 | 0.994 | 0.886 | 1.196 | 0.123 |
| 7a | 0.973 | 2.722 | 1.615 | 0.306 | 0.991 | 1.553 | 1.362 | 0.150 |
Values at day 0 and day 7 are nearly identical because they represent the same point in the dosing interval.
Discussion
We obtained extensive data in adults, which were then used to develop pharmacokinetic and pharmacodynamic models for MOD-4023 and IGF-1. These models (not shown) generally fit the data well and enabled us to conduct studies in children in which we used a sparse sampling regimen. As in adults, a linear pharmacokinetic model with first-order absorption fit the MOD-4023 concentration data well. Systemic pharmacokinetic parameters varied with weight, showing a slightly better fit with weight normalization compared to allometric scaling. This suggests that a weight-normalized dosing regimen, as was used in the present study, should yield comparable systemic exposures (area under the MOD-4023 vs. time curve) over a range of weights. None of the other covariates examined, including hepatic and renal function, influenced systemic exposure to MOD-4023. The lack of impact of hepatic and renal function should be considered with caution because children in this study had normal hepatic and renal function.
The indirect response model generally fit the IGF-1 data well. In clinical practice, IGF-1 values are typically converted to SDS units for clinical decision-making. Titrating GH dosage based on serum IGF-1 concentrations is the standard procedure in treatment of adult GHD. In children, IGF-1 concentrations can be employed to assure that the GH dose is adequate while maintaining serum levels within the broad normal range throughout the dosing interval [1]. If IGF-1 SDS values are extremely low, the GH dose may be increased, especially if the child's growth response is inadequate. Conversely, a very high value of IGF-1 SDS might justify decreasing the GH dose.
In the optimal pharmacodynamic model, baseline IGF-1 SDS increased over time, a finding that has been reported previously [10]. This age-related change limits the utility of raw IGF-1 values as a clinical marker of efficacy; instead, values are typically converted to standardized (SDS) units [9].
A novel aspect of the present analysis was our estimation of the peak and mean IGF-1 SDS during the dosing interval based on values simulated at daily intervals. Mean IGF-1 SDS reflects the overall systemic exposure to IGF-1 SDS, presumably a biomarker for the effects of exogenous GH. In contrast, peak IGF-1 SDS is considered to be a biomarker for safety: persistent values >2 SDS units might trigger dose reduction. Thus, information about IGF-1 SDS is considered to be important in the clinical practice of treating GH deficiency. The development of long-acting products adds complexity to this clinical practice: during a weekly dosing interval, IGF-1 (and the corresponding IGF-1 SDS values) will increase and then decrease. In addition, children will be available for clinic visits and blood sampling at different time points in the dosing interval. Thus, it is important to understand the relationship between values measured at different time points during the dosing interval and each of the mean and peak values. The strong linear relationships documented in Table 6 demonstrate that samples obtained at varying times following dose administration can be used to estimate mean and peak IGF-1 SDS, thereby guiding clinical practice.
Based on the current analysis, our pharmacokinetic and pharmacodynamic models can assist in safety monitoring and guide dose modifications. These models may be used to support dose selection and dose modification in future clinical studies, as they provide a convenient methodology to determine both peak and mean IGF-1 concentrations.
Disclosure Statement
D.M.F. and R.G.R. are paid consultants to OPKO. M.J.-M., L.A., R.K., and G.H. are OPKO employees.
Supplementary Material
Supplementary data
Supplementary data
Supplementary data
Acknowledgement
This research did not receive any specific grants.
References
- 1.Christiansen JS, Backeljauw PF, Bidlingmaier M, Biller BM, Boguszewski MC, Casanueva FF, Chanson P, Chatelain P, Choong CS, Clemmons DR, Cohen LE, Cohen P, Frystyk J, Grimberg A, Hasegawa Y, Haymond MW, Ho K, Hoffman AR, Holly JM, Horikawa R, Höybye C, Jorgensen JO, Johannsson G, Juul A, Katznelson L, Kopchick JJ, Lee KO, Lee KW, Luo X, Melmed S, Miller BS, Misra M, Popovic V, Rosenfeld RG, Ross J, Ross RJ, Saenger P, Strasburger CJ, Thorner MO, Werner H, Yuen K. Growth Hormone Research Society perspective on the development of long-acting growth hormone preparations. Eur J Endocrinol. 2016;174:C1–C8. doi: 10.1530/EJE-16-0111. [DOI] [PMC free article] [PubMed] [Google Scholar]
- 2.Haverkamp F, Johansson L, Dumas H, Langham S, Tauber M, Veimo D, Chiarelli F. Observations of nonadherence to recombinant human growth hormone therapy in clinical practice. Clin Ther. 2008;30:307–316. doi: 10.1016/j.clinthera.2008.02.017. [DOI] [PubMed] [Google Scholar]
- 3.Hershkovitz O, Bar-Ilan A, Guy R, Felikman Y, Moschcovich L, Hwa V, Rosenfeld RG, Fima E, Hart G. In vitro and in vivo characterization of MOD-4023, a long-acting carboxy-terminal peptide (CTP)-modified human growth hormone. Mol Pharm. 2016;13:631–639. doi: 10.1021/acs.molpharmaceut.5b00868. [DOI] [PubMed] [Google Scholar]
- 4.Strasburger CJ, Vanuga P, Payer J, Pfeifer M, Popović V, Bajnok L, Góth MI, Olšovská V, Trejbalová L, Vadasz J, Fima E, Koren R, Amitzi L, Bidlingmaier M, Hershkovitz O, Hart G, Biller BMK. MOD-4023, a long-acting carboxy-terminal peptide-modified human growth hormone: results of a phase 2 study in growth hormone-deficient adults. Eur J Endocrinol. 2017;176:283–294. doi: 10.1530/EJE-16-0748. [DOI] [PMC free article] [PubMed] [Google Scholar]
- 5.Zelinska N, Iotova V, Skorodok J, Malievsky O, Peterkova V, Samsonova L, Rosenfeld RG, Zadik Z, Jaron-Mendelson M, Koren R, Amitzi L, Raduk D, Hershkovitz O, Hart G. Long-acting C-terminal peptide-modified hGH (MOD-4023): results of a safety and dose-finding study in GHD children. J Clin Endocrinol Metab. 2017;102:1–10. doi: 10.1210/jc.2016-3547. [DOI] [PubMed] [Google Scholar]
- 6.GH Research Society Consensus guidelines for the diagnosis and treatment of growth hormone (GH) deficiency in childhood and adolescence: summary statement of the GH Research Society. J Clin Endocrinol Metab. 2000;85:3990–3993. doi: 10.1210/jcem.85.11.6984. [DOI] [PubMed] [Google Scholar]
- 7.Sun YN, Lee HJ, Almon RR, Jusko WJ. A pharmacokinetic/pharmacodynamic model for recombinant human growth hormone effects on induction of insulin-like growth factor I in monkeys. J Pharmacol Exp Ther. 1999;289:1523–1532. [PubMed] [Google Scholar]
- 8.Schwartz GJ, Haycock GB, Edelmann CM, Jr, Spitzer A. A simple estimate of glomerular filtration rate in children derived from body length and plasma creatinine. Pediatrics. 1976;58:259–263. [PubMed] [Google Scholar]
- 9.Bidlingmaier M, Friedrich N, Emeny RT, Spranger J, Wolthers OD, Roswall J, Körner A, Obermayer-Pietsch B, Hübener C, Dahlgren J, Frystyk J, Pfeiffer AF, Doering A, Bielohuby M, Wallaschofski H, Arafat AM. Reference intervals for insulin-like growth factor-1 (IGF-1) from birth to senescence: results from a multicenter study using a new automated chemiluminescence IGF-1 immunoassay conforming to recent international recommendations. J Clin Endocrinol Metab. 2014;99:1712–1721. doi: 10.1210/jc.2013-3059. [DOI] [PubMed] [Google Scholar]
- 10.Elmlinger MW, Kühnel W, Weber MM, Ranke MB. Reference ranges for two automated chemiluminescent assays for serum insulin-like growth factor I (IGF-I) and IGF-binding protein 3 (IGFBP-3) Clin Chem Lab Med. 2004;42:654–664. doi: 10.1515/CCLM.2004.112. [DOI] [PubMed] [Google Scholar]
Associated Data
This section collects any data citations, data availability statements, or supplementary materials included in this article.
Supplementary Materials
Supplementary data
Supplementary data
Supplementary data


