

SUMMARY
T cell receptor (TCR) signaling without CD28 can elicit primary effector T cells, but memory T cells generated during this process are anergic, failing to respond to secondary antigen exposure. We show that upon T cell activation, CD28 transiently promotes expression of carnitine palmitoyltransferase 1a (Cpt1a), an enzyme that facilitates mitochondrial FAO, before the first cell division, coinciding with mitochondrial elongation and enhanced spare respiratory capacity (SRC). microRNA-33 (miR33), a target of thioredoxin-interacting protein (TXNIP), attenuates Cpt1a expression in the absence of CD28, resulting in cells that thereafter are metabolically compromised during reactivation or periods of increased bioenergetic demand. Early CD28-dependent mitochondrial engagement is needed for T cells to remodel cristae, develop SRC, and rapidly produce cytokines upon restimulation – cardinal features of protective memory T cells. Our data show that initial CD28 signals during T cell activation prime mitochondria with latent metabolic capacity essential for future T cell responses.
eTOC
Costimulatory signals during the initial phase of T cell activation prime mitochondria with latent metabolic capacity essential for future T cell responses.
INTRODUCTION
CD28 is the receptor for B7 molecules (CD80 and CD86), which are expressed on activated antigen presenting cells, and provide essential signals for full T cell activation. Over the years it has become clear that CD28 signals do not act solely to amplify TCR, but control a wide range of processes, including the cell cycle, epigenetic modifications, metabolism, and post-translational modifications (Esensten et al., 2016). Nevertheless, a complete understanding of the biology of CD28 is lacking. Since CD28 and its family members are targets of current and developing immunotherapies, understanding how these accessory receptors regulate T cell function is of broad interest and clinical importance (Esensten et al., 2016).
A prevailing model in immunology is that CD28 promotes the glycolytic flux needed for full effector T (TE) cell activation, differentiation, and proliferation (Frauwirth et al., 2002; Jacobs et al., 2008; MacIver et al., 2013). However, in vivo, T cells do not always require this initial CD28 costimulation to mount primary responses or to form long-lasting antigen-specific T cells, but need it specifically to develop into protective memory (TM) cells, which ‘remember’ past infections and respond robustly to secondary antigen challenge (Borowski et al., 2007; Kundig et al., 1996; Mittrücker et al., 2001; Villegas et al., 1999). How initial CD28 signals contribute to the generation of protective TM cells remains unclear. We have shown that long-lived memory T (TM) cells utilize FAO and maintain fused mitochondria with tight cristae and SRC (Buck et al., 2016; van der Windt et al., 2012), the reserve energy generating capacity in the mitochondria beyond the basal state. This metabolic phenotype facilitates their rapid recall function (van der Windt et al., 2013). We therefore speculated that CD28 primes mitochondria during the initial phase of T cell activation with the metabolic capacity important for future recall of TM cells.
RESULTS
CD28 Costimulation Endows T Cells with Latent Mitochondrial Respiratory Capacity
We activated CD8+ TN cells with αCD3 in the presence (+) or absence (−) of αCD28 (Figure 1A) and 8 hours later exposed them to oligomycin, an ATP synthase inhibitor, and FCCP, a protonophore that dissipates the mitochondrial H+ gradient and uncouples oxygen consumption from ATP production. FCCP reveals the maximal respiratory capacity as cells consume oxygen (measured as oxygen consumption rate, OCR) in an attempt to re-establish the H+ gradient. Cells primed (+) αCD28 had an increased extracellular acidification rate (ECAR, indicates aerobic glycolysis) after oligomycin (indicating their glycolytic reserve, GR) (Figure 1A), and increased uptake of 2-NBDG (Figure S1A), highlighting enhanced glycolysis in cells primed (+) αCD28 (Frauwirth et al., 2002; Jacobs et al., 2008; MacIver et al., 2013). However, CD28 signals also endowed cells with significant SRC, measured as the difference between basal OCR (indicates oxidative phosphorylation, OXPHOS) and maximal OCR after FCCP (Figures 1A and S1B). This early SRC was absent in T cells primed (−) αCD28, indicating that mitochondria in these cells were operating close to their bioenergetic limit. In keeping with similar basal OCR 8 hours after activation (Figure S1B) these cells had equal ATP levels in the basal state (Figure S1C).
Figure 1. CD28 costimulation endows T cells with latent mitochondrial respiratory capacity.

(See also Figure S1) Naïve CD8+ T cells were activated with bead- or plate-bound αCD3 (5 μg/ml), IL-2 (100U/ml), and ± soluble αCD28 (0.5 μg/ml). A) Extracellular acidification rate (ECAR) and oxygen consumption rate (OCR) were measured for 8 hr after activation with αCD3 beads in a Seahorse extracellular flux analyzer (EFA). Glycolytic reserve (GR) and spare respiratory capacity (SRC), after oligomycin (Oligo) and FCCP respectively, were quantified. B) 3 days after activation, cells were switched to IL-15 for 3 days to generate TM cells and SRC was assessed [calculated as (OCR after FCCP – basal OCR) /basal OCR x 100%]. C) CD8+ TM cells (CD44hi/CD62Lhi) were sorted from spleens and lymph nodes of 15 week old uninfected age and sex-matched WT and CD80/86−/− mice. OCR was assayed after consecutive injections of oligo, FCCP, and rotenone and antimycin (R+A). Graphs represented as mean ± SEM of three biological replicates. D) SRC of the graphs in panel c. was calculated. E) IL-15 TM cells generated as in B were restimulated with αCD3/28 beads and IL-2. OCR was followed for 8 hours and maximal respiration was assessed by sequential treatment with oligo, FCCP, and R+A. F) IL-15 TM cells were restimulated and intracellular IFN-γ was assessed by flow cytometry (% IFN-γ+ CD8+ T cells and MFI of IFN-γ is shown). G) TE cells were switched to 10 mM (upper panels) or 0.3 mM glucose (acute glucose restriction, AGR) overnight (lower panels). Baseline ECAR was determined and the maximal respiration rate was measured after FCCP. H) SRC was determined as in panel A. Data shown as mean ±SEM, representative of ≥ 3 separate experiments. Statistical comparisons for two groups were calculated by using unpaired two-tailed Student’s t-test, * p < 0.05; ** < 0.01; *** < 0.001.
We assessed T cells differentiated toward the TM phenotype in IL-15 (IL-15 TM) (Figure 1B) and found that IL-15 TM cells primed (+) αCD28 had significant SRC, while the lack of SRC evident 8 hours after activation (Figures 1A and S1B) persisted in cells primed (−) αCD28 (Figure 1B), despite normal TM cell marker expression and survival (Figure S1D–E). Ex vivo TM cells from uninfected CD80/86−/−mice, which lack these ligands for CD28 and thus provide a costimulation-deficient environment, also displayed decreased SRC (Figure 1C, D). Furthermore, restimulated TM cells derived from TN cells primed (+) αCD28 increased OCR and exhibited marked SRC (≈200% of basal OCR) (Figure 1E) and GR (Figure S1F). However, IL-15 TM cells primed (−) αCD28 had diminished basal OCR that did not rise upon restimulation, and had neither SRC (Figure 1E) nor GR (Figure S1F). IFN-γ production in TM cells primed (−)αCD28 was also reduced (Figure 1F). Together these data indicate that TM cells generated without costimulation are metabolically and functionally impaired.
Initial CD28 signals imparted long-lasting mitochondrial SRC, and we questioned whether this could be detected in CD8+ TE cells (IL-2 TE), which do not require OXPHOS for energy if sufficient glucose and IL-2 are present for aerobic glycolysis (Chang et al., 2015; Sena et al., 2012). IL-2 TE cells primed ± αCD28 had no differences in basal ECAR or OCR (before or after FCCP), when in 10mM glucose (Figure 1G). When cells were forced to use mitochondrial-derived ATP by acute glucose-restriction (AGR), ECAR was diminished equivalently in cells generated ± αCD28 (Figure 1G). However, IL-2 TE primed (−)αCD28 cells placed under AGR failed to enhance OCR after oligomycin/FCCP (Figures 1G and S1G), revealing their lack of SRC (Figures 1H and S1H). Survival of the cells under AGR was unaffected at this timepoint (Figure S1I). SRC became evident in IL-2 TE cells primed (+)αCD28 under AGR (Figure 1G–H), indicating that CD28 signals during activation endow T cells with latent SRC. Increased TCR signal strength could not compensate for the absence of CD28 costimulation during activation, nor was TCR expression altered, but increased αCD28 promoted SRC further dose dependently 8 hours after activation (Figure S1J–L).
CD28 Costimulation Transiently Limits Mitochondrial Sphericity Early After T Cell Activation and During Metabolic Stress
We have previously shown that mitochondrial morphology influences T cell metabolism (Buck et al., 2016). We therefore analyzed mitochondrial shape in T cells at different times after activation ± αCD28. T cells primed (+) αCD28 displayed elongated mitochondria early after activation (Buck et al., 2016; Ron-Harel et al., 2016), whereas T cells primed (−) αCD28 had more spherical mitochondria (Figures 2A and S2A–B). Spherical mitochondria are associated with rapidly dividing glycolytic T cells (Buck et al., 2016), a phenotype observed in mature IL-2 TE cells primed ± αCD28 (Figures 2A and S2B). IL-15 TM cells primed (+) αCD28 contained tubulated mitochondria, while cells primed (−) αCD28 appeared less tubulated (Figure 2A). Unlike IL-2 TE cells primed (+) CD28, mitochondria in cells initially primed (−) αCD28 appeared less elongated in response to AGR (Figure 2B), correlating with their lack of SRC (Figure 1H). Therefore, CD28 signals during activation affect mitochondrial morphology in T cells.
Figure 2. CD28 costimulation regulates mitochondrial sphericity and cristae morphology in T cells.

(See also Figure S2) A) Mitochondrial morphology in PhAM CD8+ T cells over time after αCD3/±CD28 activation and differential cytokine culture. Mitochondria are green (GFP) and nuclei are blue (Hoechst). Scale bar = 5 μm. Histograms depict sphericity of the mitochondria as determined by Imaris software (see Figure S2A–B) B) Confocal images of PhAM CD8+ TE cells cultured in 0.3 mM Glc overnight. C) Electron microscopy (EM) analysis of cells cultured as in A and B. Scale bar = 200nm. D) Cristae width over time after activation. Bar graph depicts mean ± SEM of maximum cristae width in arbitrary units, measured from 15 images from each group using Fiji/Image J software. Statistical comparisons for two groups were calculated by using unpaired two-tailed Student’s t-test, *** p < 0.0001; * p < 0.05. E) Cristae width assessed as in D from in vitro cultured and ex vivo isolated TN, TE and TM cells.
Mitochondrial Cristae Loosening in T Cells Is Accelerated in the Absence of CD28 Costimulation
Nutrient availability modulates mitochondrial remodelling (Rambold et al., 2015; Senyilmaz et al., 2015). It has been shown that tight cristae support efficient OXPHOS (Cogliati et al., 2013) and loose cristae facilitate aerobic glycolysis in T cells (Buck et al., 2016). We found that T cells primed (−) αCD28 had significantly looser cristae 8 hours after activation, a phenotype propagated through IL-15 TM cell development (Figures 2C–D and S2C), and also evident in TE cells under AGR (Figure 2C–D), consistent with their inability to invoke efficient OXPHOS when required (Figure 1G–H). These data suggested that CD28 costimulation restrained cristae loosening after TCR activation, and that this early CD28 signal conferred the ability to maintain, or revert, to this morphological state throughout the life of the cells (Figure 2D). TN cells, and in vitro and in vivo generated TM cells, had tighter cristae than their TE cell counterparts (Figure 2E). Together these data suggest cristae loosening is accelerated in T cells activated (−) CD28 and that they are never able to properly retighten their cristae after initial priming, a process that is important for TM cells. This early morphological change correlates with their persistent lack of SRC.
CD28-mediated SRC and IL-15 TM Cell Cytokine Production is Inhibited by ETO or Cpt1a Knockdown
FAO and SRC are important for long-lived TM cells (Pearce et al., 2009; van der Windt et al., 2012). To determine whether CD28 influences FAO early after activation, we measured SRC in T cells primed with ± αCD28 in the presence of (+) etomoxir (ETO), an irreversible inhibitor of Cpt1a, the rate-limiting enzyme for mitochondrial β-oxidation (Lopaschuk et al., 1988). ETO abrogated CD28-induced SRC (Figure 3A), suggesting that CD28 promoted Cpt1a function early after activation to support SRC, a result we confirmed genetically by introducing Cpt1a siRNA into TN cells to knockdown this protein prior to activation (Figure S3A–B). To assess whether CD28-mediated FAO was influenced by altered fatty acid uptake we cultured T cells primed ± CD28 with bodipy-labeled palmitate and found no difference in acquisition 8 or 24 hours later (Figure S3C). IL-15 TM cells that were originally derived from a TE cell population primed (+) ETO, but subsequently cultured without ETO, showed impaired SRC, and injection of ETO onto control IL-15 TM cells reduced maximal OCR after FCCP to the level observed in cells activated (−) αCD28 or (+) ETO (Figure 3B). We also found that the decreased SRC in ex vivo TM cells isolated from CD80/86−/− mice was less sensitive to ETO when compared to WT TM cells, suggesting their reduced FAO (Figure S3D). Cells primed (+) αCD28 and (+) ETO did not robustly produce IFN-γ upon restimulation (Figure 3C), similar to that observed in IL-15 TM cells initially primed (−) αCD28 (Figure 1F). We confirmed this result genetically by transducing TN cells prior to activation with Cpt1a-shRNA (sh) and then differentiating them toward the TM phenotype. Upon restimulation, the cells that expressed Cpt1a-sh during priming produced less IFN-γ later (Figure S3E–F), consistent with their inability to form robust TM cells.
Figure 3. CD28-mediated SRC and mitochondrial remodeling during metabolic stress is dependent on Cpt1a function.

(See also Figures S3 and S4) Naïve CD8+ T cells were activated with bead- or plate-bound αCD3, IL-2, soluble αCD28, and ± 200 μM etomoxir (ETO). A) OCR was measured for 8 hours after activation with αCD3 beads. SRC after FCCP was quantified. B) Cells were primed for 48 hours as in A, 3 days after activation cells were switched to IL-15 for 3 days to generate TM cells and SRC was assessed. C) IL- 15 TM cells were restimulated and intracellular IFN-γ was assessed by flow cytometry. IFN-γ+ CD8+ T cells and MFI of IFN-γ is shown (control is the same plot at in Figures 1F–D) Confocal images of PhAM CD8+ T cells, activated with αCD3/28 ± 200 μM etomoxir, 8 hours after activation, TE cultured in AGR conditions overnight, and differentiated towards the TM phenotype. Scale bar = 2 μm. E) EM analysis of cells cultured as in A and B. Scale bar is 200nm. F) Cristae width over time after activation, αCD3/28 control measurements from Figure 2D. Bar graph depicts mean ± SEM of maximum cristae width in arbitrary units, measured from 15 images from each group using Fiji/Image J software.
CD28-mediated Mitochondrial Remodeling Is Inhibited By Etomoxir
ETO treatment during the first 48 hours after activation also affected CD28-mediated mitochondrial remodeling in cells 8 hours later, in IL-2 TE cells after AGR, and in cells cultured toward the TM phenotype as mitochondria looked more punctate in these groups compared to controls (Figure 3D). Cristae in T cells treated (+) ETO during priming were similar to those activated (−) αCD28, such that 8 hours after activation, AGR, and IL-15 TM cell differentiation, cristae were significantly wider than in control cells (Figures 3E–F and S3G). These data imply that CD28 signals engage FAO early after initial priming, and that cristae are remodeled during this process.
Given that Opa1 is important for TM cell formation (Buck et al., 2016), we assessed whether enhanced Opa1 expression could compensate for the loss of CD28 costimulation. We primed T cells from OPA1-transgenic (OPA1TG) mice, which express roughly 1.5–2.0-fold more OPA1 than wild type cells (Cogliati et al., 2013), ±CD28 and then measured cristae width 8 hours later. While the OPA1TG cells had tighter cristae than those in WT cells when activated (+) CD28, activation (−) CD28 still led to reduced cristae tightness, independent of the presence of more OPA1 (Figure S3H). These observations suggest that although OPA1 overexpression enhances cristae tightness in T cells after activation, this alone is not sufficient to compensate for signals mediated by CD28.
To further assess metabolism in T cells primed ±CD28 we cultured cells with 13C-glucose, 13C-glutamine, and 13C-palmitate and traced carbons from these substrates into metabolites (Figure S4). We found that carbons from glucose and glutamine were equally incorporated into the metabolites measured between cells primed ± CD28 or ± ETO, with the exception that there was slightly increased glucose-derived carbon in palmitate in cells primed (+) αCD28 (Figure S4A–B). The only significant difference we observed was enhanced incorporation of palmitate carbon into fumarate, indicating greater incorporation of palmitate into TCA cycle intermediates, which was generally supported by elevated incorporation into glutamate and malate, in cells primed (+) CD28 (Figure S4C–D). Cells primed (+) ETO showed a reduction of palmitate-derived carbon, but not of glucose- or glutamine-derived carbon, in TCA cycle intermediates, similar to cells (−) CD28. These data indicate that in this context ETO inhibits mitochondrial FAO in T cells, while not affecting utilization of other OXPHOS substrates. Overall, these findings are consistent with altered fatty acid metabolism as a result of CD28 costimulation in these cells.
T Cells Primed without CD28 Costimulation, or in the Presence of ETO, Fail to Provide Protective Immunity Against Tumor Challenge in vivo
Lack of CD28 costimulation during activation generates anergic TM cells that cannot respond to further antigen challenge in vivo (Borowski et al., 2007; Esensten et al., 2016; Mittrücker et al., 2001; Villegas et al., 1999). We investigated whether CD28-mediated mitochondrial changes that facilitate FAO were also important for efficient recall responses in vivo. Ovalbumin (OVA) specific OT-I+ T cells were activated with αCD3 ± αCD28 and ± ETO for 48 hours, expanded for a further 24 hours in medium containing only IL-2, and then adoptively transferred into mice bearing OVA-expressing EL4 (EL4-OVA) tumors (Figure 4). 5/5 mice that received no OT-I+ T cells did not control tumor growth and were sacrificed 15 days after tumor implantation, while 6/6 mice that received αCD3/28 activated OT-I+ T cells cleared tumors within 12 days (Figure 4). 4/5 mice that received OT-I+ T cells that were primed (−) αCD28 (i.e. αCD3 only), and 5/5 mice that received OT-I+ T cells activated with αCD3/CD28 (+) ETO initially controlled tumor burden, indicating the development of a primary TE response. However, these cells were unable to control tumor regrowth weeks later, suggesting a lack of protective TM cells with the capacity to eradicate the cancer and provide long-lasting immunity (Figure 4). OT-I+ donor T cells in mice persisted in similar frequencies in all 3 groups in the weeks following adoptive transfer (Figure 4), indicating that the inability to control tumors was not due to a lack of survival of the cells primed (−) αCD28 or (+) ETO, but rather stemmed from a defect in their functional capacity. Together these data suggest that CD28 provides an early signal to enhance Cpt1a function and build SRC in the mitochondria at the time of TCR activation, and that this regulates the ability of the ensuing TM population to function appropriately and provide protective immunity against tumor challenge.
Figure 4. T Cells Primed without CD28 Costimulation, or in the Presence of ETO, Fail to Provide Protective Immunity Against Tumor Challenge in vivo.

CD28-mediated formation of long lasting immune protection is inhibited by etomoxir
(See also Figures S3 and S4) C57Bl/6 mice were inoculated s.c. with 106 EL4-OVA cells. After 5 days, 5 × 10⁶ congenically marked OT-I TE cells initially primed with αCD3/± αCD28/± ETO (left panel) were transferred i.v. into recipients and tumor growth was assessed (middle panel). Circulating Kb/OVA-specific donor cells (Tet+) assessed by flow cytometry (right panel). Shown as mean ± SEM (n=5–6/group). Statistical comparisons for two groups were calculated by using unpaired two-tailed Student’s t-test, *** p < 0.0001; ** p< 0,01; * p < 0.05.
microRNA-33 (miR33), a target of thioredoxin-interacting protein (TXNIP), attenuates Cpt1a expression in the absence of CD28
To investigate how CD28 might modulate Cpt1a function, we analyzed published mRNA expression data of CD4+ T cells stimulated with αCD3 ± CD28 (Martinez-Llordella et al., 2013). In the top 100 differentially regulated genes, many were related to mitochondrial metabolism, including thioredoxin-interacting protein (TXNIP), which was in the top 10 genes regulated by CD28 (Figure S5A). Previous studies have described a role for TXNIP in mitochondrial metabolism (Chen et al., 2016; DeBalsi et al., 2014; Zhou et al., 2010) and in the regulation of miR33, a microRNA linked to the suppression of FAO (Ouimet et al.; Rayner et al.; Zhou et al., 2010). Cpt1a is known a target of miR33 (Dávalos et al., 2011), which hinted at a possible regulatory axis of CD28-TXNIP-miR33-Cpt1a.
We found that TXNIP protein was modestly decreased in T cells primed (+) αCD28, which coincided with increased Cpt1a protein 24 hours after activation (Figure 5A–C). This difference was no longer evident 48 hours after activation (Figure S5B), suggesting that the transient induction of Cpt1a protein, and associated increase in SRC (Figure 1A), occurs only during the priming phase. TXNIP protein was also slightly decreased in human T cells primed (+) αCD28, which also coincided with increased CPT1A protein 24 hours after activation (Figures 5D–E and S5C–E).
Figure 5. The thioredoxin-interacting protein (TXNIP) target microRNA-33 (miR33) attenuates Cpt1a expression in the absence of CD28 costimulation.

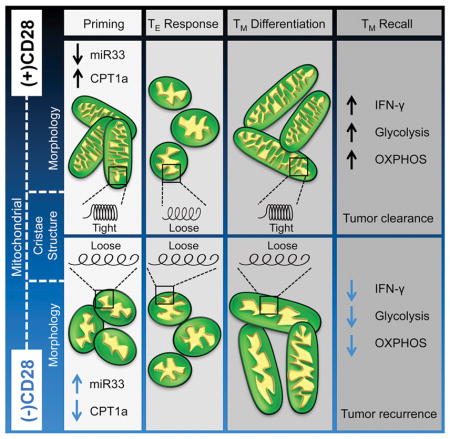
(See also Figure S5) A) Western blot analysis at 24 hours after activation with αCD3 ± CD28. Signals shown from a single western blot; bar graph depicts Cpt1a/TXNIP ratio at 24 hours after activation, n=4 biological replicates. Densitometry measurements made in ImageJ and converted to optical density (density step card of Kodak MR film y=0.021046xe0.014751x R=0.98635.) B) TN cells were activated using αCD3 ± CD28 and Cpt1a protein levels were measured by flow cytometry. Bar graphs represented as mean ± SEM from three biological replicates. *** p<0.001. C) Naïve T cells activated as in B. were assessed for TXNIP and Cpt1a expression by flow cytometry. Bar graph depicts Cpt1a/TXNIP ratio at 24 hours after activation from 3 biological replicates. * p<0.05. D) Human CD8+ TN cells were enriched using magenetic bead negative selection (Stem Cell technologies). 24 hours after activation with αCD3 ± CD28 protein extracts were assessed for TXNIP protein levels. Bar graphs represent relative TXNIP expression between ± αCD28 activation conditions. Ratios were calculated using densitometry from blots shown in Figure S5C. Bar graphs represent mean ± SEM of three healthy donors. * p<0.05. E) Flow cytometric analysis of human CD8+ TN cells activated as in D for CPT1A protein expression. Bar graphs represent mean ± SEM, and are representative of >3 experiments. A repeat experiment showing the same trends is shown in Figure S5D. F) Human CD8+ TN cells were electroporated with an AC133/CD133-specific first or second-generation chimeric antigen receptor (CAR). Electroporated cells were rested overnight and then exposed to the murine EL4 lymphoma cell line expressing the exogenous CAR target AC133/CD133 in the presence of IL-2 at a ratio of 5:1 tumor to T cell to ensure maximal activation. 24 hours after activation, CPT1A expression was analyzed in the CAR+ cells (Myc tag staining) by flow cytometry. Bar graphs depict mean ± SEM of the ratio of CPT1A expression between first and second generation CAR T cells from the same experiment. Calculations depicted are of three independent experiments. *** p<0.001. G) miR33 expression by qRT-PCR at 24 and 48 hours after activation with αCD3 ± CD28 (n=4 samples). ** p< 0.01 H) 3 pmol of oligonucleotides were electroporated into TN cells using the Amaxa nucleofector, cells were rested for 4 hours and activated using αCD3 ± CD28. 24 hours after activation Cpt1a protein levels were measured by flow cytometry. Histograms representative of 3 biological replicates. I) αCD3/28 cells generated with anti-miR33 or miR33-mimetic generated as in D were differentiated toward IL-15 TM cells and restimulated. Intracellular IFN-γ was assessed by flow cytometry (% IFN-γ+ CD8+ T cells and MFI of IFN-γ is shown). J) EM of control or miR33-mimetic cells generated as in I. K) Bar graph depicts mean ± SEM of maximum cristae width in arbitrary units, measured from >25 images from each group using Fiji/Image J software. Statistical comparisons for two groups were calculated by using unpaired two-tailed Student’s t-test, *** p < 0.0001. L) Proposed model shows regulation of Cpt1a function and FAO by CD28. CD28 signals transiently promote expression of Cpt1a, the rate-limiting enzyme for mitochondrial FAO, before the first cell division, coinciding with mitochondrial elongation and enhanced spare respiratory capacity (SRC). microRNA-33 (miR33), a target of thioredoxin-interacting protein (TXNIP), attenuates Cpt1a expression in the absence of CD28. Cpt1a expression dictates FAO engagement in CD8+ T cells after activation. FAO can be blocked by miR33-mediated, or ETO-mediated, inhibition of Cpt1a. This early transient CD28-dependent Cpt1a driven FAO prevents premature mitochondrial sphericity and excessive cristae loosening (depicted as a spring), which endows the mitochondria with the capacity to ‘recoil’, a process crucial for the generation of the long lasting metabolic reserve that is essential for the appropriate functional recall capacity of TM cells. This early transient CD28-dependent FAO prevents premature mitochondrial sphericity and is crucial for the generation of long lasting mitochondrial metabolic reserve.
To further investigate the relationship between CD28 and CPT1A in human T cells we generated 1st and 2nd generation human chimeric antigen receptor (CAR) T cells targeting the brain tumor antigen AC133/CD133. We observed increased CPT1A expression in the 2nd generation CAR T cells that contained CD3ζ along with the CD28 intracellular signaling domain, when compared to the 1st generation CAR T cells which only contained the CD3ζ domain, 24 hours after activation (Figure 5F). We also detected an increase in CPT1A in the 1st generation CAR T cells supplemented with soluble CD28 (Figure S5F).
We observed that miR33 expression in T cells primed (+) αCD28 was reduced after 24 hours compared to cells primed (−) αCD28 (Figure 5G), and inversely correlated with the expression of Cpt1a protein at this time (Figure 5A–C), suggesting a possible causality between miR33 suppression and Cpt1a induction. We reasoned that manipulating miR33 expression in T cells during the first 48 hours after activation (−) αCD28 should recapitulate the effects of activation (+) αCD28 on Cpta1 expression. Introducing anti-miR33 into T cells primed (−) αCD28 promoted Cpt1a expression to the level observed in (+) αCD28 T cells with the control miR (Figure 5H), while a miR33 mimetic suppressed Cpt1a expression in cells primed ± αCD28 when compared to cells with the control miR (Figure 5H). Additionally, anti-miR expression in cells primed (+) αCD28 led to an even further increase in Cpt1a (Figure 5H), suggesting that Cpt1a may not be expressed maximally after priming (+) αCD28, raising the possibility that additional costimulatory signals could increase its expression further in other settings (Kawalekar et al., 2016).
miR33 Expression During Naïve T Cell Priming Modulates Cytokine Production and Cristae Morphology in IL-15 TM cells
To test the effects of transient miR33 expression during T cell priming on T cell function after TM cell differentiation, we introduced anti-miR33 and miR33 mimetic into TN cells that were subsequently primed (+) αCD28 and differentiated to IL-15 TM cells. Anti-miR33 increased IFN-γ production upon restimulation in comparison to T cells with control miR, while the miR33 mimetic dampened IFN-γ production, confirming that the regulation of miR33 during T cell activation influences the long lasting functional capacity of future TM cells (Figure 5I). Much like inhibiting Cpta1 with ETO, introduction of the miR33 mimetic results in looser cristae in T cells cultured toward the TM phenotype (Figure 5J–K).
DISCUSSION
We show here that CD28 ligation during priming endows T cells with mitochondrial capacity that is important for future T cell responses. We speculate that CD28 temporarily restricts TXNIP and miR33 expression, and that this leads to a transient induction of Cpt1a and FAO, which are marked by characteristic changes in mitochondria shape and structure. Early CD28 signals restrain cristae loosening immediately after T cell activation and we surmise that this process grants mitochondria a rebound capacity that is critical for future SRC and function. The changes in mitochondrial morphology and inner cristae structure we observed in T cells after activation can determine metabolic pathway engagement (Buck et al., 2016). Much like an overstretched spring, initial T cell priming without costimulation results in slack cristae without a future ability to robustly recoil (Figure 5L). Precisely how CD28 signals after T cell activation restrain mitochondrial sphericity, and how this process imparts durable changes to the mitochondria that are remembered by future daughter cells remains a subject of investigation. Our data show that activated OPA1TG T cells tighten cristae even further in response to CD28 costimulation, suggesting that CD28 signals mediate factors beyond OPA1. CD28 signals can enhance cell survival through induction of the mitochondrial modulator Bcl-XL (Boise et al., 1995). Whether this CD28-mediated signal, or whether additional functions of Cpt1a beyond FAO, influence the mitochondrial fission and fusion machinery that are critical regulators of TM cells (Buck et al., 2016), or contribute to mitochondrial morphology and metabolism, is of future interest.
Conceptually, the ability to engineer cells to adopt a particular metabolism that favors optimal immune cell performance in different disease settings is a basis for therapeutically targeting immunometabolism (O'Sullivan and Pearce, 2015). Much like cancer cells that rewire metabolism toward the Warburg effect, other cell types like T cells can also be forced to rewire metabolism. Genetic changes can lead to metabolic changes that allow cells to persist in the face of differing environmental stresses or conditions. In this context, a recent report has shown that persistently elevated glycolytic metabolism due to von Hippel-Lindau (Vhl)-deficiency, which enforces constitutive hypoxia-inducible factor (HIF) activation, can support the development of a persistent effector memory T (TEM) cell population (Phan et al., 2016). These data suggest that reprogramming a cell to engage aerobic glycolysis with enhanced HIF activity alters its need to rely on mitochondrial processes such as OXPHOS during TM cell development by providing another means by which to obtain energy. However, it is important to stress that under physiological conditions, the engagement of OXPHOS and associated loss of clonal expansion, with acquisition of homeostatic self-renewal coupled to cellular persistence, is a critical component of the normal T cell response. Therefore, while OXPHOS and SRC are not requirements for the development of persistent Vhl-deficient TEM cells (Phan et al., 2016), the data do not suggest that these parameters are not important for normal TM cell development and function, and in particular, for the development of central memory (TCM) cells. Studies continue to support a role for both OXPHOS and SRC in TM cells (Fraser et al., 2013; Kawalekar et al., 2016; Sukumar et al., 2013; Sukumar et al., 2016) and we show here that these attributes are also influenced by CD28 during initial activation.
Our data support that there is more FAO in T cells with tight mitochondrial cristae as a result of CD28 signaling, when compared to (−) CD28 cells. After tracing carbons derived from palmitate, glucose, and glutamine, the only significant difference observed between cells ±CD28 significant was the increased incorporation of palmitate into TCA intermediates, an increase lost with ETO treatment. These changes in metabolism were accompanied by the loosening of cristae, and by blunted SRC, an effect also observed following Cpt1a knockdown. Importantly, the metabolomics data showed that mitochondria with either loose or tight cristae oxidized glucose and glutamine and the fractional contribution to TCA intermediates remained equal. In contrast, (+) CD28 cells with tight cristae exhibited increased oxidation of labeled palmitate. Thus, it is not that the cells containing mitochondria with tight cristae switch to a preferential usage of FA as a result of CD28, but rather, they burn significantly more FA than (−) CD28 cells with loose cristae. This suggests that in this context, the enhanced FAO is not at the expense of glucose or glutamine utilization, but rather our data support the notion that engagement of FAO confers a metabolic advantage to cells that received CD28 costimulation. It is worth noting only ~5% label is found in cellular palmitate after 24 hours, perhaps suggesting that FAO of exogenous palmitate is inefficient. This assay does not measure oxidation of unlabeled endogenous FA stores, which could also significantly contribute to FAO in these cells.
It may not be that mitochondria with tight cristae always use more FAO than those with loose cristae. Opa1-deficient T cells have loose cristae and maintain OXPHOS that is ETO sensitive, indicating that these cells can engage FAO (Buck et al., 2016). However, Opa1−/− T cells lack SRC and do not form TM cells. Thus, tight cristae are not an absolute requirement for FAO, but appear to be required for SRC. We believe that these data suggest that FAO via Cpt1a function, and tight cristae with SRC, are linked processes in that they are both important for the development of functional TM cells. Further studies might uncover how these pathways are related.
While off-target effects can be a concern when using inhibitors, our approach of using ETO allowed us to transiently inhibit Cpt1a function during T cell priming, when initial costimulatory signals from CD28 are present. To address the concern that ETO may have effects beyond inhibiting Cpt1a and FAO, we introduced a Cpt1a-shRNA (sh), or a Cpt1a siRNA, into TN cells to knockdown this protein prior to activation. By genetically targeting Cpt1a we could illustrate that the SRC observed early after activation was Cpt1a-dependent, and correlate this with the fact that the future function of the TM cells derived from these TN cells was compromised. These results phenocopied those observed with ETO treatment during activation, supporting that in this context ETO inhibits Cpt1a function.
Interestingly, we observed spherical mitochondria 8h after activation in the absence of CD28 costimulation, or in the presence of ETO, which was at a time before significant differences in Cpt1a protein expression were measureable. This could be because only a very subtle increase in Cpt1a is needed for its effect on mitochondrial morphology, since Cpt1a enzyme activity has been linked to expression levels (Akkaoui et al., 2009). While Cpt1a protein is significantly increased at 24 hours after activation with CD28 costimulation, changes in the regulation of Cpt1a activity could also happen earlier, for example, through differences in its mitochondrial membrane localization, interactions within the mitochondrial fatty acid transport complex (Lee et al., 2011), or its steric regulation via changing malonyl CoA concentrations (McGarry et al., 1977). This type of change in regulation could contribute to Cpt1a function and associated effects on mitochondrial morphology. When taken together, the data suggest that mitochondrial dynamics can be modulated downstream of CD28, which itself regulates Cpt1a activity and FAO.
While TXNIP-miR33-Cpt1a regulation of FAO is well established in the literature (Chen et al., 2016; Davalos et al., 2011; Goedeke et al., 2013), this does not preclude the involvement of other targets in the regulation of CD28-mediated mitochondrial remodeling. However, the inhibition of TM cell recall ability evident in T cells activated (−) CD28, or T cells activated (+) CD28 with enhanced miR33 expression or reduced Cpt1a function, suggests that the miR33-Cpt1a axis is, at least in part, a mechanism that mediates the function of CD28 regulated mitochondrial remodeling and fatty acid metabolism. It will be of interest for future studies to profile all miR33 targets in these cells to potentially identify druggable proteins in this pathway beyond Cpt1a that modulate mitochondrial function during T cell activation.
As costimulatory molecules are immunotherapeutic targets and incorporation of their signaling domains can affect the functional capacity of CAR T cells (Esensten et al., 2016; Fesnak et al., 2016; Kawalekar et al., 2016), research into this area is highly relevant. Interestingly, recent evidence shows that PD-1 modulates FAO in T cells (Davalos et al., 2011), suggesting that other pathways that influence T cell activation can also regulate mitochondrial processes. Also, it has been shown that the inclusion of a 4-1BB intracellular domain in the CAR leads to T cells with a more oxidative metabolism when compared to CD28 containing CAR T cells (Kawalekar et al., 2016). A constant signal through CD28, long after activation, leads to CAR T cells with an exhausted phenotype (Long et al., 2015). It is possible that only a transient costimulatory signal from CD28, combined with the 4-1BB intracellular domain in the CAR, would lead to an optimally activated CAR T cell that is resistant to exhaustion in vivo. Understanding precisely how inhibitory receptors and costimulatory molecules regulate immune cell metabolism and mitochondrial processes is critical for effectively harnessing these molecules for therapy. While it has been known for more than 30 years that CD28 is important for promoting T cell activation (Martin et al., 1986; Weiss et al., 1986) and glycolysis (Frauwirth et al., 2002; Jacobs et al., 2008; MacIver et al., 2013), we now expand our knowledge to show that signals from this receptor also endow mitochondria with latent metabolic capacity that is essential for future T cell responses.
STAR METHODS
CONTACT FOR REAGENT AND RESOURCE SHARING
Further information and requests for resources and reagents should be directed to and will be made available upon reasonable request by the Lead Contact, Erika L. Pearce (pearce@ie-freiburg.mpg.de).
EXPERIMENTAL MODEL AND SUBJECT DETAILS
Mouse Models
C57BL/6J (RRID:IMSR_JAX:000664), CD80/86−/− (RRID:IMSR_JAX:003610), PhAM (RRID:IMSR_JAX:018397) (Pham et al., 2012), major histocompatibility complex (MHC) class I-restricted OVA specific TCR OT-I transgenic mice (RRID:IMSR_JAX:003831), and CD45.1 congenic (RRID:IMSR_JAX:002014) mouse strains were purchased from The Jackson Laboratory and were maintained at the Max Planck institute for Immunobiology and cared for according to the Institutional Animal Use and Care Guidelines. Tumor studies were approved by the animal care committee of the Regierungspraesidium Freiburg. Mice were bred under specific pathogen free standards, and transferred to open top cages for experimental procedures. For tumor experiments 8–15 week old mice were randomized to match age and gender across experimental groups. Temperature and humidity of the holding rooms was monitored daily and tumor bearing mice were weighed every 2 days. No association of sex or weight with response was observed or expected.
Primary cell cultures
Naïve CD8+ T cells were obtained from total splenocytes isolated from 6–9 week old C57/B6 mice using the naïve CD8 T cell kit (Stem Cell technologies) according to the manufacturers protocol. Within experiments mice were age and sex matched. Sample size is indicated in the figure legends. Fresh buffy coats from healthy donors were collected from the Blood Donation Center of the University Hospital Freiburg, under approval by the ethical committee of the University of Freiburg. Naïve human CD8 T cells were isolated by a naïve CD8 T cell kit (Stem Cell technologies, Cat# 19258). Researchers were blinded to the identity of the donors, and age or sex matching was not performed. Sample size is indicated in the figure legends. Isolated T cells were activated using plate bound αCD3 (5μg/ml) (anti-mouse CD3, BioLegend Cat# 100223 RRID:AB_1877072 ; anti-human CD3 BioLegend Cat# 300314 RRID:AB_314050), in 1640 media supplemented with 10% fetal calf serum, 4mM L-glutamine, 1% penicillin/streptomycin, 100 U/ml hrIL-2 (Peprotech), 55μM beta-mercaptoethanol, and ± 0.5μg/ml soluble αCD28 and ± 200μM Etomoxir under 5% CO2, atmospheric oxygen, at 37°C in a humidified incub ator.
Cell lines
The murine EL4 lymphoblast cell line expressing OVA (EL4-OVA; E.G7-OVA), was purchased from ATCC (ATCC Cat# CRL-2113, RRID:CVCL_3505), cultured for three passages before being implanted in the flank of naïve mice. Further authentication of this cell line was not performed. The sex of the cell line is female. Cells were maintained in 1640 media supplemented with 10% fetal calf serum, 4mM L-glutamine, 1% penicillin/streptomycin, 55 μM beta-mercaptoethanol, under 5% CO2, atmospheric oxygen, at 37°C in a humidified incubat or.
METHOD DETAILS
In vivo tumor experiments_
C57BL/6 mice were injected subcutaneously into the right flank of mice with 1 × 10⁶ EL4-OVA. After 5 days, 5 × 10⁶ congenically marked OT-I TE, that had previously been activated in vitro with αCD3, αCD3/CD28 or αCD3/CD28 +ETO, were transferred i.v. into mice randomized from littermate cages and tumor growth was assessed. Tumor measurements were not acquired blinded, but reproducibly acquired by multiple investigators. A small quantity of blood was obtained at indicated time points to quantify OVA-specific CD8+ T cells by flow cytometry.
Primary T cell isolation and culture
Naïve CD8+ T cells were obtained from total splenocytes isolated from 6–9 week old C57/B6 mice using the naïve CD8 T cell kit (Stem Cell technologies, Cat# 19858) according to the manufacturers protocol. Naïve human CD8 T cells were isolated using a negative selection kit (Stem Cell technologies, Cat# 19258). Isolated T cells were activated using plate bound αCD3 (5μg/ml) (anti-mouse CD3, BioLegend Cat# 100223 RRID:AB_1877072 ; anti-human CD3 BioLegend Cat# 300314 RRID:AB_314050), in 1640 media supplemented with 10% fetal calf serum, 4mM L-glutamine, 1% penicillin/streptomycin, 100 U/ml hrIL-2 (Peprotech), 55μM beta-mercaptoethanol, and ± 0.5μg/ml soluble αCD28 (anti-mouse CD28 BioLegend Cat# 102112 RRID:AB_312877; anti-human CD28 BioLegend Cat# 302923 RRID:AB_2291210) and ± 200μM Etomoxir. Media changes were performed at D2 (removing Etomoxir). For TM cell cultures, T cells at D3 after activation were plated in media containing 100U/ml IL-15 (Peprotech) followed by media changes on D4 and D5. TM cells were analyzed or reactivated day 6 after initial activation. For acute glucose restriction (AGR), cells were plated in complete media supplemented with dialyzed serum and the indicated glucose amounts for 24 hours before analysis. For OT-I cultures, single cell suspensions of splenocytes were incubated for 48 hours in IL-2 containing media as described above in the presence of SIINFEKL or SIIQFEKL peptide as indicated. For blockade of B7.1-B7.2 mediated CD28 costimulation cultures were supplemented with 1μg/ml CTLA4-Ig or human Fc-Ig control (BioXcell) before the addition of peptides.
Metabolic phenotyping
Extracellular acidification rate (ECAR) and oxygen consumption rate (OCR) were measured using the Seahorse XFe bioanalyzer. 2 × 10⁵ T cells per well (≥ 3 wells per sample) were spun onto poly-D-lysine coated seahorse 96 well plates and preincubated at 37°C for a minimum of 45 minutes in the absence of CO2. For long assays (>8hrs) after activation of TN or TM cells, XF media was supplemented with 25mM glucose and 100 U/ml hrIL-2 (Peprotech). For activation of TN or TM cells, αCD3 ± CD28 coated beads were used at 1:1 ratio of beads:T cell. OCR and ECAR were measured under basal conditions, after activation, after restimulation, and after the addition of the following drugs: 1 μM oligomycin, 1.5 μM flurorcarbonyl cynade phenylhydrazon (FCCP), 200 μM etomoxir, and 100 nM rotenone + 1 μM antimycin A (all Sigma) as indicated. Measurements were taken using a 96 well Extracellular Flux Analyzer (SeahorseBioscience). Real-time analysis of extracellular oxygen and pH during the first 48 hrs of activation was conducted in a standard humidified incubator with 5%CO2, in a 6 well plate format using a SDR SensorDish reader (PreSens) and cells plated at 1 × 10⁶ splenocytes/ml. For metabolic tracing TN cells were isolated and activated as described above in glucose or glutamine-free media supplemented with 11 mM D-[U13C] glucose, 4mM [U13C] glutamine or 20 μM [U13C] palmitate and cultured for 24 hours. Cells were washed with ice cold 0.9% w/v NaCl buffer and Metabolites were extracted twice with hot ethanol (70%) and analyzed by gc mass spectrometry (GCMS). Fractional contribution from exogenous substrates was calculated as described previously (Buescher et al., 2015).
Flow cytometry
Fluorochrome-conjugate monoclonal antibodies were purchased from eBioscience, BDBioscience, or Life Technologies. Staining was performed in 1% FBS/PBS for 30 minutes on ice, dead cells were excluded with the LIVE/DEAD Fixable Aqua Dead Cell Stain Kit (Thermo scientific). OVA-specific CD8+ T cells from blood were quantified after bed blood cell lysis, by direct staining with H2-kbOVA257–264( KbOVA) MHC-peptide tetramers. For intracellular cytokine staining cells were reactivated with αCD3/28 overnight and cultured in the presence of Brefeldin A for 5 hours prior to fixation using Cytofix Cytoperm (BDBioscience). For determination of exogenous palmitate uptake, cells were incubated with Bodipy conjugated palmitate (Bodipy FL C16; Life Technologies) 30 minutes at 37°C prior to an alysis. To assay glucose uptake, 100nM 2NBDG was added for 2 minutes at 37°C after which the cells were cooled on ice and analyzed. (All reagents were used according to the manufacturers recommendation). Cpt1a primary antibody staining (Proteintech Group Cat# 15184-1-AP RRID:AB_2084676) was detected using Alexa Fluor-647 or 421 anti-rabbit secondary antibody (Life technologies). Cells were analyzed using LSR Fortessa flow cytometers (BDBiosciences) and data was processed using FlowJo software (FlowJo, LLC).
Confocal and Electron Microscopy imaging
Spinning disk confocal and EM imaging was performed as described previously (Buck et al., 2016). Cells were activated as indicated and transferred to glass bottom dishes (MatTek) coated with fibronectin (Sigma) in complete medium containing IL-2 or IL-15 using a Zeiss spinning disk confocal with an Evolve (EMCCD) camera. Cells were kept in a humidified incubation chamber at 37°C with 5% CO2 during image collection. Confocal imaging was analyzed using Imaris imaging software. For Electron Microscope imaging 2 × 10⁶ T cells were fixed in 2.5% glutaraldehyde in 100 mM sodium cocodylate, washed in cocodylate buffer. After dehydration samples were embedded in Eponate 12 resin (Ted Pella) and sections were cut. Images were acquired using a JOEL 1200 EX transmission electron microscope with an ATMP digital camera (Figures 2C and 3E) (Advanced Microscopy Techniques) or a FEI Tecnai 12 Transmission electron microscope equipped with a TIETZ digital camera (Figures S2C, S3G and 5J). Cristae width was measured using ImageJ software and averaged over 15 independent images, acquisition of EM micrographs and measurements of max cristae width displayed in Figures 2C–D and 3E–F were performed blinded. Previously acquired EM images were used to measure cristae width in ex vivo and in vitro generated TN, TE, and TM cells (Buck et al., 2016).
Western Blotting
For Western blot analysis cells were washed with ice cold PBS and lysed in 1 x Cell Signaling lysis buffer (20 mM Tris-HCl, [pH 7.5], 150 mM NaCl, 1 mM Na2EDTA, 1 mM EGTA, 1% TritonX-100, 2.5 mM sodium pyrophosphate, 1 mM β-glycerophosphate, 1 mM Na3VO4, 1 μg/mL leupeptin (Cell Signaling Technologies) supplemented with 1 mM PMSF. Samples were frozen and thawed 3 times followed by centrifugation at 20,000 x g for 10 min at 4°C. Cleared protein lysate was denatured with LDS loading buffer for 10 min at 70°C, and loaded on precast 4% to 12% bis-tris protein gels (Life Technologies). Proteins were transferred onto nitrocellulose membranes using the iBLOT 2 system (Life Technologies) following the manufacturer’s protocols. Membranes were blocked with 5% w/v milk and 0.1% Tween-20 in TBS and incubated with the appropriate antibodies in 5% w/v BSA in TBS with 0.1% Tween-20 overnight at 4°C. The follow ing antibodies were used: anti- Cpt1a (Proteintech Group Cat#15184-1-AP RRID:AB_2084676), anti-TXNIP (Cat#14715), -GAPDH (Cat#5174P) (Cell Signaling Technologies). All primary antibody incubations were followed by incubation with secondary HRP- conjugated antibody (Pierce) in 5% milk and 0.1% Tween-20 in TBS and visualized using SuperSignal West Pico or femto Chemiluminescent Substrate (Pierce) on Biomax MR film (Kodak). Optical density of the signals on film was quantified using grayscale measurements in Image J software (NIH) and converted to fold change.
miRNA analysis
miRNA analysis was performed using the TaqMan® MicroRNA Cells-to-CT Kit (Life Technologies) according to the manufacturers recommendation. Briefly, 100K cells were collected and washed in ice cold PBS followed by resuspension in lysis buffer. 5μl lysate was used to generate miRNA-specific RT fragments, and miRNA expression was detected using the miR33 detection kit (Life Technologies Cat# 4427975, assay ID 002135). Relative miRNA expression levels were normalized to HPRT (Life Technologies assay ID Mm03024075_m1).
siRNA delivery
For siRNA transfection of naïve T cells we used the smartpool accell siRNA for murine Cpt1a (GE Dharmacon Cat# E-042456-00-0005) according to the manufacturers recommendations with minor modifications. To ensure TN survival, overnight cultures in Accell delivery medium (Cat# B-005000) were supplemented with 1% dialyzed fetal calf serum (Gibco) and IL-7 at 10U/ml in medium.
shRNA delivery
TN cells or TE cells were transduced with control (Luciferase-shRNA) or Cpt1a-shRNA expressing retrovirus at an estimated MOI of 10 for the TN and 3 for the TE cells by centrifugation for 90 minutes (1000 x G) in the presence of polybrene (8μg/ml). To ensure more efficient delivery of retrovirus, TN cells were cultured in media supplemented with IL-7 for 36 hours prior to infection to induce homeostatic proliferation.
Chimeric antigen receptor (CAR) T cell generation
PBMCs were isolated from buffy coats by Pancoll (Pan Biotech) density gradient centrifugation. The untouched CD8 positive T cells were purified from PBMC using CD8+ T Cell Isolation Kit (Miltenyi Biotec, Cat# 130-096-495). CAR construct transfections were performed as described previously (Zhu et al., 2015). 10 μg AC133/CD133-CAR piggyBac transposon vector and 5 μg Super PiggyBac Transposase (System Biosciences) plasmid were used to transfect 20 million T cells in one nucleofection reaction using a human T cell nucleofector kit (VPA-1002, Lonza). After electroporation cells were rested overnight and then activated on the EL4 lymphoma cell line expressing exogenous CD133.
(anti)miR electroporations
TN cells were electroporated with 3 pMol (Anti)miR oligonucleotide (Cat#MC12410/mir33-5p; Cat#AM12410/Antimir33-5p Life Technologies) in primary cell buffer 3 using the Nucleofector X unit (Lonza) according to the manufacturers recommendations. 8 hours post electroporation miR-containing cells were activated ± αCD28. 24 hours after activation cells were fixed and stained for Cpt1a expression by flow cytometry. For long term cultures, cells were electroporated with (anti)miR oligonucleotides in the presence of a GFP expression vector (Lonza). 24 hours after electroporation cells were sorted for GFP expression, activated with αCD3, and cultured like in Figure 1E. Cells were restimulated using αCD3/28 to assess ability to produce cytokine.
QUANTIFICATION AND STATISTICAL ANALYSIS
Statistical analysis was preformed using prism 6 software (Graph pad) and results are represented as mean ± SEM, unless otherwise indicated. Comparisons for two groups were calculated using unpaired two-tailed Student’s t-tests, comparisons of more than two groups were calculated using one-way ANOVA with Bonferroni’s multiple comparison tests. We observed normal distribution and no difference in variance between groups in individual comparisons. Selection of sample size was based on extensive experience with metabolic assays. The sample size for the in vivo tumor experiments shown in Figure 4 were based on previous experience with the tumor cell line and associated transgenic T cell responses.
Supplementary Material
HIGHLIGHTS.
CD28 signals endow T cells with latent mitochondrial respiratory capacity
CD28 regulates mitochondrial sphericity and cristae morphology in T cells
CD28 costimulation restrains miR-33-dependent inhibition of Cpt1a expression
CD28-mediated Cpt1a function supports generation of protective memory T cells
Acknowledgments
We thank Pia Theissen, Mai Matsushita, and all members of the Pearce laboratories for support, Barbara Joch, Felicia Basilicata, Herbert Holz and members of the Akhtar group for technical assistance. This work was funded by the NIH (CA181125 to E.L.P. and AI110481 to E.J.P.) and the Max Planck Society.
Footnotes
AUTHOR CONTRIBUTIONS
R.I.K.G., D.O., M.C., M.D.B., J.B., T.B.H., S.J., B.L., G.N., A.S.R., E.J.P and E.L.P. designed research, provided conceptual input, and wrote the manuscript. R.I.K.G., D.O., M.C., A.B., M.D.B., E.F., X.Z., G.C., B.K., U.W., A.R-E., R.L.K., L.V., J.D.C., A.E.P., S.L., K.G., J.Q., D.E.S., O.K., and E.L.P. analyzed data and performed experiments.
Publisher's Disclaimer: This is a PDF file of an unedited manuscript that has been accepted for publication. As a service to our customers we are providing this early version of the manuscript. The manuscript will undergo copyediting, typesetting, and review of the resulting proof before it is published in its final citable form. Please note that during the production process errors may be discovered which could affect the content, and all legal disclaimers that apply to the journal pertain.
References
- Akkaoui M, Cohen I, Esnous C, Lenoir V, Sournac M, Girard J, Prip-Buus C. Modulation of the hepatic malonyl-CoA-carnitine palmitoyltransferase 1A partnership creates a metabolic switch allowing oxidation of de novo fatty acids. The Biochemical journal. 2009;420:429–438. doi: 10.1042/BJ20081932. [DOI] [PubMed] [Google Scholar]
- Boise LH, Minn AJ, Noel PJ, June CH, Accavitti MA, Lindsten T, Thompson CB. CD28 costimulation can promote T cell survival by enhancing the expression of Bcl-xL. Immunity. 1995;3:87–98. doi: 10.1016/1074-7613(95)90161-2. [DOI] [PubMed] [Google Scholar]
- Borowski AB, Boesteanu AC, Mueller YM, Carafides C, Topham DJ, Altman JD, Jennings SR, Katsikis PD. Memory CD8+ T Cells Require CD28 Costimulation. The Journal of Immunology. 2007;179:6494–6503. doi: 10.4049/jimmunol.179.10.6494. [DOI] [PubMed] [Google Scholar]
- Buck MD, O'Sullivan D, Klein Geltink RI, Curtis JD, Chang CH, Sanin DE, Qiu J, Kretz O, Braas D, van der Windt GJ, et al. Mitochondrial Dynamics Controls T Cell Fate through Metabolic Programming. Cell. 2016;166:63–76. doi: 10.1016/j.cell.2016.05.035. [DOI] [PMC free article] [PubMed] [Google Scholar]
- Buescher JM, Antoniewicz MR, Boros LG, Burgess SC, Brunengraber H, Clish CB, DeBerardinis RJ, Feron O, Frezza C, Ghesquiere B, et al. A roadmap for interpreting (13)C metabolite labeling patterns from cells. Current opinion in biotechnology. 2015;34:189–201. doi: 10.1016/j.copbio.2015.02.003. [DOI] [PMC free article] [PubMed] [Google Scholar]
- Chang CH, Qiu J, O'Sullivan D, Buck MD, Noguchi T, Curtis JD, Chen Q, Gindin M, Gubin MM, van der Windt GJ, et al. Metabolic Competition in the Tumor Microenvironment Is a Driver of Cancer Progression. Cell. 2015;162:1229–1241. doi: 10.1016/j.cell.2015.08.016. [DOI] [PMC free article] [PubMed] [Google Scholar]
- Chen J, Young ME, Chatham JC, Crossman DK, Dell'Italia LJ, Shalev A. TXNIP regulates myocardial fatty acid oxidation via miR-33a signaling. American Journal of Physiology - Heart and Circulatory Physiology. 2016;311:H64–H75. doi: 10.1152/ajpheart.00151.2016. [DOI] [PMC free article] [PubMed] [Google Scholar]
- Cogliati S, Frezza C, Soriano ME, Varanita T, Quintana-Cabrera R, Corrado M, Cipolat S, Costa V, Casarin A, Gomes LC, et al. Mitochondrial Cristae Shape Determines Respiratory Chain Supercomplexes Assembly and Respiratory Efficiency. Cell. 2013:160–171. doi: 10.1016/j.cell.2013.08.032. [DOI] [PMC free article] [PubMed] [Google Scholar]
- Davalos A, Goedeke L, Smibert P, Ramirez CM, Warrier NP, Andreo U, Cirera-Salinas D, Rayner K, Suresh U, Pastor-Pareja JC, et al. miR-33a/b contribute to the regulation of fatty acid metabolism and insulin signaling. Proceedings of the National Academy of Sciences of the United States of America. 2011;108:9232–9237. doi: 10.1073/pnas.1102281108. [DOI] [PMC free article] [PubMed] [Google Scholar]
- Dávalos A, Goedeke L, Smibert P, Ramírez CM, Warrier NP, Andreo U, Cirera-Salinas D, Rayner K, Suresh U, Pastor-Pareja JC, et al. miR-33a/b contribute to the regulation of fatty acid metabolism and insulin signaling. Proceedings of the National Academy of Sciences. 2011;108:9232–9237. doi: 10.1073/pnas.1102281108. [DOI] [PMC free article] [PubMed] [Google Scholar]
- DeBalsi KL, Wong KE, Koves TR, Slentz DH, Seiler SE, Wittmann AH, Ilkayeva OR, Stevens RD, Perry CGR, Lark DS, et al. Targeted Metabolomics Connects TXNIP to Mitochondrial Fuel Selection and Regulation of Specific Oxidoreductase Enzymes in Skeletal Muscle. Journal of Biological Chemistry. 2014 doi: 10.1074/jbc.M113.511535. [DOI] [PMC free article] [PubMed] [Google Scholar]
- Esensten JH, Helou YA, Chopra G, Weiss A, Bluestone JA. CD28 Costimulation: From Mechanism to Therapy. Immunity. 2016;44:973–988. doi: 10.1016/j.immuni.2016.04.020. [DOI] [PMC free article] [PubMed] [Google Scholar]
- Fesnak AD, June CH, Levine BL. Engineered T cells: the promise and challenges of cancer immunotherapy. Nat Rev Cancer. 2016;16:566–581. doi: 10.1038/nrc.2016.97. [DOI] [PMC free article] [PubMed] [Google Scholar]
- Fraser KA, Schenkel JM, Jameson SC, Vezys V, Masopust D. Preexisting high frequencies of memory CD8+ T cells favor rapid memory differentiation and preservation of proliferative potential upon boosting. Immunity. 2013;39:171–183. doi: 10.1016/j.immuni.2013.07.003. [DOI] [PMC free article] [PubMed] [Google Scholar]
- Frauwirth KA, Riley JL, Harris MH, Parry RV, Rathmell JC, Plas DR, Elstrom RL, June CH, Thompson CB. The CD28 signaling pathway regulates glucose metabolism. Immunity. 2002;16:769–777. doi: 10.1016/s1074-7613(02)00323-0. [DOI] [PubMed] [Google Scholar]
- Goedeke L, Vales-Lara FM, Fenstermaker M, Cirera-Salinas D, Chamorro-Jorganes A, Ramirez CM, Mattison JA, de Cabo R, Suarez Y, Fernandez-Hernando C. A regulatory role for microRNA 33* in controlling lipid metabolism gene expression. Molecular and cellular biology. 2013;33:2339–2352. doi: 10.1128/MCB.01714-12. [DOI] [PMC free article] [PubMed] [Google Scholar]
- Jacobs SR, Herman CE, MacIver NJ, Wofford JA, Wieman HL, Hammen JJ, Rathmell JC. Glucose Uptake Is Limiting in T Cell Activation and Requires CD28-Mediated Akt-Dependent and Independent Pathways. The Journal of Immunology. 2008;180:4476–4486. doi: 10.4049/jimmunol.180.7.4476. [DOI] [PMC free article] [PubMed] [Google Scholar]
- Kawalekar Omkar U, O’Connor Roddy S, Fraietta Joseph A, Guo L, McGettigan Shannon E, Posey Avery D, Jr, Patel Prachi R, Guedan S, Scholler J, Keith B, et al. Distinct Signaling of Coreceptors Regulates Specific Metabolism Pathways and Impacts Memory Development in CAR T Cells. Immunity. 44:380–390. doi: 10.1016/j.immuni.2016.01.021. [DOI] [PubMed] [Google Scholar]
- Kundig TM, Shahinian A, Kawai K, Mittrucker HW, Sebzda E, Bachmann MF, Mak TW, Ohashi PS. Duration of TCR stimulation determines costimulatory requirement of T cells. Immunity. 1996;5:41–52. doi: 10.1016/s1074-7613(00)80308-8. [DOI] [PubMed] [Google Scholar]
- Lee K, Kerner J, Hoppel CL. Mitochondrial carnitine palmitoyltransferase 1a (CPT1a) is part of an outer membrane fatty acid transfer complex. The Journal of biological chemistry. 2011;286:25655–25662. doi: 10.1074/jbc.M111.228692. [DOI] [PMC free article] [PubMed] [Google Scholar]
- Long AH, Haso WM, Shern JF, Wanhainen KM, Murgai M, Ingaramo M, Smith JP, Walker AJ, Kohler ME, Venkateshwara VR, et al. 4-1BB costimulation ameliorates T cell exhaustion induced by tonic signaling of chimeric antigen receptors. Nature medicine. 2015;21:581–590. doi: 10.1038/nm.3838. [DOI] [PMC free article] [PubMed] [Google Scholar]
- Lopaschuk GD, Wall SR, Olley PM, Davies NJ. Etomoxir, a carnitine palmitoyltransferase I inhibitor, protects hearts from fatty acid-induced ischemic injury independent of changes in long chain acylcarnitine. Circulation Research. 1988;63:1036–1043. doi: 10.1161/01.res.63.6.1036. [DOI] [PubMed] [Google Scholar]
- MacIver NJ, Michalek RD, Rathmell JC. Metabolic regulation of T lymphocytes. Annual review of immunology. 2013;31:259–283. doi: 10.1146/annurev-immunol-032712-095956. [DOI] [PMC free article] [PubMed] [Google Scholar]
- Martin PJ, Ledbetter JA, Morishita Y, June CH, Beatty PG, Hansen JA. A 44 kilodalton cell surface homodimer regulates interleukin 2 production by activated human T lymphocytes. Journal of immunology. 1986;136:3282–3287. [PubMed] [Google Scholar]
- Martinez-Llordella M, Esensten JH, Bailey-Bucktrout SL, Lipsky RH, Marini A, Chen J, Mughal M, Mattson MP, Taub DD, Bluestone JA. CD28-inducible transcription factor DEC1 is required for efficient autoreactive CD4(+) T cell response. J Exp Med. 2013;210:1603–1619. doi: 10.1084/jem.20122387. [DOI] [PMC free article] [PubMed] [Google Scholar]
- McGarry JD, Mannaerts GP, Foster DW. A possible role for malonyl-CoA in the regulation of hepatic fatty acid oxidation and ketogenesis. J Clin Invest. 1977;60:265–270. doi: 10.1172/JCI108764. [DOI] [PMC free article] [PubMed] [Google Scholar]
- Mittrücker HW, Kursar M, Köhler A, Hurwitz R, Kaufmann SHE. Role of CD28 for the Generation and Expansion of Antigen-Specific CD8+ T Lymphocytes During Infection with Listeria monocytogenes. The Journal of Immunology. 2001;167:5620–5627. doi: 10.4049/jimmunol.167.10.5620. [DOI] [PubMed] [Google Scholar]
- O'Sullivan D, Pearce EL. Targeting T cell metabolism for therapy. Trends in immunology. 2015;36:71–80. doi: 10.1016/j.it.2014.12.004. [DOI] [PMC free article] [PubMed] [Google Scholar]
- Ouimet M, Ediriweera HN, Gundra UM, Sheedy FJ, Ramkhelawon B, Hutchison SB, Rinehold K, van Solingen C, Fullerton MD, Cecchini K, et al. MicroRNA-33–dependent regulation of macrophage metabolism directs immune cell polarization in atherosclerosis. The Journal of Clinical Investigation. 125:4334–4348. doi: 10.1172/JCI81676. [DOI] [PMC free article] [PubMed] [Google Scholar]
- Pearce EL, Walsh MC, Cejas PJ, Harms GM, Shen H, Wang LS, Jones RG, Choi Y. Enhancing CD8 T-cell memory by modulating fatty acid metabolism. Nature. 2009;460:103–107. doi: 10.1038/nature08097. [DOI] [PMC free article] [PubMed] [Google Scholar]
- Pham AH, McCaffery JM, Chan DC. Mouse lines with photo-activatable mitochondria to study mitochondrial dynamics. Genesis. 2012;50:833–843. doi: 10.1002/dvg.22050. [DOI] [PMC free article] [PubMed] [Google Scholar]
- Phan AT, Doedens AL, Palazon A, Tyrakis PA, Cheung KP, Johnson RS, Goldrath AW. Immunity. Elsevier; 2016. Constitutive Glycolytic Metabolism Supports CD8(+) T Cell Effector Memory Differentiation during Viral Infection; pp. 1024–1037. [DOI] [PMC free article] [PubMed] [Google Scholar]
- Rambold Angelika S, Cohen S, Lippincott-Schwartz J. Fatty Acid Trafficking in Starved Cells: Regulation by Lipid Droplet Lipolysis, Autophagy, and Mitochondrial Fusion Dynamics. Developmental Cell. 2015;32:678–692. doi: 10.1016/j.devcel.2015.01.029. [DOI] [PMC free article] [PubMed] [Google Scholar]
- Rayner KJ, Sheedy FJ, Esau CC, Hussain FN, Temel RE, Parathath S, van Gils JM, Rayner AJ, Chang AN, Suarez Y, et al. Antagonism of miR-33 in mice promotes reverse cholesterol transport and regression of atherosclerosis. The Journal of Clinical Investigation. 121:2921–2931. doi: 10.1172/JCI57275. [DOI] [PMC free article] [PubMed] [Google Scholar]
- Ron-Harel N, Santos D, Ghergurovich JM, Sage PT, Reddy A, Lovitch SB, Dephoure N, Satterstrom FK, Sheffer M, Spinelli JB, et al. Mitochondrial Biogenesis and Proteome Remodeling Promote One-Carbon Metabolism for T Cell Activation. Cell Metab. 2016;24:104–117. doi: 10.1016/j.cmet.2016.06.007. [DOI] [PMC free article] [PubMed] [Google Scholar]
- Sena Laura A, Li S, Jairaman A, Prakriya M, Ezponda T, Hildeman David A, Wang CR, Schumacker Paul T, Licht Jonathan D, Perlman H, et al. Mitochondria Are Required for Antigen-Specific T Cell Activation through Reactive Oxygen Species Signaling. Immunity. 2012;38:225–236. doi: 10.1016/j.immuni.2012.10.020. [DOI] [PMC free article] [PubMed] [Google Scholar]
- Senyilmaz D, Virtue S, Xu X, Tan CY, Griffin JL, Miller AK, Vidal-Puig A, Teleman AA. Regulation of mitochondrial morphology and function by stearoylation of TFR1. Nature. 2015;525:124–128. doi: 10.1038/nature14601. [DOI] [PMC free article] [PubMed] [Google Scholar]
- Sukumar M, Liu J, Ji Y, Subramanian M, Crompton JG, Yu Z, Roychoudhuri R, Palmer DC, Muranski P, Karoly ED, et al. Inhibiting glycolytic metabolism enhances CD8+ T cell memory and antitumor function. J Clin Invest. 2013;123:4479–4488. doi: 10.1172/JCI69589. [DOI] [PMC free article] [PubMed] [Google Scholar]
- Sukumar M, Liu J, Mehta GU, Patel SJ, Roychoudhuri R, Crompton JG, Klebanoff CA, Ji Y, Li P, Yu Z, et al. Mitochondrial Membrane Potential Identifies Cells with Enhanced Stemness for Cellular Therapy. Cell Metabolism. 2016:63–76. doi: 10.1016/j.cmet.2015.11.002. [DOI] [PMC free article] [PubMed] [Google Scholar]
- van der Windt GJ, Everts B, Chang CH, Curtis JD, Freitas TC, Amiel E, Pearce EJ, Pearce EL. Mitochondrial respiratory capacity is a critical regulator of CD8+ T cell memory development. Immunity. 2012;36:68–78. doi: 10.1016/j.immuni.2011.12.007. [DOI] [PMC free article] [PubMed] [Google Scholar]
- van der Windt GJ, O'Sullivan D, Everts B, Huang SC, Buck MD, Curtis JD, Chang CH, Smith AM, Ai T, Faubert B, et al. CD8 memory T cells have a bioenergetic advantage that underlies their rapid recall ability. Proceedings of the National Academy of Sciences of the United States of America. 2013;110:14336–14341. doi: 10.1073/pnas.1221740110. [DOI] [PMC free article] [PubMed] [Google Scholar]
- Villegas EN, Elloso MM, Reichmann G, Peach R, Hunter CA. Role of CD28 in the generation of effector and memory responses required for resistance to Toxoplasma gondii. Journal of immunology. 1999;163:3344–3353. [PubMed] [Google Scholar]
- Weiss A, Manger B, Imboden J. Synergy between the T3/antigen receptor complex and Tp44 in the activation of human T cells. Journal of immunology. 1986;137:819–825. [PubMed] [Google Scholar]
- Zhou R, Tardivel A, Thorens B, Choi I, Tschopp J. Thioredoxin-interacting protein links oxidative stress to inflammasome activation. Nat Immunol. 2010;11:136–140. doi: 10.1038/ni.1831. [DOI] [PubMed] [Google Scholar]
- Zhu X, Prasad S, Gaedicke S, Hettich M, Firat E, Niedermann G. Patient-derived glioblastoma stem cells are killed by CD133-specific CAR T cells but induce the T cell aging marker CD57. Oncotarget. 2015;6:171–184. doi: 10.18632/oncotarget.2767. [DOI] [PMC free article] [PubMed] [Google Scholar]
Associated Data
This section collects any data citations, data availability statements, or supplementary materials included in this article.