

Abstract
Previous studies indicated that glycans in serum may serve as biomarkers for diagnosis of ovarian cancer; however, it was unclear to which proteins these glycans belong. We hypothesize that protein-specific glycosylation profiles of the glycans may be more informative of ovarian cancer and can provide insight into biological mechanisms underlying glycan aberration in serum of diseased individuals. Serum samples from women diagnosed with epithelial ovarian cancer (EOC, n = 84) and matched healthy controls (n = 84) were obtained from the Gynecologic Oncology Group. Immunoglobulin (IgG, IgA, and IgM) concentrations and glycosylation profiles were quantified using multiple reaction monitoring mass spectrometry. Differential and classification analyses were performed to identify aberrant protein-specific glycopeptides using a training set. All findings were validated in an independent test set. Multiple glycopeptides from immunoglubins IgA, IgG, and IgM were found to be differentially expressed in serum of EOC patients compared with controls. The protein-specific glycosylation profiles showed their potential in the diagnosis of EOC. In particular, IgG-specific glycosylation profiles are the most powerful in discriminating between EOC case and controls. Additional studies of protein- and site-specific glycosylation profiles of immunoglobulins and other proteins will allow further elaboration on the characteristics of biological functionality and causality of the differential glycosylation in ovarian cancer and thus ultimately lead to increased sensitivity and specificity of diagnosis.
Keywords: N-glycosylation, serum, biomarker, ovarian cancer, immunoglobulin
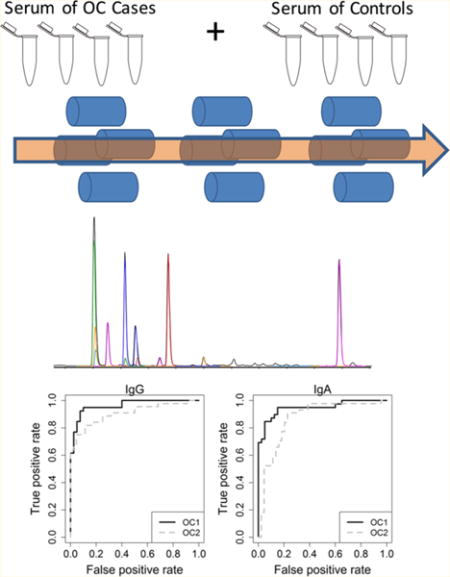
Graphical abstract
INTRODUCTION
Ovarian cancer accounts for 6% of the cancer deaths in women in the United States.1 Most of the ovarian cancer cases are diagnosed in the advanced stages (III and IV),2 where treatment is difficult and the 5 year survival rate is <30%. Detecting ovarian cancer in the early stages dramatically improves survival rates.3 Blood tests currently used in the clinic include CA-125, HE4, and Ova1, but while they find good use for disease monitoring, their applications for early detection of ovarian cancer are limited, largely due to the lack of sensitivity in early-stage disease and nonspecific elevations in nonmalignant states.4 Therefore, there is clearly a need for novel noninvasive tumor markers that provide good sensitivity and specificity in early stage disease.
Protein glycosylation has been identified as a novel field for biomarker discovery, and indeed multiple studies have observed differential glycosylation in blood profiles of patients suffering a variety of malignancies, including lung,5–7 gastric,8–10 breast,11–13 and ovarian14,15 cancers. We previously reported the great promise of serum-glycome-based profiles differentiating between epithelial ovarian cancer (EOC) and controls that could lead to a discriminatory tool for ovarian cancer detection;16 however, the biological nature and origin of the differential glycosylation remain to be elaborated on. Hence we further studied the underlying proteins attached to the glycans found to be associated with ovarian cancer. Previous studies have identified several of the differentially expressed glycans to be present on immunoglobulin G (IgG).17,18 Therefore, in the present study, we focused on the immunoglobulins for protein- and site-specific glycosylation of the glycans related to EOC.
Multiple reaction monitoring (MRM) is a mass spectrometry-based technique that allows for the accurate quantification of analytes at high sensitivity and specificity.19 Therefore, this technique is highly suitable for the analysis of compounds from more complex mixtures. We previously developed an MRM-based method for the analysis of IgG and its glycoforms directly from serum using reverse-phase UPLC–QQQ–MS instrumentation20 and have expanded it recently to the immunoglobulins IgA and IgM.21 Here we employ this MRM method for the protein- and site-specific evaluation of immunoglobulin glycosylation as indicative of epithelial ovarian cancer. This study is a follow-up of our previously reported serum glycome-based classifier for EOC16 that further examines protein- and site-specific glycosylation of the glycans composing the classifier.
EXPERIMENTAL SECTION
Patient Information
For this study, serum samples were obtained from the Gynecological Oncology Group (GOG) tissue-banking repository as described in Kim et al.16 Blood samples were collected through the GOG using a standard operating protocol for serum collection (revised 8/25/03). Whole blood was collected in a red top tube and allowed to clot for a minimum of 30 min but not longer than 3 h. The blood was then centrifuged at 3500g at 4 °C for 10 min. Serum was then aliquoted into cryotubes, frozen at −70 °C or colder, and then shipped to the GOG Tissue Bank on dry ice. Whole blood specimens were obtained from patients with epithelial ovarian cancer (EOC) and healthy female controls from multiple participating institutions along with clinical information. Preoperative, nonfasting blood samples were collected and deidentified prior to release to UC Davis. Controls were healthy female volunteers without a history of malignancy and no family history of breast or ovarian cancer. Serum samples of EOC (stages III and IV) patients were age-matched to control samples in 5 year age blocks.
Two separate sets of serum samples were analyzed in this study independently. The first set was a training (discovery) set (OC1) for discovery, which contained 40 cases and matched controls. The second set (OC2) was used as a test set for validation and was composed of 44 cases and matched controls; this set was selected and analyzed independently and did not include any samples from the training set (OC1). Patient characteristics for both sample sets are summarized in Table 1. IRB approval was obtained to use the serum samples obtained from the GOG repository in this study through the University of California, Davis Medical Center.
Table 1.
Summary Statistics of Characteristics of Samples Used in This Study
| variable | OC1 (discovery set) | OC2 (testing set) |
|---|---|---|
| total sample size, n | 80 | 88 |
| healthy controls, n (%) | 40 (50%) | 44 (50%) |
| cancer cases, n (%) | 40 (50%) | 44 (50%) |
| by stage | ||
| EOC stage III | 35 (87.5%) | 35 (79.5%) |
| EOC stage IV | 5 (12.5%) | 9 (20.5%) |
| age (y), mean ± SD | ||
| healthy controls | 51.83 ± 5.84 | 51.77 ± 6.67 |
| cancer cases | 52.0 ± 5.91 | 53.09 ± 6.72 |
| CA 125, mean ± SD | ||
| healthy controls | 19.73 ± 4.37 | 16.82 ± 11.49 |
| cancer cases | 512.46 ± 673.23 | 591.73 ± 763.32 |
Sample Preparation
Tryptic digestion of the serum samples was performed as previously described.20 In short, 87 μL of freshly made 50 mM NH4HCO3 in water was added to 2 μL of the serum samples in a 96-well plate (Thermo Scientific, Waltham, MA). The samples were then reduced and alkylated using DTT and IAA, respectively, followed by digestion using 1 μg trypsin in a 37 °C water bath for 18 h. The reaction was quenched at −20 °C, and the resulting peptide mixture was injected directly for mass spectrometric (MS) analysis without further sample cleanup or dilution.
To assess the stability of the sample preparation during the experiment, we included two standard serum samples (Sigma-Aldrich) prior and after the patient samples, respectively. Protein quantitation was performed using a calibration curve. IgG (100 μg), IgA (50 μg), and IgM (50 μg) standards were reconstituted in a single aliquot of 100 μL of NH4HCO3 solution and subsequently digested. A serial dilution of the digest was then performed to generate eight concentration levels (dilution factors = 1:2:5:10:50:100:500:1000) for absolute quantitation.
UPLC–QQQ–MS Analysis of Immunoglobulin Glycosylation
The peptide samples were analyzed by UPLC–QQQ–MS as previously described21 using an Agilent 1290 infinity LC system coupled to an Agilent 6490 triple quadrupole (QQQ) mass spectrometer (Agilent Technologies, Santa Clara, CA). Separation was performed using an Agilent Eclipse plus C18 guard column (RRHD 1.8 μm, 2.1 × 5 mm) and an Agilent Eclipse plus C18 column (RRHD 1.8 μm, 2.1 × 100 mm). 1.0 μL of sample was injected and the analytes were separated using a 20 min binary gradient consisting of solvent A of 3% acetonitrile, 0.1% formic acid, solvent B of 90% acetonitrile, and 0.1% formic acid in nanopure water (v/v) at a flow rate of 0.6 mL/min.
The MS conditions were as previously described.20,22 In brief, the MS was operated in positive mode using unit resolution. The dynamic MRM mode was performed to reduce the duty cycle, where the cycle time was fixed at 500 ms. The transitions monitored with their retention times and collision energies used were as previously described21 and are summarized in Supplementary Table ST1.
Data Evaluation
MRM results were integrated using Agilent MassHunter Quantitative Analysis B.5.0 software, and signal integrals were exported to .csv files for further evaluation. Protein concentrations were calculated based on the calibration curves, and relative glycopeptide abundances were calculated relative to the protein content as previously described.20
Statistics
All statistical analyses were conducted in R version 2.14.0 language and environment. Glycopeptides detected in fewer than 70% of samples were discarded from downstream analysis to reduce the bias that could be induced by imputation for missing not at random. Unobserved values for any remaining undetected glycopeptides below the predefined detection limit were imputed as one-half of the glycopeptide-specific minimum of the observed values.
A differential analysis was conducted to identify specific glycopeptides whose relative intensities differ between controls and tumor groups. We performed t test to identify differentially expressed glycopeptides between Stages III and IV EOC cases and controls after adjusting for age. Prior to the differential analysis, relative intensity values were log2-transformed to reduce the influence of extreme values and to meet homogeneity of variance assumptions. Significance was determined based on a permutation null distribution consisting of 10 000 permutations. False discovery rates were calculated to account for multiple testing.
We conducted a partial least-squares regression with linear discriminant analysis (PLS-LDA) to assess whether glycopeptide profiles could separate samples by cancer status. We adjusted for age by regressing intensity values on age and further scaled the residuals to variance of 1 for use in the PLS-LDA. We conducted leave-one-out cross validation (LOOCV) to identify the best number of latent components to use and estimate classification accuracy of the LDA. We evaluated using 1 through 10 latent components.
We then used the OC1 training set to develop voting classifiers, consisting of one or more glycopeptides as a multiplex panel context, for classifying samples as tumor case (EOC) or control.16 Each glycopeptide in the classifier “votes” for an unknown sample’s group membership determined by whether the sample’s intensity value is higher or lower than a threshold value to classify a sample to a cancer group. For each glycopeptide, the intensity value that yielded the highest value for Youden Index was used as the classification threshold. For glycopeptides that were up-regulated in cancer patients, samples with glycopeptide values greater than the threshold were classified as EOC case by that glycopeptide. In down-regulated glycopeptides, this classification was reversed. With multiple glycopeptides in the classifier, an unknown sample is classified as tumor case or control by each glycopeptide and classified according to the majority “vote” of the individual glycopeptides composed of the classifier. When there is an even number of glycopeptides in the classifier some samples can have an ambiguous classification. Therefore, we used a modified accuracy that allows for ambiguous classification of some samples (i.e., ties in voting that could occur when using an even number of glycopeptides in the classifier). In our accuracy estimate, a sample’s classification score (Si) is
and the modified accuracy of a classifier is calculated as .
To construct and evaluate multiplex classifiers, we added the glycopeptide with the highest individual accuracy to the classifier first. Glycopeptides were then sequentially added to the classifier according to which glycopeptide yielded the highest accuracy in combination with glycopeptides already included in the classifier. Glycopeptides were added until all glycopeptides under consideration had entered the classifier. If several glycopeptides yielded the same accuracy, the glycopeptide least correlated with glycopeptides already in the classifier was added. At each step, we constructed and assessed the accuracy of the classifier through LOOCV. Classifiers developed with the OC1 training set were then “locked in place” and applied to the independent OC2 test set samples not used during training to estimate the performance accuracy of the classifiers.
RESULTS
Glycopeptide analysis was performed by multiple reaction monitoring on a triple quadrupole mass spectrometer (QQQ–MS). The samples in the training set (OC1) were first analyzed along with two standard serum samples for quality control: one as the first run sample and one as the last. Consistent results were obtained for the standard samples, indicating that the MS analysis was performed invariant during the course of the experiment. One patient sample showed abnormally high IgG peptide responses that deviated from other samples and was therefore excluded from statistical analysis.
Glycopeptide Signatures of Ovarian Cancer
To assess whether the global glycopeptide signatures differentiate between serum samples from EOC patients and controls, we first looked at aberrant patterns of immunoglobulin-specific glycopeptides by performing PLS-LDA analysis for each of the immunoglobulins, IgG, IgA, and IgM, individually. As shown in Figure 1, the results indicate that the signature of IgG glycopeptides best separated cancer samples from controls (91% of the samples were correctly classified for their true disease state), followed by IgA glycopeptides (85% correct classification). The IgM seems to be least differential between cancer versus control with 76% accurate classification, indicating a more limited role of IgM in cancer immunology.
Figure 1.
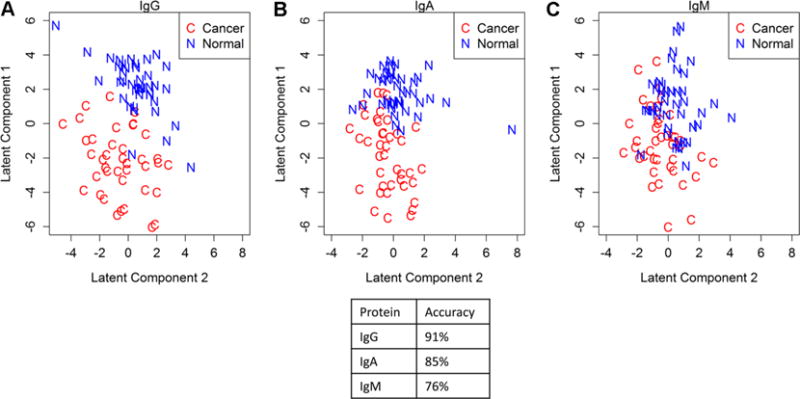
PLS-LDA analysis of the glycopeptides for the immunoglobulin IgG (A), IgA (B), and IgM (C) in the OC1 discovery set. Clear separation between the EOC cases (n = 40) and the controls (n = 40) is observed for IgG and IgA, while the separation between the disease groups is less for IgM.
Identification of Aberrant Glycopeptides Associated with Ovarian Cancer
The PLS analysis showed that the serum glycopeptide signatures were effective at discriminating EOC versus control. Hence, we performed differential analysis to identify glycopeptides that were most responsible for distinguishing ovarian cancer and control. For IgG, levels of 17 underlying glycopeptides as well as the overall IgG and IgG1 peptide concentrations differed significantly (FDR < 0.05) between EOC cases and controls (Figure 2). Thirteen glycopeptides originating from IgA differed significantly between EOC cases and controls, and for IgM, 9 glycopeptides as well as the overall peptide concentrations were significantly different (Figure 2).
Figure 2.
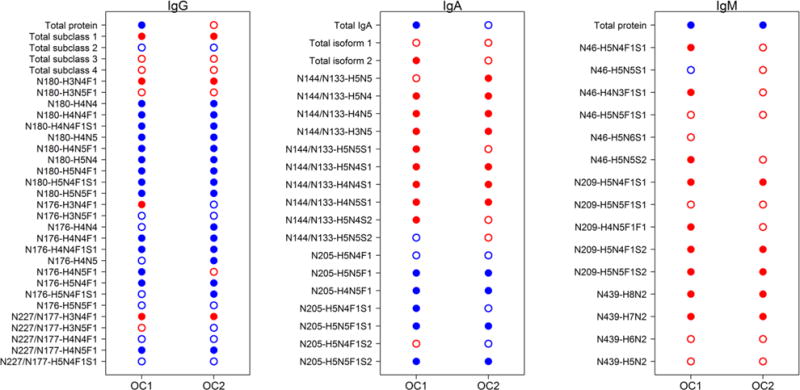
Differential analysis of peptide and glycopeptide variables from immunoglobulins in EOC. Closed dots indicate significantly different abundance levels between EOC cases and healthy controls, while open dots indicate no significance was achieved at the false discovery rate (FDR) < 0.05. Red dots indicate increased levels in EOC cases compared with controls, while blue dots indicate decreased levels in EOC compared with controls.
Potential of IgG, IgA, and IgM as Biomarkers for EOC
Glycopeptides of which the abundances were found to be significantly different in the previous analyses suggested considerable differences in glycosylation fingerprints between EOC and control. Thus, we hypothesized that those protein-specific glycopeptides could serve as a good biomarker for EOC detection, and we thus tested their diagnostic merit for each of the immunoglobulin proteins separately. Within a LOOCV framework, classification thresholds were calculated for each of the variables (both peptides and glycopeptides) and the left out sample classified. The classification rate (i.e., percentage of samples correctly classified for their disease status), sensitivity, and specificity were then calculated over the entire data set. For each of the proteins, the variables were sorted according to their individual classification performance. The highest performance (88.6% classification rate, AUC = 0.94) was achieved by a glycopeptide from IgG1 with glycan moiety H5N5F1 (Figure 3A). The top three best performing glycopeptides from IgG all provide AUC scores larger than 0.9, which is better than any of the IgA and IgM glycopeptides. For IgA, the highest performance achieved by a single glycopeptide was 78.8% (AUC = 0.81) for glycan moiety H4N5 at IgA1 site N144/IgA2 site N131 (Figure 3B), while the highest performance achieved by IgM was 75% (AUC = 0.80) for glycan moiety H4N5F1S1 at site N209 (Figure 3C). The classification performance and AUCs of the individual peptides and glycopeptides are provided in the Supplementary Tables ST2–ST4 for IgG, IgA, and IgM, respectively.
Figure 3.
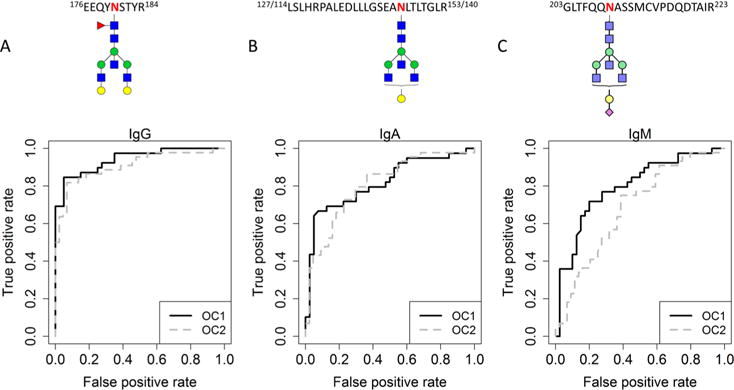
ROC curves for the best performing individual glycopeptides of all three immunoglobulins in the OC1 discovery set and OC2 test set. Curves are shown for IgG1-H5N5F1 (A), IgA N144/131 H4N5 (B), and IgM N209 H4N5F1S1 (C). The ROC curve for the OC1 discovery set is shown in solid black, while the ROC curve for the OC2 test set is shown in dotted gray. Glycan symbol key: blue square is N-acetylglucosamine, green ball is mannose, yellow ball is galactose, red triangle is fucose, and purple diamond is N-acetylneuraminic acid. The glycan structures presented here are putative structures.
To further assess whether combining multiple glycopeptides would improve the classification performance, we constructed a multiplex classifier (i.e., a composite of multiple glycopeptides) for each immunoglobulin individually. The highest classification of 93.7% was obtained with the nine most informative glycopeptides (Figure 4A), but seven (accuracy of 92.4%) and 5 (91.1%) glycopeptides originating from IgG provided similar results. For IgA, the highest classification of 87.5% was obtained with seven glycopeptide and peptide features (Figure 4B), but a multiplexed classifier with only three glycopeptides already provided a classification rate of 86.3%. The best performance for IgM was obtained using three or five peptides and glycopeptides (Figure 4C, for the classifier with three peptides), with performance accuracy of 80.0% for both.
Figure 4.
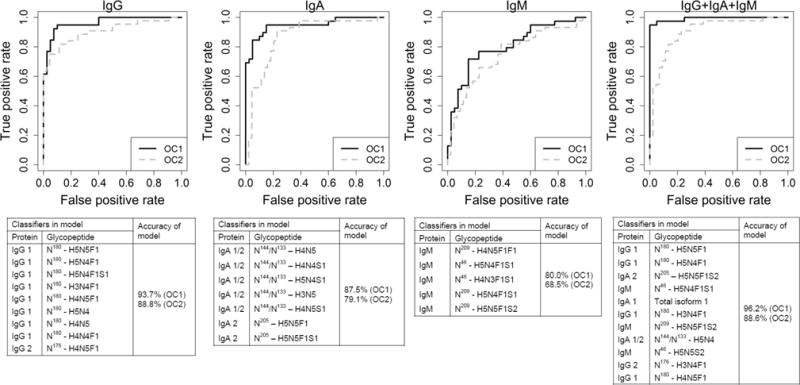
ROC curves for the four multiclassifier models developed. Curves are shown for IgG, IgA, IgM, and the combined immunoglobulins, respectively. The ROC curve for the OC1 discovery set is shown in solid black, while the ROC curve for the OC2 test set is shown in dotted gray.
As expected from the previous results, the most sensitive immunological response to the ovarian cancer appeared to be the IgG response, while IgA and IgM would provide a milder response. This is reflected in the accuracies of prediction reported per protein; however, we still investigated the potential use of a multiplexed classifier, as the different Ig’s could reflect alternative or complementary aspects of the immune response. One sample had been excluded from the OC1 IgG analysis, and for the combined classifier development, this sample was excluded completely. All glycoprotein variables that were statistically significant in the differential analysis of OC1 (see Figure 2) were considered for a multiplexed classifier. While the best performing individual glycopeptide (IgG1 – H5N5F1) already performed very well (88.6%), a multiplexed classifier containing 11 glycoprotein variables improved the performance further with an accuracy of 96.2% (Figure 4D). The performance metrics of the glycoprotein variables are shown in Supplementary Table ST5.
Validation Study Using OC2-Independent Test Set
Because these data strongly implicate the potential of protein-specific glycopeptides as a basis for further study of glycan-based biomarkers in ovarian cancer, we validated the findings in an independent test set of samples analyzed separately at a later time. Differential analysis was performed on the test set, OC2, to evaluate whether the immunoglobulin glycopeptide signature was reproducible and consistent in other samples. Abundance levels of 18 glycopeptides of IgG as well as the IgG1 peptide were significantly different in this test set (Figure 2). Of these significant, 15 glycopeptides and the IgG1 peptide were consistently differentially regulated in both the training and the test set (Figure 2). For IgA, levels of 11 glycopeptides were significantly different between OC cases and controls in the OC2 set. Of these glycopeptides, 10 were consistently found differential in both the training and test set. Five glycopeptides and the overall peptide concentration of IgM were significantly differentially abundant in the sera of EOC patients compared to the control sera. Comparison of the IgM results for the training and the test set indicated that five glycopeptides and the overall peptide were consistently significant in both sample sets (Figure 2). This good concordance of the differential results in the two independent sets of samples indicates good reproducibility of the results.
While good concordance of the OC1 training and OC2 test sets was observed in the differential analysis, we evaluated whether the performance of the classifiers developed using the training set held up in the test set. Classification performance was estimated for each of the glycopeptides using the threshold previously developed in the training set. For IgG, the best performance of 88% was obtained with glycopeptides H5N5F1 and H4N5F1, both from IgG1. This was very similar to the OC1 set. For IgA and IgM, however, the best performing glycopeptides in OC1 had lower levels of accuracy in OC2. The best performing glycopeptide for IgA was H4N4S1 IgA1/2 site N144/131, while glycopeptide H4N5 IgA1/2 site N144/131, which was best performing in the OC1 training set, achieved the fourth best in the OC2 test set with an accuracy of 72%. For IgM the best performing glycopeptide in the OC2 set was H5N4F1S2 at site N209 with an accuracy of 72%, but the best achieving glycopeptide in OC1, which was H4N5F1S1 at N209, provided an accuracy of 60% in the OC2 set.
We then applied the developed multiplexed classifiers to the OC2 test set. First, the protein-specific multiplexed classifiers were assessed for each of the proteins. For IgG, when the best classifier of nine glycopeptide variables (see Table ST1) developed in OC1 was applied to the OC2 test set, an accuracy of 88.8% was achieved (Figure 4A). When the best classifier identified for IgA in the OC1 discovery set that contained seven glycopeptide variables (see Table ST2) was applied to the OC2 set, an accuracy of 79.1% was achieved (Figure 4B). Interestingly, again a classifier containing just three glycoprotein variables also performed very well (accuracies of 86.3% in OC1 and 78.0% in OC2). For IgM, the best accuracy in OC1 (80.0%) was obtained using three or five glycoprotein variables in the classifier (see Table ST3). When this model was applied to OC2, the best accuracy was obtained using five glycoprotein variables at an accuracy of 68.5% (Figure 4C).
We also assessed the multiplexed classifier developed using the combined immunoglobulin data for its discriminating value in the OC2 test set. When the best classifier achieved by 11 glycoprotein variables in OC1 with 96.2% accuracy was applied to the OC2 set, an accuracy of 88.6% was achieved in the test set (Figure 4D). Interestingly, the accuracies of classification for the multi-immunoglobulin classifiers in the OC2 test set were not higher than the accuracies achieved by the IgG-specific multiplexed classifier, indicating that analyzing glycosylation profiles of IgA and IgM in addition to IgG does not provide additional value for diagnostic purposes in EOC.
Comparison of the Performance of Glycopeptide Classifiers to CA-125
CA-125 is currently the most widely applied biomarker for the detection of EOC; however, it has limited sensitivity, especially in early-stage disease. While our current study includes samples only from late-stage patients in which CA-125 is rather effective (accuracy = 91.1% in the discovery set, 88.2% in the test set), we assessed whether immunoglobulin glycopeptides may provide additional predictive value. When CA-125 was added to the best performing multiclassifier models for the individual Ig proteins and the multiple protein combination (see Supplementary Tables ST2–4 or Figure 4), improved and similar accuracies were obtained for the multi-immunoglobulin classifier and the IgG classifier (Table 2). These combination models were then applied to the OC2 test set, and the obtained accuracies are shown in Table 2. The best accuracy was obtained by the IgG–CA-125 combination (89.4%), indicating that combining IgG glycosylation profiles with CA-125 could improve accuracy of EOC prediction even in these late-stage OC patients. Further research is needed to evaluate the additive potential of IgG glycosylation in early-stage patients.
Table 2.
Performance of the Immunoglobulin Multiplex Classifier Models in Combination with CA-125
| accuracy | sensitivity | specificity | |
|---|---|---|---|
| CA-125 only | |||
| OC1 | 91.1 | 84.6 | 97.5 |
| OC2 | 88.2 | 90.5 | 86.0 |
| IgG+CA-125 | |||
| OC1 | 91.1 | 87.2 | 95.0 |
| OC2 | 89.4 | 87.2 | 95.0 |
| IgA+CA-125 | |||
| OC1 | 89.9 | 84.6 | 95.0 |
| OC2 | 83.5 | 73.8 | 93.0 |
| IgM+CA-125 | |||
| OC1 | 84.8 | 76.9 | 92.5 |
| OC2 | 83.5 | 83.3 | 83.7 |
| IgG+IgA+IgM+CA-125 | |||
| OC1 | 96.2 | 92.3 | 100.0 |
| OC2 | 87.0 | 88.1 | 86.0 |
DISCUSSION
We applied multiple reaction monitoring on a QQQ–MS instrument for the first time for the identification of protein-specific differential glycosylation patterns in serum of EOC patients. The glycopeptide values were normalized to the total protein content to eliminate differential results due to protein concentration. Multiple glycopeptides from all three immunoglobulins studied (IgA, IgG, and IgM) were shown to be aberrant in EOC patients compared with healthy controls in this work.
For IgG, 15 glycopeptides were found to be associated with EOC. Levels of glycopeptides carrying a nongalactosylated H3N4F1 glycan moiety were consistently increased, while levels of glycopeptides carrying mono- and digalactosylated glycan moieties were typically decreased in EOC patients compared with healthy controls (Figure 2). These results are consistent with previous studies, which have found the level of galactosylation to be decreased on IgG in sera of patients with several types of malignancies, including ovarian cancer.6,14,15,23
Levels of 10 N-glycopeptides from IgA were aberrant in EOC compared with healthy control. Levels of several glycopeptides carrying nonfucosylated biantennary glycans with no or one sialic acid at site N144/131 on IgA1/2, respectively, were increased, while levels of their disialylated glycopeptides were not consistently significantly altered in relation to EOC (Figure 2). On IgA2 site N205, levels of glycopeptides carrying biantennary glycans with a bisecting GlcNAc were typically decreased, irrespective of their level of sialylation, while glycopeptides not carrying a bisecting GlcNAc were not affected. To our best knowledge, anomalies of IgA N-glycopeptides have not yet been described in sera of cancer patients, although aberrantly O-glycosylated IgA carrying the Tn antigen was recently described in breast tumor tissue.24
Levels of five glycopeptides from IgM were consistently increased in sera of EOC patients. Glycopeptides carrying two high-mannose type glycan structures (H7N2 and H8N2) were differentially expressed at site N439, which carries only high-mannose type structures. At site N209 glycopeptide with biantennary mono- or disialylated glycan moieties both with and without bisecting GlcNAc were increased (Figure 2). In serum, IgM glycosylation has not been found to relate to cancer, but differentially glycosylated IgM, particularly with high-mannose type glycans, has been observed in B-cells in CLL.25
It is well known that the different immunoglobulins reflect different components of the humoral immune system. The initial or primary antibody response to an antigen is provided by IgM. The immune system then converts the humoral response to IgG, which is the long-acting immune response—more robust, with greater long-term memory associated with antigen rechallenge. IgA is a response of the mucosal immune system and is locally to mucosal surfaces such as the GI tract, or bronchial tract. Therefore, it is to be expected that the most robust immunological response to the ovarian cancer would be the IgG response, while IgA and IgM would provide a milder response. This hypothesis is in concordance with our results, which indicate that the most of discriminatory power of EOC can be achieved using IgG glycosylation profiles alone, without the addition of additional Ig glycosylation profiles.
Immunoglobulins play an important role in the adaptive immune system. Their glycosylation, especially of the Fc region of IgG, has been associated with several physiological states,26 including autoimmune diseases,27–29 upon vaccination30 and aging.31–33 Studies have also addressed differential glycosylation of IgG in ovarian,15,34 lung,6 and gastric9,10 cancers, providing similar differential glycosylation results as reported here. It has been proposed that the decrease in galactosylation observed on IgG in cancer patients is part of the host response to the presence of the tumor.9 This would imply that the pattern of the differentially expressed glycans on immunoglobulins may reflect an inflammatory response to the ovarian cancer and thus might serve as a surrogate biomarker indicative of the presence of ovarian cancer; however, it should be noted that because immunoglobulins are transported through the circulation, their differential glycosylation also might reflect pathophysiology at the primary tumor site, for example, by binding to carbohydrate-binding proteins expressed at the cell surface such as the galectins.35 It has also been observed that altered glycosylation of IgA has an effect on receptor binding and clearance36 and differential glycosylation of IgG is known to affect Fc receptor binding and other effector functions.37,38
This study allows us to compare the previous results obtained in the total serum glycomics analysis16 to the immunoglobulin specific glycosylation results obtained in this study. The total glycome results were total-glycan-quantity-normalized and thus did not take the absolute protein amount into account. The results obtained in this study were normalized to the individual protein amount; therefore, direct comparisons are not completely applicable on absolute scales; however, the comparisons help in studying the origin of the differential glycan profile previously obtained. Interestingly, there was a large overlap between the glycans found to be significantly altered on IgG1 and the total glycome analysis. Glycan compositions H4N4F1, H5N4, H5N4F1, H4N5F1, H5N5F1, and H5N4F1S1 were all previously shown to be decreased in sera of EOC patients and were also significantly decreased on IgG1; however, correlations are less clear for the other less abundant proteins, such as IgA. These results strongly suggest that the total glycome profile is largely dominated by the highest abundance proteins and that protein- and site-specific glycosylation profiles will likely provide further insights into protein specific alterations in glycosylation of the glycans related to EOC and may serve as more specific biomarkers for EOC and its process.
In this study, we examined differentially glycosylated peptides from immunoglobulins attached to the glycans found to be associated with EOC by employing MRM. This strategy using MRM for accurate semiquantitation is feasible for high-abundance proteins but may be adapted for lower abundance peptides using stable isotope standard capture with anti-peptide antibodies (SISCAPA) or other protein enrichment techniques. Also, this study shows the great potential of protein- and site-specific glycosylation profiles for the use of diagnosis of ovarian cancer.
Supplementary Material
Supplementary Figure SF1. Stability of method used. Supplementary Table ST1. Characteristics of the transitions monitored in this study. Supplementary Table ST2. Classification metrics for peptides and glycopeptides from IgG. Supplementary Table ST3. Classification metrics for each peptide/glycopeptide from IgM of which levels were significantly different for EOC in the discovery set. Supplementary Table ST4. Entry order and classification metrics for each peptide/glycopeptide from all three proteins of which levels were significantly different for EOC in the discovery set. Supplementary Table ST5. Entry order and classification metrics for peptides and glycopeptides from all three proteins. (PDF)
Supplementary Table ST6. All data and metadata used for this publication. (XLSX)
Acknowledgments
We acknowledge the receipt of serum samples from the GOG tissue-banking repository. This work was supported by the Ovarian Cancer Research Fund (to G.L.).
Footnotes
Supporting Information
The Supporting Information is available free of charge on the ACS Publications website at DOI: 10.1021/acs.jproteome.5b01071.
Notes
The authors declare no competing financial interest.
References
- 1.Siegel R, Naishadham D, Jemal A. Cancer statistics, 2012. Ca-Cancer J Clin. 2012;62(1):10–29. doi: 10.3322/caac.20138. [DOI] [PubMed] [Google Scholar]
- 2.Goodman MT, Howe HL, Tung KH, Hotes J, Miller BA, Coughlin SS, Chen VW. Incidence of ovarian cancer by race and ethnicity in the United States, 1992–1997. Cancer. 2003;97(10 Suppl):2676–85. doi: 10.1002/cncr.11349. [DOI] [PubMed] [Google Scholar]
- 3.McPhail S, Johnson S, Greenberg D, Peake M, Rous B. Stage at diagnosis and early mortality from cancer in England. Br J Cancer. 2015;112(Suppl 1):S108–15. doi: 10.1038/bjc.2015.49. [DOI] [PMC free article] [PubMed] [Google Scholar]
- 4.Moore RG, Jabre-Raughley M, Brown AK, Robison KM, Miller MC, Allard WJ, Kurman RJ, Bast RC, Skates SJ. Comparison of a novel multiple marker assay vs the Risk of Malignancy Index for the prediction of epithelial ovarian cancer in patients with a pelvic mass. Am J Obstet Gynecol. 2010;203(3):228 e1–6. doi: 10.1016/j.ajog.2010.03.043. [DOI] [PMC free article] [PubMed] [Google Scholar]
- 5.Arnold JN, Saldova R, Galligan MC, Murphy TB, Mimura-Kimura Y, Telford JE, Godwin AK, Rudd PM. Novel glycan biomarkers for the detection of lung cancer. J Proteome Res. 2011;10(4):1755–64. doi: 10.1021/pr101034t. [DOI] [PubMed] [Google Scholar]
- 6.Ruhaak LR, Nguyen UT, Stroble C, Taylor SL, Taguchi A, Hanash SM, Lebrilla CB, Kim K, Miyamoto S. Enrichment strategies in glycomics-based lung cancer biomarker development. Proteomics: Clin Appl. 2013;7(9–10):664–76. doi: 10.1002/prca.201200131. [DOI] [PMC free article] [PubMed] [Google Scholar]
- 7.Vasseur JA, Goetz JA, Alley WR, Jr, Novotny MV. Smoking and Lung Cancer-induced Changes in N-Glycosylation of Blood Serum Proteins. Glycobiology. 2012;22:1684. doi: 10.1093/glycob/cws108. [DOI] [PMC free article] [PubMed] [Google Scholar]
- 8.Ozcan S, Barkauskas DA, Renee Ruhaak L, Torres J, Cooke CL, An HJ, Hua S, Williams CC, Dimapasoc LM, Han Kim J, Camorlinga-Ponce M, Rocke D, Lebrilla CB, Solnick JV. Serum glycan signatures of gastric cancer. Cancer Prev Res. 2014;7(2):226–35. doi: 10.1158/1940-6207.CAPR-13-0235. [DOI] [PMC free article] [PubMed] [Google Scholar]
- 9.Bones J, Byrne JC, O’Donoghue N, McManus C, Scaife C, Boissin H, Nastase A, Rudd PM. Glycomic and glycoproteomic analysis of serum from patients with stomach cancer reveals potential markers arising from host defense response mechanisms. J Proteome Res. 2011;10(3):1246–65. doi: 10.1021/pr101036b. [DOI] [PubMed] [Google Scholar]
- 10.Kodar K, Stadlmann J, Klaamas K, Sergeyev B, Kurtenkov O. Immunoglobulin G Fc N-glycan profiling in patients with gastric cancer by LC-ESI-MS: relation to tumor progression and survival. Glycoconjugate J. 2012;29(1):57–66. doi: 10.1007/s10719-011-9364-z. [DOI] [PubMed] [Google Scholar]
- 11.Kyselova Z, Mechref Y, Kang P, Goetz JA, Dobrolecki LE, Sledge GW, Schnaper L, Hickey RJ, Malkas LH, Novotny MV. Breast cancer diagnosis and prognosis through quantitative measurements of serum glycan profiles. Clin Chem. 2008;54(7):1166–1175. doi: 10.1373/clinchem.2007.087148. [DOI] [PubMed] [Google Scholar]
- 12.Abd Hamid UM, Royle L, Saldova R, Radcliffe CM, Harvey DJ, Storr SJ, Pardo M, Antrobus R, Chapman CJ, Zitzmann N, Robertson JF, Dwek RA, Rudd PM. A strategy to reveal potential glycan markers from serum glycoproteins associated with breast cancer progression. Glycobiology. 2008;18(12):1105–18. doi: 10.1093/glycob/cwn095. [DOI] [PubMed] [Google Scholar]
- 13.de Leoz ML, Young LJ, An HJ, Kronewitter SR, Kim J, Miyamoto S, Borowsky AD, Chew HK, Lebrilla CB. High-mannose glycans are elevated during breast cancer progression. Mol Cell Proteomics. 2011;10(1):M110 002717. doi: 10.1074/mcp.M110.002717. [DOI] [PMC free article] [PubMed] [Google Scholar]
- 14.Saldova R, Royle L, Radcliffe CM, Abd Hamid UM, Evans R, Arnold JN, Banks RE, Hutson R, Harvey DJ, Antrobus R, Petrescu SM, Dwek RA, Rudd PM. Ovarian cancer is associated with changes in glycosylation in both acute-phase proteins and IgG. Glycobiology. 2007;17(12):1344–1356. doi: 10.1093/glycob/cwm100. [DOI] [PubMed] [Google Scholar]
- 15.Alley WR, Jr, Vasseur JA, Goetz JA, Svoboda M, Mann BF, Matei DE, Menning N, Hussein A, Mechref Y, Novotny MV. N-linked glycan structures and their expressions change in the blood sera of ovarian cancer patients. J Proteome Res. 2012;11(4):2282–300. doi: 10.1021/pr201070k. [DOI] [PMC free article] [PubMed] [Google Scholar]
- 16.Kim K, Ruhaak LR, Nguyen UT, Taylor SL, Dimapasoc L, Williams C, Stroble C, Ozcan S, Miyamoto S, Lebrilla CB, Leiserowitz GS. Evaluation of glycomic profiling as a diagnostic biomarker for epithelial ovarian cancer. Cancer Epidemiol, Biomarkers Prev. 2014;23(4):611–21. doi: 10.1158/1055-9965.EPI-13-1073. [DOI] [PMC free article] [PubMed] [Google Scholar]
- 17.Aldredge D, An HJ, Tang N, Waddell K, Lebrilla CB. Annotation of a serum N-glycan library for rapid identification of structures. J Proteome Res. 2012;11(3):1958–68. doi: 10.1021/pr2011439. [DOI] [PMC free article] [PubMed] [Google Scholar]
- 18.Wuhrer M, Stam JC, van de Geijn FE, Koeleman CA, Verrips CT, Dolhain RJ, Hokke CH, Deelder AM. Glycosylation profiling of immunoglobulin G (IgG) subclasses from human serum. Proteomics. 2007;7(22):4070–81. doi: 10.1002/pmic.200700289. [DOI] [PubMed] [Google Scholar]
- 19.Kim JY, Oh D, Kim SK, Kang D, Moon MH. Isotope-coded carbamidomethylation for quantification of N-glycoproteins with online microbore hollow fiber enzyme reactor-nanoflow liquid chromatography-tandem mass spectrometry. Anal Chem. 2014;86(15):7650–7. doi: 10.1021/ac501544r. [DOI] [PubMed] [Google Scholar]
- 20.Hong Q, Lebrilla CB, Miyamoto S, Ruhaak LR. Absolute quantitation of immunoglobulin G and its glycoforms using multiple reaction monitoring. Anal Chem. 2013;85(18):8585–93. doi: 10.1021/ac4009995. [DOI] [PMC free article] [PubMed] [Google Scholar]
- 21.Hong Q, Ruhaak LR, Stroble C, Parker E, Huang J, Maverakis E, Lebrilla CB. A Method for Comprehensive Glycosite-Mapping and Direct Quantitation of Serum Glycoproteins. J Proteome Res. 2015;14(12):5179–92. doi: 10.1021/acs.jproteome.5b00756. [DOI] [PMC free article] [PubMed] [Google Scholar]
- 22.Hong Q, Ruhaak LR, Totten SM, Smilowitz JT, German JB, Lebrilla CB. Label-Free Absolute Quantitation of Oligosaccharides Using Multiple Reaction Monitoring. Anal Chem. 2014;86(5):2640–2647. doi: 10.1021/ac404006z. [DOI] [PMC free article] [PubMed] [Google Scholar]
- 23.Kanoh Y, Mashiko T, Danbara M, Takayama Y, Ohtani S, Imasaki T, Abe T, Akahoshi T. Analysis of the oligosaccharide chain of human serum immunoglobulin g in patients with localized or metastatic cancer. Oncology. 2004;66(5):365–70. doi: 10.1159/000079484. [DOI] [PubMed] [Google Scholar]
- 24.Welinder C, Baldetorp B, Blixt O, Grabau D, Jansson B. Primary breast cancer tumours contain high amounts of IgA1 immunoglobulin: an immunohistochemical analysis of a possible carrier of the tumour-associated Tn antigen. PLoS One. 2013;8(4):e61749. doi: 10.1371/journal.pone.0061749. [DOI] [PMC free article] [PubMed] [Google Scholar]
- 25.Krysov S, Potter KN, Mockridge CI, Coelho V, Wheatley I, Packham G, Stevenson FK. Surface IgM of CLL cells displays unusual glycans indicative of engagement of antigen in vivo. Blood. 2010;115(21):4198–205. doi: 10.1182/blood-2009-12-254847. [DOI] [PubMed] [Google Scholar]
- 26.Huhn C, Selman MH, Ruhaak LR, Deelder AM, Wuhrer M. IgG glycosylation analysis. Proteomics. 2009;9(4):882–913. doi: 10.1002/pmic.200800715. [DOI] [PubMed] [Google Scholar]
- 27.Parekh RB, Dwek RA, Sutton BJ, Fernandes DL, Leung A, Stanworth D, Rademacher TW, Mizuochi T, Taniguchi T, Matsuta K;, et al. Association of rheumatoid arthritis and primary osteoarthritis with changes in the glycosylation pattern of total serum IgG. Nature. 1985;316(6027):452–7. doi: 10.1038/316452a0. [DOI] [PubMed] [Google Scholar]
- 28.Selman MHJ, Niks EH, Titulaer MJ, Verschuuren JJGM, Wuhrer M, Deelder AM. IgG Fc N-Glycosylation Changes in Lambed-Eaton Myasthenic Syndrome and Myasthenia Gravis. J Proteome Res. 2011;10(1):143–152. doi: 10.1021/pr1004373. [DOI] [PubMed] [Google Scholar]
- 29.Bondt A, Selman MH, Deelder AM, Hazes JM, Willemsen SP, Wuhrer M, Dolhain RJ. Association between galactosylation of immunoglobulin G and improvement of rheumatoid arthritis during pregnancy is independent of sialylation. J Proteome Res. 2013;12(10):4522–31. doi: 10.1021/pr400589m. [DOI] [PubMed] [Google Scholar]
- 30.Selman MH, de Jong SE, Soonawala D, Kroon FP, Adegnika AA, Deelder AM, Hokke CH, Yazdanbakhsh M, Wuhrer M. Changes in antigen-specific IgG1 Fc N-glycosylation upon influenza and tetanus vaccination. Mol Cell Proteomics. 2012;11(4):M111 014563. doi: 10.1074/mcp.M111.014563. [DOI] [PMC free article] [PubMed] [Google Scholar]
- 31.Shikata K, Yasuda T, Takeuchi F, Konishi T, Nakata M, Mizuochi T. Structural changes in the oligosaccharide moiety of human IgG with aging. Glycoconjugate J. 1998;15(7):683–689. doi: 10.1023/a:1006936431276. [DOI] [PubMed] [Google Scholar]
- 32.Yamada E, Tsukamoto Y, Sasaki R, Yagyu K, Takahashi N. Structural changes of immunoglobulin G oligosaccharides with age in healthy human serum. Glycoconjugate J. 1997;14(3):401–5. doi: 10.1023/a:1018582930906. [DOI] [PubMed] [Google Scholar]
- 33.Ruhaak LR, Uh HW, Beekman M, Koeleman CA, Hokke CH, Westendorp RG, Wuhrer M, Houwing-Duistermaat JJ, Slagboom PE, Deelder AM. Decreased levels of bisecting GlcNAc glycoforms of IgG are associated with human longevity. PLoS One. 2010;5(9):e12566. doi: 10.1371/journal.pone.0012566. [DOI] [PMC free article] [PubMed] [Google Scholar]
- 34.Qian Y, Wang Y, Zhang X, Zhou L, Zhang Z, Xu J, Ruan Y, Ren S, Xu C, Gu J. Quantitative Analysis of Serum IgG Galactosylation Assists Differential Diagnosis of Ovarian Cancer. J Proteome Res. 2013;12:4046. doi: 10.1021/pr4003992. [DOI] [PubMed] [Google Scholar]
- 35.Carlsson MC, Balog CI, Kilsgard O, Hellmark T, Bakoush O, Segelmark M, Ferno M, Olsson H, Malmstrom J, Wuhrer M, Leffler H. Different fractions of human serum glycoproteins bind galectin-1 or galectin-8, and their ratio may provide a refined biomarker for pathophysiological conditions in cancer and inflammatory disease. Biochim Biophys Acta, Gen Subj. 2012;1820(9):1366–72. doi: 10.1016/j.bbagen.2012.01.007. [DOI] [PubMed] [Google Scholar]
- 36.Basset C, Devauchelle V, Durand V, Jamin C, Pennec YL, Youinou P, Dueymes M. Glycosylation of immunoglobulin A influences its receptor binding. Scand J Immunol. 1999;50(6):572–9. doi: 10.1046/j.1365-3083.1999.00628.x. [DOI] [PubMed] [Google Scholar]
- 37.Walker MR, Lund J, Thompson KM, Jefferis R. Aglycosylation of human IgG1 and IgG3 monoclonal antibodies can eliminate recognition by human cells expressing Fc gamma RI and/or Fc gamma RII receptors. Biochem J. 1989;259(2):347–53. doi: 10.1042/bj2590347. [DOI] [PMC free article] [PubMed] [Google Scholar]
- 38.Naegeli A, Michaud G, Schubert M, Lin CW, Lizak C, Darbre T, Reymond JL, Aebi M. Substrate specificity of cytoplasmic N-glycosyltransferase. J Biol Chem. 2014;289(35):24521–32. doi: 10.1074/jbc.M114.579326. [DOI] [PMC free article] [PubMed] [Google Scholar]
Associated Data
This section collects any data citations, data availability statements, or supplementary materials included in this article.
Supplementary Materials
Supplementary Figure SF1. Stability of method used. Supplementary Table ST1. Characteristics of the transitions monitored in this study. Supplementary Table ST2. Classification metrics for peptides and glycopeptides from IgG. Supplementary Table ST3. Classification metrics for each peptide/glycopeptide from IgM of which levels were significantly different for EOC in the discovery set. Supplementary Table ST4. Entry order and classification metrics for each peptide/glycopeptide from all three proteins of which levels were significantly different for EOC in the discovery set. Supplementary Table ST5. Entry order and classification metrics for peptides and glycopeptides from all three proteins. (PDF)
Supplementary Table ST6. All data and metadata used for this publication. (XLSX)