Figure 1.
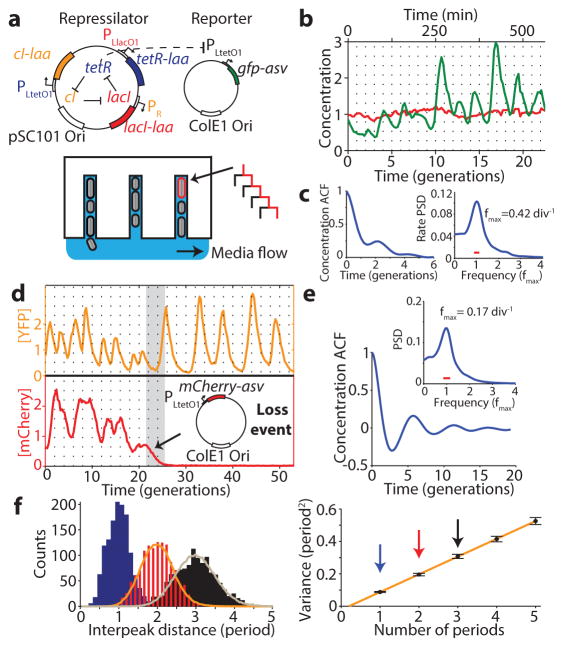
Reducing reporter interference. a) Schematics of the original repressilator plasmids as described in text and microfluidic device where E. coli cells are diffusively fed in growth channels and daughters eventually are washed away. b) Typical time trace of a single cell for original repressilator (NDL332). The GFP concentration (green trace) oscillates noisily while a constantly expressed RFP (red trace) stays constant. Both traces were normalized to their means. c) Autocorrelation functions (ACF) and power spectral densities (PSD) were calculated over the whole population (2,706 generations) and demonstrate oscillations with a mean period of 2.4 average division time. d) Top: oscillations are more regular when the reporter is expressed on the repressilator plasmid rather than on a separate high-copy plasmid (Extended Data Fig. 2). Some cells irreversible shift period from ~2.5 to ~5.5 generations. Bottom: The period change was invariably connected to a loss of the separate mCherry-ASV-expressing reporter plasmid. Analysis of e.g. empty plasmid vectors, various reporter proteins and reporter degradation tags, and circuits with and without repressor degradation (SI §3.1 and 3.3) show that the interference was caused by the reporter ssrA degradation tag where the last three amino acids were substituted to ASV. e) ACF and PSD for the YFP expressing repressilator without separate reporter plasmid (LPT25), calculated over all 8,694 total cell divisions observed. Average period was 5.6 generations. Reporter protein close to fluorescence detection limit at troughs, and the actively degraded repressors should be much lower yet. The PSD was normalized by peak frequency, with width of the window function indicated by red line. f) Histograms of interpeak distances for one, two and three periods in blue, red and black respectively. Orange and grey lines were obtained by summing two or three samples (respectively) from the blue distribution. Consecutive periods are thus independent. Panel on right shows that the variance in period grows linearly with the number of periods elapsed (LPT25).

