

Abstract
Purpose
To characterize the density and distribution of the radial peripapillary capillary plexus (RPCP) and its relationship with retinal nerve fiber layer (NFL) thickness in healthy subjects.
Methods
Using spectral-domain optical coherence tomography (OCT), split-spectrum amplitude decorrelation angiography algorithm and automated montaging, wide-field OCT angiography (OCTA) was used to measure the RPCP capillary density (CD) and NFL thickness. Polar sector-average CD and thickness maps were also created on each eye.
Results
Wide-field OCTA (8 × 8 mm) in 10 healthy eyes from 10 subjects demonstrated the distribution of the RPCP throughout the posterior pole. RPCP-CD decreases with distance from the disc, but along the arcuate nerve fiber bundles relatively dense (> half maximum density) RPCP extends more than 5 mm from the disc and includes regions superior to and inferior to the macula. The RPCP-CD and NFL thickness are highly correlated (R2 = 0.85, P < 0.001) and fit well with a nonlinear stacked-layer model. The model fit suggests that the RPCP is present when the NFL is thicker than 17.9 μm and reaches a ceiling area density of 84% and that the RPCP has an apparent volume density of 19% at the current instrument transverse resolution. This indicates that capillary overlap can be expected to occur when NFL thickness reaches 40 μm.
Conclusions
The wide distribution of dense overlapping RPCP suggests that wider (up to 8 mm vertical and 7 mm horizontal) OCTA scans may be better investigate capillary loss in the early stages of glaucoma or other optic neuropathies.
Keywords: optical coherence tomography angiography, radial peripapillary capillary plexus, nerve fiber layer thickness
The radial peripapillary capillary plexus (RPCP) consists of long, straight vessels with infrequent anastomoses found in the retinal nerve fiber layer (NFL). These capillaries arise from peripapillary retinal arterioles, extend radially from the optic disc, and run in parallel with the NFL axons, furthest along the temporal arcades.1,2 RPCP measurements have the potential of providing key functional information in disease processes such as glaucoma and other optic neuropathies.3–7 Although these capillaries have been well described histologically, they are poorly visualized with conventional intravenous fluorescein angiography.
Recently, it has been demonstrated that optical coherence tomography angiography (OCTA) can produce highly detailed and layer-specific views of the RPCP in vivo that clearly demonstrate the known vascular bed distribution.8 The use of a projection-resolved (PR) OCTA algorithm9,10 has allowed for more accurate investigation of microvascular retinal anatomy, and en face visualization clearly demonstrates that the RPCP is distinct from the superficial vascular plexus (SVP).11 Quantitative studies have reported positive correlations between RPCP density and NFL thickness, further validating the role of the RPCP in maintaining NFL health.12,13 In addition, Liu et al. demonstrated highly repeatable OCTA peripapillary retinal flow index and vessel densities that strongly correlated with visual field changes in glaucoma.14 Thus, OCTA-derived measurements of RPCP could provide important information on the perfusion of the NFL, which relates to its metabolism and function in both health and disease. However, relatively little is known about the distribution of the normal RPCP and the optimal OCTA scanning dimensions to characterize it. In the current study, we use wide-field OCTA to characterize RPCP-CD and its relationship with NFL thickness across the posterior pole in healthy eyes.
Methods
Study Subjects
Healthy participants were recruited from the Casey Eye Institute. The inclusion criteria for healthy eyes were as follows: (1) no evidence of retinal pathology or glaucoma; (2) intraocular pressure less than 21 mm Hg; (3) no chronic or systemic corticosteroid use; (4) best-corrected visual acuity less than 20/40; and (5) refractive error between −7 and +3 diopter (D). The research protocol was approved by the Oregon Health & Science University institutional review board and complied with the Declaration of Helsinki and HIPAA regulations. Informed consent was obtained from all participants.
OCT Data Acquisition and Analysis
Before imaging, the pupils of study eye were dilated. The external fixation target was used to look for peripapillary region. The optic disc on en face OCT was used to guide the scan position and control the overlap between scans less than the diameter of disc.
Four 4.5- × 4.5-mm overlapping scans were obtained in one eye of each participant using a commercial spectral-domain OCT system (Avanti RTVue-XR; Optovue, Fremont, CA, USA) with a center wavelength of 840 nm, a full-width half-maximum bandwidth of 45 nm, and an axial line rate of 70 kHz. The optical resolution in tissue is 15 and 5 μm on transverse and axial directions, respectively. The digital sampling interval is 15 × 15 × 3 μm3/voxel. The AngioVue software uses the split-spectrum amplitude decorrelation angiography (SSADA) algorithm, which compares consecutive B-scans at the same location to detect flow using motion contrast.15,16 Each scan set comprises of two volumetric scans: one vertical-priority raster and one horizontal-priority raster. The AngioVue software uses an orthogonal registration algorithm to register the two raster volumes to produce a merged three-dimensional (3D) OCT angiogram.17,18 The volumetric OCTA (flow signal) and OCT (reflectance signal) data were exported and analyzed using custom COOL-ART (Center for Ophthalmic Optics & Lasers-Angiography Reading Toolkit) image processing software developed by the authors using MATLAB (MathWorks, Natick, MA, USA). The NFL slab was automatically segmented based on structural OCT using a directional graph search method19 while the certified grader supervised the outcome. Intelligent manual correction guided by local graph search function could be done when necessary using the COOL-ART software. Four 4.5- × 4.5-mm RPCP angiograms were automatically montaged to create wide-field angiograms of approximately 8 × 8 mm centered on the optic disc (Fig. 1). The registration between four scans was based on Affine transformation between each pair of en face RPCP angiograms. It uses a gradient descent to search for a similarity transformation, which allows translation, scaling, rotation, and skewing within the transverse plane. Transverse optical magnification was corrected using axial length as previously described.20
Figure 1.

A representative image from a left eye. (A) Montaged RPCP angiograms (∼8 × 8 mm). (B) Montaged NFL thickness map. The size of each individual scan is 4.5 × 4.5 mm.
Prior to capillary density measurements, the binary angiogram (Fig. 2C) was created by thresholding OCTA signal values to classify pixels in the en face OCTA as either vascular or nonvascular (flow or no flow). In this step, reflectance variation due to media opacity or pupil vignetting was adjusted as described previously.21 Next, the center of the optic disc was manually located based on montaged OCT reflectance en face image, and the optic disc area, a circle with a 2-mm diameter, was excluded (Fig. 2B). Arterioles and venules (larger vessels) were automatically identified by thresholding the en face mean projection of OCT reflectance within the inner retinal slab (Fig. 2D) and excluded from the montaged OCTA images (Fig. 2E). After these larger vessels are excluded, the remaining angiogram is used to compute capillary density. The remaining angiogram contain vessels only one pixel wide. Because the transverse resolution limit of the OCT system is 15 μm, these vessels are equal to or less than 15 μm wide, which is consistent with the 9-μm caliber of radial peripapillary capillaries as measured according to histologic studies.1
Figure 2.

(A) Montaged RPCP OCT angiograms (∼8 × 8 mm) representing the maximum projection of flow signal within the NFL. (B) Montaged en face OCT of the NFL representing the mean projection of the reflectance signal. (C) Binary RPCP angiogram (white, vascular; black, nonvascular). (D) Binary large vessel map. (E) RPCP-CD map. The unit size (9 × 9 pixels) used for capillary density measurement was shown by a small red box in C.
The proportion of capillaries (vascular pixels that are not large vessels) within each grid element (9 × 9 pixels) was used to create RPCP-CD maps (Fig. 2E), which were then aligned based on the center of the optic disc to generate group-average RPCP-CD and RPCP-CD SD maps. The distance between the inner limiting membrane and outer boundary of the NFL was measured at each A-scan to generate a NFL thickness map for each eye. Group-average NFL thickness and NFL thickness SD maps were created using the same OCT data set.
Correlation Analysis
To analyze the relationship between capillary density and NFL thickness, RPCP-CD and NFL thickness maps on each eye were divided into polar sectors centered on the optic disc (Fig. 3), where the map was divided into radial annuli of 0.5-mm increments and the circle was divided into 32 angular slices.
Figure 3.

Polar coordinate sectors were used to analyze the RPCP-CD map and the NFL thickness map.
A scatter plot of mean RPCP-CD and mean NFL thickness from all eyes in each section was created. A nonlinear fit of RPCP-CD on NFL thickness was generated, and the coefficient of determination value was determined.
The scatter plot was fitted with a nonlinear model as described below:
 |
where,  represents estimated RPCP-CD, CDmax is the saturated value of
  , d is the RPCP-CD within a unit layer (one RPCP capillary layer thickness 9 μm, which is based on the averaged capillary diameter from previous histologic studies1), NFLT represents NFL thickness, and NFLTth is the threshold NFLT below which
  falls to zero. The model parameters CDmax, d, and NFLTth, are fit using a least-square algorithm.22
This stacked-layers model was based on the assumption that the RPCP is distributed evenly over the volume of the NFL and oriented parallel to the nerve fibers. The volume fraction occupied by capillaries is d. Within en face layers of unit capillary thickness of 9 μm,1,23 the fractional area not occupied by capillaries is (1 − d). Assuming that the capillary layers have independent distributions, the probability of the en face OCTA of the entire RPCP/NFL slab not being occupied by k capillary layers is (1 − d)k. Therefore, the projected RPCP-CD we calculated from en face RPCP angiograms would be 1 − (1 − dk). However, the distribution of capillaries may not be entirely random. This type of long range correlation would limit the maximum fractional area covered by capillaries to less than 1. This limit is accounted for by the CDmax term.
The coefficient of determination (R2) indicating the goodness of the curve fitting was generated by
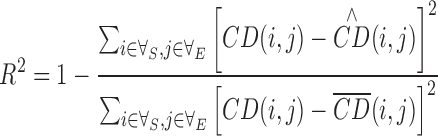 |
where,  is the RPCP-CD of ith sector and jth eye,
  is the estimated value based on the NFLT, and
  is the mean value of
  . The curved was fitted using commercial software (Origin 2017, OriginLab Corp., Northampton, MA, USA).
Results
Ten eyes from 10 healthy individuals (30 ± 5 years old; 5 female; 7 Asian, 2 Caucasian, 1 Hispanic) were imaged. Wide-field OCTA images centered on the optic disc were generated, which demonstrated long radial capillaries running parallel with the nerve fiber bundles (Fig. 1A). An NFL thickness map was also generated over the same area in each eye (Fig. 1B). The group-average RPCP-CD map (Fig. 4A) shows a general trend of attenuation with greater distance from the optic disc. However, relatively dense RPCP extends quite a long way along the superotemporal and inferotemporal arcute nerve fiber bundles, at least to the center line above and below the macula. The SD of RPCP-CD was slightly increased along the outer edges of the RPCP, suggesting there is intersubject variation in the distance that the RPCP extends from the optic disc (Fig. 4B). The group average NFL thickness (Fig. 5A) also demonstrated thinning with distance from the disc and extension of thick NFL along the superotemporal and inferotemporal arcute nerve fiber bundles. The SD map of NFL thickness (Fig. 5B) showed elevation along the edges of the arcuate paths that suggests variations in the trajectory of the arcuate nerve fiber bundles and/or in the paths taken by the major arcade vessels.
Figure 4.

(A) Group-average RPCP-CD map. (B) SD map of RPCP-CD, showing the intersubject variation.
Figure 5.

(A) Group-average NFL thickness map. (B) SD map of NFL thickness, showing the intersubject variation.
RPCP-CD and NFL thickness maps were divided into polar sectors to facilitate the correlation analysis between RPCP-CD and NFL thickness. The sector-wise plots of RPCP-CD versus NFL thickness on each individual case showed the variability of CDmax, d, and NFLTth (Fig. 6, left). The CDmax of 0.99 in case 1 is notably just due to lack of points at the high end of the curve. The plot on all cases (Fig. 6, right) showed a high degree of correlation (R2 = 0.85, P < 0.001) and good fit with the nonlinear stacked-layer model described in the Methods section. The model parameter NFLTth suggests that the RPCP disappears when the NFL is thinner than 17.9 μm. RPCP-CD rises quickly with the increase of NFL thickness. The RPCP-CD reached a ceiling of 84% (CDmax) where the NFL is near peak value.
Figure 6.

Scatter plot of NFL thickness and RPCP-CD in each polar sector in each eye.
The equation shown describes a stacked-layer model explained in Methods where  represents the RPCP-CD, CDmax is the
  ceiling, d is the capillary area density within each unit layer one capillary thick (9 μm), NFLT is the NFL thickness in micrometers, and NFLTth is the threshold NFLT below which
  becomes zero. On the plot of fit on all subjects, CDmax is indicated by a green dotted line, and the half CDmax level and its NFLT intercept are denoted by blue dotted lines. On the plot of fits on individual subjects, the subjects with lower case number corresponds to the higher CDmax.
The model fit on all cases suggest that below the half CDmax level of 42%, corresponding to a NFL thickness of 48 μm; the relationship between RPCP-CD and NFL thickness is approximately linear (Fig. 6). Above that point, the increase in RPCP-CD becomes sublinear with NFL thickness due to overlap between capillaries in stacked layers. Thus, the RPCP-CD value of 42% and the NFL thickness value of 48 μm can be viewed as a cutoff threshold for thick versus thin stacks according to our stacked-layer model. Applying this cutoff to the polar sector maps of RPCP-CD and NFL thickness (Fig. 7), one can see that dense RPCP and thick NFL extended to ∼5.0 mm along the superotemporal arcuate bundle and ∼5.5 mm along the inferiotemporal arcuate bundle as measured from the disc center. The scan areas of 3 × 3, 4.5 × 4.5, and 6 × 6 mm2 that are available on currently available commercial OCTA systems do not entirely cover the dense RPCP-CD area. The most efficient scan pattern would be temporally displaced by 1.0 mm and inferiorly displaced by 0.5 mm.
Figure 7.

(A) Averaged RPCP-CD divided into polar sectors. Sectors with greater than 42% CD are outlined in red. Commercial OCTA scan areas of 3 × 3, 4.5 × 4.5, and 6 × 6 mm2 (gray solid lines) and the area of efficient rectangle (white dash line; 8 × 7 mm) were overlaid. (B) Averaged retinal NFL thickness divided into polar sectors. Sectors with greater than 48-μm NFL thickness are outlined in red.
Discussion
Histology,1,2 vascular casts,24,25 and OCTA1,6,12,13,26 all have been used to study the distribution of RPCP. Our study agrees with previous wide-field OCTA studies13 in finding that the RPCP along the arcuate nerve fiber bundles extends superior and inferior to the macula, far beyond the immediate peripapillary region. Along these bundles, the orientation of the capillaries is parallel to the nerve fibers, which are not strictly radial. Therefore, the term “radial peripapillary capillary plexus” is not entirely accurate. A more apt term would be “nerve fiber layer plexus” (NFLP). For the sake of historical continuity, we continue to call it the RPCP in this paper. However, the vision science community may wish to debate and consider whether NFLP might be a better term in the age of OCTA.
The positive correlation between regional RPCP vessel density (VD; not excluding large vessels) and NFL thickness has been found along the peripapillary ring.1,6,12,13,26 Both RPCP-VD and NFL thickness have been found to be correlated with glaucoma disease severity.6,27,28 A positive correlation also exists between normal subjects.23 In the current study, we sought to improve the range and precision of these measurements with several improvements in methodology. One, the en face RPCP OCTA was projected in a precisely segmented NFL slab, which is the correct anatomic slab according to previous investigation using projection-resolved OCTA.11 This allows us to measure RPCP not only in the immediate peripapillary region where RPCP predominates over the other retinal plexuses, but over a wide region of the posterior pole in which the RPCP is a minor component of the retinal microcirculation. Two, we segmented and excluded large vessels so that the RPCP capillary density could be more cleanly measured. Three, we made measurement using finely divided polar sectors that covered the posterior pole. wide-field OCTA revealed that this relationship persists throughout a large 8- × 8-mm region centered on the optic disc. RPCP-CD and NFL thickness maps demonstrated that both have a bi-arcuate distribution and that RPCP-CD and NFL thickness attenuate similarly with distance from the optic disc. Using this more comprehensive methodology, we discovered several properties of the RPCP that may have physiologic significance and clinical implications.
One of our novel findings is that the RPCP is absent where the NFL is thin (<17.9 μm in the model). This may be the distance over which oxygen, nutrients, and waste could easily diffuse from or to the superficial retinal vascular plexus. For comparison, the distance between the intermediate capillary plexus and the deep capillary plexus (DCP) ranges from 35 to 50 μm, and the distance between the DCP and choriocapillaris ranges from 100 to 160 μm in the macula.11
Another important new finding is that RPCP-CD, as defined by the percent area occupied by capillaries on en face OCTA, is not linearly related to NFL thickness. Based on a nonlinear model fit from our group of normal subjects, the relationship between RPCP-CD and NFL thickness is linear up to about 48 μm, at which point the RPCP-CD reaches a half maximum value of 42%. Above that, the slope gradually flattens out as RPCP-CD approaches a ceiling of 84%. The reader may be concerned that thicker (i.e., >48 μm) areas of the NFL may be inadequately perfused. However, this concern should be dispelled with the knowledge that the RPCP consists of multiple layers of overlapping capillaries in areas of thick NFL. The overlap of capillaries in the RPCP slab has been visualized with cross-sectional projection-resolved OCTA.11 The apparent proportional decrease in RPCP-CD in thicker NFL areas is a result of 2D projection of a 3D capillary plexus, where overlapping capillaries are under-represented. The nonlinear relationship between RPCP-CD and NFL thickness is well fit by a stacked-layer model. The model fit parameter d is 19%, which is the capillary area density in a unit thickness layer. It can also be interpreted as the volumetric capillary density within the NFL. According to the stacked layer model, which is basically a binomial distribution probability model, the expected number of overlapping capillaries would be d/CDmax × NFLT/9. By this formula, the number of capillaries stacked on top of each other would be one, two, and three for NFL thicknesses of 40, 80, and 120 μm, respectively. The 40-μm NFL thickness where capillary overlap begins to occur is slightly less than the 48-μm thickness at which RPCP-CD reaches half maximum value.
The high degree of overlap in areas of thick NFL is partly because the OCT beam focal spot size is 15 μm (transverse resolution of the Avanti OCT system according to the manufacturer), 1.7 times that of the RPCP capillary diameter of 9 μm.1 The transverse pixel size on our OCTA is also 15 μm. Thus, capillaries on our angiogram would appear 1.7 times wider than their actual caliber, and their images are 1.7 times more likely to overlap. If an adaptive-optics OCTA system with finer resolution is used, the degree of overlap and the measured volumetric capillary density should be reduced. In the limit where the optical resolution is much finer than the capillary diameter, the resolution-corrected volumetric capillary density should be 11.2%. Thus, an adaptive-optics OCTA system could reduce the nonlinearity in the relationship between RPCP-CD and NFL thickness.
The fact that CDmax is less than 100% indicates that the distribution of capillaries is not entirely random—most likely radial capillaries are excluded from a fraction of the retinal area. This could arise from the organization of nerve fiber bundles so that the capillaries are confined to the bundle interstices. In terms of physiologic optics, the retina may be organized to have relatively large clear gaps between capillaries to allow the unimpeded transmission of light to the photoreceptors.
Our findings also have implications in the clinical use of OCTA to evaluate the RPCP in glaucoma and other optic neuropathies. In areas where the RPCP-CD is near the ceiling value (saturated) due to the overlap of multiple capillary layers, minor loss of capillaries may not be easily detected. Thus, the immediate peripapillary area is actually not the best location to image the RPCP for optimal detection of early glaucoma. The investigation of peripapillary retina perfusion by OCTA in glaucoma started with the use of a 3-mm2 scan area centered on the disc.14 Within such a small area, nearly all RPCP is near saturation density (Fig. 7). Current commercial OCTA systems use larger scan areas of 4.5 or 6.0 mm, which should improve the detection sensitivity for early glaucoma. Our results indicate that the smallest efficient rectangular scan pattern that would cover the entire dense (CD > half maximum) RPCP-CD area would need to be 8-mm vertical × 7-mm horizontal square and be temporally displaced by 1.0 mm and inferiorly displaced by 0.5 mm (Fig. 7). Wider scans beyond this limit would have diminishing return, but the size of commercial OCTA is not close to this limit yet. The importance of a wider RPCP measurement has been demonstrated in clinical studies. Using a 4.5-mm2 (OCTA) scan area, Yarmohamadi et al.29 found that the diagnostic accuracy for perimetric glaucoma was highest for the whole-image retinal VD (not excluding large vessels), which had an area under the receiver operating curve (AROC) of 0.94. In comparison, the diagnostic accuracy of the peripapillary retinal vessel density in a 0.75-mm-wide annulus (∼3-mm outer diameter) around the disc was significantly worse (AROC = 0.83). Using a 4.5-mm2 scan area and 4.0-mm2 analytic area and focusing on the RPCP instead of all-plexus retinal VD, we have results in 40 mostly mild perimetric glaucoma subjects and 38 normal subject that yielded an AROC of 0.941 (Edmunds B, et al. IOVS 2017;58:ARVO E-Abstract 721). Theoretically, RPCP-CD could detect glaucoma damage at an early stage when ganglion cells and nerve fibers are dysfunctional, less metabolically active, and require less perfusion. This would occur prior to cell death, axon loss, and NFL thinning. Case series have shown that RPCP changes precede NFL thinning in glaucoma patients with focal lamina cribrosa defects.30 Good diagnostic accuracy is already possible using 4.5-mm2 scans. The current study suggests that further improvement may be possible using an even larger scan area. Although the use of adaptive-optics OCTA could also reduce RPCP-CD saturation, it is probably a more difficult technical solution than simply scanning and analyzing a wider area with high-speed OCTA.
The nonlinear relationship between RPCP-CD and NFL thickness may partially explain why the RPCP parameters are better and more linearly correlated to VF parameters compared with the relatively poor correlation between NFL thickness and VF parameters. This has been a persistent finding in the OCTA glaucoma studies thus far.14,31–33 The NFL thins in the early to moderate stages of glaucoma, but reaches a floor value in the advanced stages and becomes poorly correlated with VF.34,35 The RPCP is dense, overlaps in the immediate peripapillary region, and retains good correlation with VF even into advanced stages of glaucoma.14,32 Thus, although it may be important to perform wider scans to optimize the detection of early glaucoma, the peripapillary region near the disc should not be neglected for the monitoring of advanced stages of glaucoma.
It should be noted that, although the stacked-layer model fit the results well, the fit is not exact and varied between individuals. The limited transverse resolution of the OCT system used here caused the capillary density to be overestimated, and we could only provide approximate correction for this overestimation. Thus, although we believe our OCTA study provides a wider survey and more granular quantification of the RPCP than was available previously,2,5 further studies to provide more precise measurements and better characterization of variations within the human population.
In summary, using wide-field OCTA in a small group of young adults, we found that relatively dense RPCP extends as far as 5.5 mm from the disc center. The RPCP area density is nonlinearly related to the NFL thickness due to the overlap of stacked capillary layers. In the immediate peripapillary area, radial capillaries are highly overlapped; therefore, wider scan areas (i.e., up to 8 mm vertical and 7 mm horizontal) could improve the detection of capillary loss in early glaucoma and other subtle optic neuropathies. Wide-field OCTA is a powerful new tool for the investigation of the RPCP. Further studies are needed on its anatomy, physiology, and diagnostic potential in larger and more diverse populations.
Acknowledgments
The authors thank Robert W. Knighton, PhD, of the Bascom Palmer Eye Institute (University of Miami, Miami, FL, USA), for discussion of the results, suggestion of the stacked-layer model of the en face capillary density, and comments on the manuscript.
Supported by National Institutes of Health Grants R01 EY023285, R01EY027833, DP3 DK104397, R01 EY024544, and P30 EY010572 and an unrestricted departmental grant; William & Mary Greve Special Scholar Award from Research to Prevent Blindness (New York, NY, USA); and the Antonio Champalimaud Vision Award.
Disclosure: Y. Jia, Optovue, Inc. (F), P; J.M. Simonett, None; J. Wang, None; X. Hua, None; L. Liu, None; T.S. Hwang, None; D. Huang, Optovue, Inc. (F, R), P
References
- 1. Yu PK, Cringle SJ, Yu DY. . Correlation between the radial peripapillary capillaries and the retinal nerve fibre layer in the normal human retina. Exp Eye Res. 2014; 129: 83– 92. [DOI] [PubMed] [Google Scholar]
- 2. Henkind P. . Radial peripapillary capillaries of the retina. I. Anatomy: human and comparative. Br J Ophthalmol. 1967; 51: 115– 123. [DOI] [PMC free article] [PubMed] [Google Scholar]
- 3. Hayreh SS. . Acute retinal arterial occlusive disorders. Prog Retinal Eye Res. 2011; 30: 359– 394. [DOI] [PMC free article] [PubMed] [Google Scholar]
- 4. Kornzweig AL, Eliasoph I, Feldstein M. . Selective atrophy of the radial peripapillary capillaries in chronic glaucoma. Arch Ophthalmol. 1968; 80: 696– 702. [DOI] [PubMed] [Google Scholar]
- 5. Alterman M, Henkind P. . Radial peripapillary capillaries of the retina. II. Possible role in Bjerrum scotoma. Br J Ophthalmol. 1968; 52: 26– 31. [DOI] [PMC free article] [PubMed] [Google Scholar]
- 6. Mammo Z, Heisler M, Balaratnasingam C,et al. Quantitative optical coherence tomography angiography of radial peripapillary capillaries in glaucoma, glaucoma suspect, and normal eyes. Am J Ophthalmol. 2016; 170: 41– 49. [DOI] [PubMed] [Google Scholar]
- 7. Falavarjani KG, Sadda SR. . Optical coherence tomography angiography of the optic nerve head, current situation and future perspective. J Eye Sci. 2016; 1: 38. [Google Scholar]
- 8. Spaide RF, Klancnik JM Jr, Cooney MJ. . Retinal vascular layers imaged by fluorescein angiography and optical coherence tomography angiography. JAMA Ophthalmol. 2015; 133: 45– 50. [DOI] [PubMed] [Google Scholar]
- 9. Zhang M, Hwang TS, Campbell JP,et al. Projection-resolved optical coherence tomographic angiography. Biomed Opt Expr. 2016; 7: 816– 828. [DOI] [PMC free article] [PubMed] [Google Scholar]
- 10. Wang J, Zhang M, Hwang TS,et al. Reflectance-based projection-resolved optical coherence tomography angiography [Invited]. Biomed Opt Expr. 2017; 8: 1536– 1548. [DOI] [PMC free article] [PubMed] [Google Scholar]
- 11. Campbell JP, Zhang M, Hwang TS,et al. Detailed vascular anatomy of the human retina by projection-resolved optical coherence tomography angiography. Sci Rep. 2017; 7: 42201. [DOI] [PMC free article] [PubMed] [Google Scholar]
- 12. Yu PK, Balaratnasingam C, Xu J,et al. Label-free density measurements of radial peripapillary capillaries in the human retina. PLoS One. 2015; 10: e0135151. [DOI] [PMC free article] [PubMed] [Google Scholar]
- 13. Mase T, Ishibazawa A, Nagaoka T, Yokota H, Yoshida A. . Radial peripapillary capillary network visualized using wide-field montage optical coherence tomography angiography. Invest Ophthalmol Vis Sci. 2016; 57: 504– 510. [DOI] [PubMed] [Google Scholar]
- 14. Liu L, Jia Y, Takusagawa HL,et al. Optical coherence tomography angiography of the peripapillary retina in glaucoma. JAMA Ophthalmol. 2015; 133: 1045– 1052. [DOI] [PMC free article] [PubMed] [Google Scholar]
- 15. Jia Y, Tan O, Tokayer J,et al. Split-spectrum amplitude-decorrelation angiography with optical coherence tomography. Opt Expr. 2012; 20: 4710– 4725. [DOI] [PMC free article] [PubMed] [Google Scholar]
- 16. Gao SS, Liu G, Huang D, Jia Y. . Optimization of the split-spectrum amplitude-decorrelation angiography algorithm on a spectral optical coherence tomography system. Opt Lett. 2015; 40: 2305– 2308. [DOI] [PMC free article] [PubMed] [Google Scholar]
- 17. Camino A, Zhang M, Gao SS,et al. Evaluation of artifact reduction in optical coherence tomography angiography with real-time tracking and motion correction technology. Biomed Opt Expr. 2016; 7: 3905– 3915. [DOI] [PMC free article] [PubMed] [Google Scholar]
- 18. Kraus MF, Potsaid B, Mayer MA,et al. Motion correction in optical coherence tomography volumes on a per A-scan basis using orthogonal scan patterns. Biomed Opt Expr. 2012; 3: 1182– 1199. [DOI] [PMC free article] [PubMed] [Google Scholar]
- 19. Zhang M, Wang J, Pechauer AD,et al. Advanced image processing for optical coherence tomographic angiography of macular diseases. Biomed Opt Expr. 2015; 6: 4661– 4675. [DOI] [PMC free article] [PubMed] [Google Scholar]
- 20. Huang D, Chopra V, Lu AT, Tan O, Francis B, Varma R. . Does optic nerve head size variation affect circumpapillary retinal nerve fiber layer thickness measurement by optical coherence tomography? Invest Ophthalmol Vis Sci. 2012; 53: 4990– 4997. [DOI] [PMC free article] [PubMed] [Google Scholar]
- 21. Gao SS, Jia Y, Liu L,et al. Compensation for reflectance variation in vessel density quantification by optical coherence tomography angiography. Invest Ophthalmol Vis Sci. 2016; 57: 4485– 4492. [DOI] [PMC free article] [PubMed] [Google Scholar]
- 22. Berkson J. . Minimum chi-square, not maximum likelihood! Ann Stat. 1980; 8: 457– 487. [Google Scholar]
- 23. Wang Q, Kocaoglu OP, Cense B,et al. Imaging retinal capillaries using ultrahigh-resolution optical coherence tomography and adaptive optics. Invest Ophthalmol Vis Sci. 2011; 52: 6292– 6299. [DOI] [PMC free article] [PubMed] [Google Scholar]
- 24. Risco JM, Nopanitaya W. . Ocular microcirculation. Scanning electron microscopic study. Invest Ophthalmol Vis Sci. 1980; 19: 5– 12. [PubMed] [Google Scholar]
- 25. Sugiyama K, Gu ZB, Kawase C, Yamamoto T, Kitazawa Y. . Optic nerve and peripapillary choroidal microvasculature of the rat eye. Invest Ophthalmol Vis Sci. 1999; 40: 3084– 3090. [PubMed] [Google Scholar]
- 26. Yu J, Gu R, Zong Y,et al. Relationship between retinal perfusion and retinal thickness in healthy subjects: an optical coherence tomography angiography study. Invest Ophthalmol Vis Sci. 2016; 57: 204– 210. [DOI] [PMC free article] [PubMed] [Google Scholar]
- 27. Scripsema NK, Garcia PM, Bavier RD,et al. Optical coherence tomography angiography analysis of perfused peripapillary capillaries in primary open-angle glaucoma and normal-tension glaucoma. Invest Ophthalmol Vis Sci. 2016; 57: 611– 620. [DOI] [PubMed] [Google Scholar]
- 28. Geyman LS, Garg RA, Suwan Y,et al. Peripapillary perfused capillary density in primary open-angle glaucoma across disease stage: an optical coherence tomography angiography study. Br J Ophthalmol. 2017; 101: 1261– 1268. [DOI] [PubMed] [Google Scholar]
- 29. Yarmohammadi A, Zangwill LM, Diniz-Filho A,et al. Optical coherence tomography angiography vessel density in healthy, glaucoma suspect, and glaucoma eyes OCT angiography vessel density in glaucoma. Invest Ophthalmol Vis Sci. 2016; 57: 451– 459. [DOI] [PMC free article] [PubMed] [Google Scholar]
- 30. Suh MH, Zangwill LM, Manalastas PI,et al. Optical coherence tomography angiography vessel density in glaucomatous eyes with focal lamina cribrosa defects. Ophthalmology. 2016; 123: 2309– 2317. [DOI] [PMC free article] [PubMed] [Google Scholar]
- 31. Jia Y, Wei E, Wang X,et al. Optical coherence tomography angiography of optic disc perfusion in glaucoma. Ophthalmology. 2014; 121: 1322– 1332. [DOI] [PMC free article] [PubMed] [Google Scholar]
- 32. Yarmohammadi A, Zangwill LM, Diniz-Filho A,et al. Relationship between optical coherence tomography angiography vessel density and severity of visual field loss in glaucoma. Ophthalmology. 2016; 123: 2498– 2508. [DOI] [PMC free article] [PubMed] [Google Scholar]
- 33. Yarmohammadi A, Zangwill LM, Diniz-Filho A,et al. Peripapillary and macular vessel density in patients with glaucoma and single-hemifield visual field defect. Ophthalmology. 2017; 124: 709– 719. [DOI] [PMC free article] [PubMed] [Google Scholar]
- 34. Wollstein G, Kagemann L, Bilonick RA,et al. Retinal nerve fibre layer and visual function loss in glaucoma: the tipping point. Br J Ophthalmol. 2012; 96: 47– 52. [DOI] [PMC free article] [PubMed] [Google Scholar]
- 35. Medeiros FA, Zangwill LM, Bowd C, Mansouri K, Weinreb RN. . The structure and function relationship in glaucoma: implications for detection of progression and measurement of rates of change. Invest Ophthalmol Vis Sci. 2012; 53: 6939– 6946. [DOI] [PMC free article] [PubMed] [Google Scholar]