

Summary
Eukaryotic cells store their chromosomes in a single nucleus. This is important to maintain genomic integrity, as chromosomes packaged into separate nuclei (micronuclei) are prone to massive DNA damage. During mitosis, higher eukaryotes disassemble their nucleus and release individualized chromosomes for segregation. How numerous chromosomes subsequently reform a single nucleus has remained unclear. Using image-based screening of human cells, we identified barrier-to-autointegration factor (BAF) as a key factor guiding membranes to form a single nucleus. Unexpectedly, nuclear assembly does not require BAF’s association with inner nuclear membrane proteins but instead relies on BAF’s ability to bridge distant DNA sites. Live-cell imaging and in vitro reconstitution showed that BAF enriches around the mitotic chromosome ensemble to induce a densely cross-bridged chromatin layer that is mechanically stiff and limits membranes to the surface. Our study reveals that BAF-mediated changes in chromosome mechanics underlie nuclear assembly with broad implications for proper genome function.
Keywords: mitosis, nuclear assembly, chromosomes, nuclear envelope, micronuclei, chromothripsis, barrier-to-autointegration factor, BAF, DNA cross-bridging
Graphical Abstract
Highlights
-
•
Spindle-independent mechanism based on BAF shapes single nucleus in mitotic exit
-
•
BAF transiently cross-bridges anaphase chromosomes to prevent nuclear fragmentation
-
•
BAF forms a dense DNA network at the chromosome ensemble surface
-
•
Network mesh size restricts membrane access and thereby guides the nuclear envelope
The BAF protein promotes the formation of a single nucleus via its DNA cross-bridging activity during nuclear assembly after mitosis.
Introduction
Nearly all eukaryotic cells store their genome in a single nuclear compartment. The genome itself, however, is divided into numerous chromosomes. If individual chromosomes form a separate nucleus (micronucleus), they are prone to DNA damage or even complete chromosome pulverization by chromothripsis (Crasta et al., 2012, Hatch et al., 2013, Zhang et al., 2015). Micronuclei are a common feature of cancer cells and thought to be a major driver in the evolution of cancer genomes (Leibowitz et al., 2015). The packaging of all chromosomes into a single nucleus is therefore critical for the maintenance of genome integrity and health.
Cells of higher eukaryotes disassemble their nucleus during mitosis to form individualized chromosomes that move independently on the mitotic spindle (Cuylen et al., 2016). If individual chromosomes attach incorrectly to the mitotic spindle, they can lag behind the mass of segregating anaphase chromosomes and then often package into a separate micronucleus during mitotic exit (Crasta et al., 2012). Thus, individual chromosomes can, in principle, function as a template for nuclear reformation. Yet, in normally segregating cells, each set of anaphase chromosomes consistently packages into a single nucleus.
During interphase of the cell cycle, various transmembrane proteins link the nuclear envelope (NE) to chromatin either by direct binding to DNA or by binding to adaptor proteins like barrier-to-autointegration factor (BAF) (Ungricht and Kutay, 2017, Wandke and Kutay, 2013). Upon mitotic entry, these linkages are disrupted by protein phosphorylation. Consequently, transmembrane proteins of the NE disperse in the endoplasmic reticulum (ER), while other NE proteins dissolve into the cytoplasm (Wandke and Kutay, 2013). During mitotic exit, dephosphorylation of these proteins promotes rebinding of ER-derived membranes to chromatin (Wandke and Kutay, 2013). How nuclear membranes are guided along the surface of a chromosome set to form a single nucleus, rather than enwrapping individual chromosomes remains unknown.
Membrane-chromatin interactions might be limited by the spindle-mediated compaction of chromosomes. The chromokinesin Kid localizes along microtubules within the anaphase chromosome ensemble and Kid knock-out mice display micronucleation during early development (Ohsugi et al., 2008). However, the Kid knock-out did not perturb nuclear assembly in cells of adult mice (Ohsugi et al., 2008), suggesting the existence of alternative mechanisms that restrict nuclear membranes to the surface of the chromosome ensemble.
The formation of a single nuclear surface might also be explained by a limited amount of membranes that can associate with chromatin (Webster et al., 2009). While this is a conceivable hypothesis, experimental support has yet to be corroborated.
To gain insights into the morphogenesis of the nucleus, we manipulated microtubules and chromosome geometries in human cells. This revealed that neither the mitotic spindle nor limiting amounts of membranes explain the formation of a single nuclear surface. By image-based screening, we identified BAF as a key factor driving formation of a single nucleus in a spindle-independent manner. Our investigations in cells and in vitro suggest that BAF shapes a single nucleus through the formation of a dense chromatin network that limits membranes to the surface of the chromosome ensemble.
Results
A Spindle-Independent Mechanism Shapes Single Nuclei from Mitotic Chromosomes
The mitotic spindle might specify a single nuclear surface by bringing anaphase chromosomes into proximity. To test whether the spindle is required to form a single nucleus, we assayed nuclear assembly in human cells with depolymerized microtubules. We visualized chromosomes and the NE in HeLa cells by stably co-expressing a core histone H2B tagged with mCherry (H2B-mCherry) and the nuclear membrane protein Lap2β tagged with EGFP (Lap2β-EGFP). We then imaged live cells that were either untreated or treated with both nocodazole, to depolymerize microtubules (Figures S1A and S1B), and reversine, to suppress the spindle assembly checkpoint (Santaguida et al., 2010). This combination drug treatment enables spindle-less cells to progress to mitotic exit. Drug-treated cells entering mitosis disassembled the NE and released individualized mitotic chromosomes into the cytoplasm, similar to untreated control cells (Figure 1A). The large majority of drug-treated cells subsequently packaged their non-segregated chromosomes into a single nucleus (88.3% ± 3.6%, mean ± SD) (Figures 1A–1C; Movie S1). The mitotic spindle is thus not required to shape a single nucleus from a set of individualized mitotic chromosomes.
Figure S1.

Spindle Perturbations and Micronucleation Phenotypes, Related to Figure 1
(A–C) Live HeLa cells stably expressing H2B-mCherry and Tubulin-EGFP were imaged in (A) unperturbed condition, (B) in the presence of 200 ng/ml nocodazole or (C) in the presence of 500 nM taxol.
(D) Live cells stably expressing H2B–mCherry and the nuclear import substrate IBB-EGFP were imaged 20 hr after addition of 500 nM taxol and 320 nM reversine.
(E) Time-lapse images of live cells stably expressing H2B–mCherry and Lamin B-EGFP imaged in the presence of 500 nM taxol and 320 nM reversine. Some micronuclei that formed during mitotic exit under this condition collapsed over time (marked by yellow arrowheads).
Scale bars are 10 μm.
Figure 1.

A Spindle-Independent Mechanism Shapes a Single Nucleus from a Set of Individualized Mitotic Chromosomes
(A) Live HeLa cells were imaged in the absence or presence of nocodazole and reversine. All cell lines used in this study stably express marker proteins as indicated (e.g., H2B-mCherry and Lap2β-EGFP here).
(B and C) Live cells were imaged (B), and the number of nuclei per post-mitotic cell was quantified (C) (bars indicate mean ± SD, n = 114 cells).
(D) Live HeLa cells as in (A) were imaged in the presence of taxol and reversine.
(E and F) Live cells as in were imaged (E), and the number of nuclei per post-mitotic cell was quantified (F) (bars indicate mean ± SD, n = 243). Scale bars, 10 μm.
The formation of a single nucleus might be due to limiting amounts of NE membranes (Webster et al., 2009). To test this, we exposed ectopic chromatin surfaces by separating chromosomes via Taxol-induced microtubule asters (Figure S1C). Cells progressing through mitosis in the presence of Taxol and reversine formed many micronuclei during mitotic exit (Figures 1D–1F; Movie S2). Almost all micronuclei were fully enwrapped by nuclear membrane (Figure 1D) and enriched for the nuclear transport substrate IBB-EGFP (importin-β-binding domain of importin-α [Görlich et al., 1996] [Figure S1D]), indicating a sealed NE. Only very few cells contained some compact structures (Figure S1E) consistent with spontaneous micronucleus collapse (Hatch et al., 2013). Thus, spindle-independent assembly of a single nucleus cannot be explained by a limiting amount of nuclear membranes.
Packaging Mitotic Chromosomes into a Single Nucleus Requires BAF
We hypothesized that shaping a single nucleus from an ensemble of individualized mitotic chromosomes might require spindle-independent factors. To identify proteins whose depletion causes micronucleation after spindle-less mitosis, we used small interfering RNAs (siRNAs) to target 1,295 candidate genes, including all factors previously identified as important for mitosis by genome-wide screening (Hériché et al., 2014, Neumann et al., 2010) and the candidate nuclear assembly factor Kid (Ohsugi et al., 2008). HeLa cells expressing H2B-mCherry were subjected to RNAi-mediated depletion of the target proteins, followed by treatment with nocodazole and reversine for the duration of one cell cycle. We then imaged live cells and automatically quantified the incidence of micronucleation by supervised machine learning (Figure 2A) (Held et al., 2010). The most penetrant micronucleation phenotype was caused by an siRNA targeting BAF (Figures 2B and 2C; Table S1).
Figure 2.

RNAi Screen Identifies BAF as a Critical Factor to Form a Single Nucleus
(A–C) RNAi screen to identify spindle-independent nuclear assembly factors. (A) Experimental design and hypothesized phenotypes. (B) RNAi screen targeting 1,295 genes; data points indicate fraction of micronucleated cells per siRNA as classified by supervised machine learning. Blue indicates non-targeting control siRNAs. (C) Raw data from the screen. HeLa cells were imaged following siRNA-mediated knockdown and immediately (0 hr) or 22 hr after addition of nocodazole and reversine.
(D and E) Immunofluorescence (IF) of cells 96 hr after siRNA transfection (96 hr was used for all IFs unless stated otherwise) and stained for (D) lamin B or (E) FG-repeat-containing nucleoporins (with mAb414). A single confocal section is shown.
(F–H) Super-resolution microscopy 3D analysis of nuclear morphology in BAF-depleted cells. (F) Single optical section of a cell stained for lamin B and CREST (kinetochores) by immunofluorescence and a 3D reconstruction by manual tracing of lamina and DNA signal. Micronuclei with no detectable connection to the main nucleus (gray) are shown in yellow. (G) Quantification of micronucleation as judged by super-resolution microscopy and 3D reconstruction (bars indicate mean ± SD, n = 67 cells). (H) CREST-foci per micronucleus (bars indicate mean ± SD, n = 37 micronuclei).
(I–K) Analysis of nuclear fragmentation. (I) Live cells stably expressing the nuclear import substrate IBB-EGFP were imaged 96 hr after siRNA transfection and (J) analyzed for the ratio of nuclear over cytoplasmic concentration of IBB-EGFP (dots indicate individual cells, lines indicate median and interquartile range, n = 430 [siControl] and n = 472 [siBAF]). Information on definition of significance and the underlying statistical tests for all figures are detailed in the STAR Methods. (K) BAF-depleted cells that show variable IBB-EGFP concentrations within individual nuclear fragments as shown in (I, arrow heads) were classified as micronucleated (bars indicate mean ± SD, n = 437 [siBAF] and n = 468 [siControl] cells). Scale bars, 10 μm.
BAF is an evolutionarily conserved protein that is ubiquitously expressed and essential for cell viability (Blomen et al., 2015, Jamin and Wiebe, 2015). Further, BAF depletion was previously shown to cause nuclear morphology defects (Furukawa et al., 2003, Gorjánácz et al., 2007, Margalit et al., 2005, Zheng et al., 2000). Thus, we considered BAF a strong candidate for a generic factor shaping single nuclei from sets of mitotic chromosomes.
To verify the role of BAF in forming a single nucleus, we first tested whether BAF deficiency induces nuclear fragmentation in cells with intact spindles. Indeed, BAF depletion caused a strong nuclear fragmentation phenotype (Figures 2D and 2E), which was observed with several siRNAs and specific to on-target binding on the BAF mRNA (Figures S2A–S2I). We further observed nuclear fragmentation upon BAF depletion in non-cancer, diploid hTERT-RPE1 cells (Figures S2J and S2K).
Figure S2.

Validation of RNAi Phenotype, Related to Figure 2
(A) Immunofluorescence staining for BAF of wild-type HeLa cells 96 hr after siRNA transfection. DNA was stained with Hoechst 33342 (representative image of two independent experiments is shown).
(B) Quantification of BAF levels in manually segmented cells as shown in (A). Lines indicate median and interquartile range, n = 10 cells per condition, ∗∗∗∗p < 0.0001 by two-tailed t test.
(C) HeLa cells stably expressing H2B–mCherry and Lamin B-EGFP were imaged 90 hr after siRNA transfection. A single confocal section is shown.
(D) Quantification of nuclear morphology phenotypes (n = 171 (siBAF#1), n = 302 (siBAF#2), n = 181 (siBAF#3) and n = 186 (siControl) cells from two independent experiments). Lines indicate mean.
(E) Schematic of CRISPR/Cas9-based DNA strand nicking strategy to remove the siBAF#2 binding site from one allele of the 3′UTR of the BAF1 genomic locus. Upper panel indicates genomic binding sites of siRNAs used in (C, D). Lower panel indicates single guide RNA (sgRNA) binding sites and genome nick sites (red arrowhead).
(F) Sequencing result of a HeLa cell clone after genome editing shows the deletion induced by sgRNAs as shown in (E). One allele lacks the siBAF#2 binding site (resistant allele), whereas the other allele remains wild-type.
(G) Immunoblot analysis of BAF and actin in HeLa wild-type cells and siBAF#2-resistant cells 96 hr after siRNA transfection.
(H) Immunofluorescence staining for Lamin B of wild-type HeLa cells and siBAF#2-resistant cells 96 hr after siRNA transfection. A single confocal section is shown. DNA was stained with Hoechst 33342.
(I) Cells as shown in (H) were automatically classified into normal or micronucleated morphology by supervised machine learning (bars indicate mean ± s.d., ∗∗∗p < 0.0002 by one-way ANOVA with Tukey’s correction for multiple comparisons, three independent experiments with a total cell number of n = 659; 799; 694; 669; 796; 810 (siControl / wild-type cells; siBAF#1 / wild-type cells; siBAF#2 / wild-type cells; siControl / siBAF#2-resistant cells; siBAF#1 / siBAF#2-resistant cells; siBAF#2 / siBAF#2-resistant cells)).
(J) Immunofluorescence staining for Lamin B of hTERT-RPE1 cells 96 hr after siRNA transfection. DNA was stained with Hoechst 33342.
(K) Cells as shown in (J) were automatically classified into normal or micronucleated morphology by supervised machine learning (bars indicate mean ± s.d., ∗∗∗∗p < 0.0001 by two-tailed t test, n = 1184 (siControl) and n = 890 (siBAF) from 3 independent experiments).
Scale bars are 10 μm.
To characterize nuclear morphology phenotypes in more detail, we stained DNA, lamin B, and kinetochores and performed 3D super-resolution fluorescence microscopy. Graphical reconstructions of nuclear surfaces showed strong lobulation and the presence of micronuclei in 39% ± 11% of BAF-depleted cells (Figures 2F and 2G). Most micronuclei contained a single kinetochore (Figure 2H), validating that BAF depletion induces micronucleus formation around individual chromosomes.
To test whether micronuclei in BAF-depleted cells were fully disconnected from primary nuclei, we investigated the localization of nucleoplasmic proteins. Live-cell imaging of the small nuclear import substrate IBB-EGFP showed that nuclei of BAF-depleted cells had lower concentrations of IBB-EGFP than control cells (Figures 2I and 2J), consistent with prior findings that BAF depletion perturbs sealing of the NE (Gorjánácz et al., 2007, Margalit et al., 2005). Importantly, neighboring nuclear fragments in BAF-depleted cells often had variable concentrations of IBB-EGFP (Figures 2I and 2K), indicating that their nucleoplasm was not connected. Thus, BAF is a key factor for shaping a single nucleus from mitotic chromosomes in the presence or absence of mitotic spindles.
BAF Functions during Mitotic Exit to Prevent Nuclear Fragmentation
Micronuclei in BAF-depleted cells might arise from chromosome segregation errors. However, BAF depletion did not increase the incidence of lagging chromosomes and anaphase chromosome bridges (Figures S3A and S3B).
Figure S3.

BAF Depletion Perturbs Nuclear Assembly but Not Chromosome Segregation, Related to Figure 2
(A and B) Analysis of chromosome segregation in BAF-depleted cells. (A) Live HeLa cells stably expressing H2B–mCherry were imaged during mitotic exit 72 hr after siRNA transfection (Metaphase cells were automatically detected by supervised machine learning to trigger time-lapse microscopy until late anaphase). Segregation errors in the time lapse movies as depicted in (A) were quantified in (B) by manual annotation for n = 136 (siControl) and n = 154 (siBAF) cells. Dots indicate experiments, line indicates mean.
(C and D) Acute depletion of cytoplasmic BAF by chemically-induced targeting to the plasma membrane (PM). (C) Schematic of the approach. HeLa cells stably co-expressing the plasma membrane anchor (PM anchor) of Lyn11 fused to mCherry-FRB and an siRNA-resistant version of FRKP-EGFP-BAF were generated for Rapamycin-induced relocalization of FRKP-EGFP-BAF to the PM, while endogenous BAF is depleted by RNAi. (D) Live cells stably expressing the constructs indicated in (C) and an additional marker for the nuclear envelope (Lap2β-TagBFP) were imaged 72 hr after siRNA transfection. Additional plasmid encoding the PM anchor was transfected transiently 48 hr post siRNA transfection to boost expression levels as this triple stable cell line decreased constitutive PM anchor expression over time. Rapamycin was added during metaphase as indicated to 500 nM final concentration. The nuclear envelope marker is recorded only for the post-mitotic cells and not in the time-lapse data to reduce blue light exposure of cells. Cells from four independent experiments were then tracked undergoing mitotic exit and analyzed manually. DNA was stained by SiR-Hoechst.
(E) Long-term imaging of live HeLa cells stably expressing H2B–mCherry and Lap2β–EGFP 72h after siRNA transfection.
Scale bar is 5 μm in (A) and 10 μm in (D) and (E).
BAF has been implicated in various non-mitotic processes, including the regulation of gene expression and DNA repair (Jamin and Wiebe, 2015). We hence tested whether BAF’s contribution to nuclear assembly is provided during mitosis. We developed an approach for inducible, acute depletion of BAF from the cytosol, utilizing the chemically-inducible dimerization of FKBP (FK506 binding protein 12) and FRB (a fragment of mTOR) (Rivera et al., 1996) to relocalize BAF to the plasma membrane upon rapamycin treatment (Figure S3C). To achieve this, we stably expressed RNAi-resistant BAF fused to FKBP (BAF-EGFP-FKBP) together with a chimeric protein containing FRB and a plasma membrane targeting domain (Hammond et al., 2012). In the absence of rapamycin, depletion of endogenous BAF did not cause nuclear fragmentation in these cells (Figure S3D), showing that the siRNA-resistant BAF-EGFP-FKBP transgene is functional. Addition of rapamycin to metaphase cells efficiently depleted the cytoplasmic pool of BAF-EGFP-FKBP by re-localization to the plasma membrane, and cells formed fragmented nuclei as they progressed through mitotic exit (Figure S3D). Therefore, BAF shapes a single nucleus through a function specifically provided during the late stages of mitosis.
BAF Restricts Nuclear Membranes to the Surface around the Anaphase Chromosome Ensemble
BAF’s requirement for nuclear assembly has been attributed to a function in recruiting NE proteins to anaphase chromosomes through its binding to DNA as well as to several inner NE proteins containing a LEM (Lap2/Emerin/Man1) domain (Haraguchi et al., 2001, Lee et al., 2001, Segura-Totten et al., 2002, Shumaker et al., 2001). However, to what extent the nuclear morphology defects in BAF-depleted cells arise from impaired recruitment of LEM-domain proteins is not clear. We therefore investigated BAF’s role in recruiting the inner nuclear membrane LEM-domain protein Lap2β-EGFP to anaphase chromosomes. In control cells, Lap2β-EGFP accumulated on anaphase chromosomes within the first 10 min after anaphase onset (Figures 3A–3D; Movie S3). BAF-depleted cells enriched Lap2β-EGFP on chromosomes almost as efficiently as control cells during early anaphase, but unexpectedly further accumulated Lap2β-marked membranes (Figures 3A–3D; Movie S3). The excess membranes in BAF-depleted cells predominantly accumulated at inter-chromosomal regions (Figures 3A–3E; Movie S3), leading to lobular nuclear protrusions (Figures 3F–3H) and subsequently micronuclei (Figure S3E). Thus, BAF is not required for efficient recruitment of a canonical LEM-protein to anaphase chromatin. Instead, BAF prevents entry of nuclear membranes into the mass of anaphase chromosomes.
Figure 3.

BAF Restricts Nuclear Membranes to the Surface of the Anaphase Chromosome Ensemble
(A) Live cells were imaged 72 hr after siRNA transfection during mitotic exit (t = min:s from anaphase onset, n = 46 [siBAF] and n = 45 [siControl] cells). Dashed box indicates region shown in lower panels.
(B–E) Lap2β–EGFP accumulation on chromosomes. Anaphase chromosome ensembles were tracked and (B) automatically segmented based on H2B-mCherry. (C) Rim and internal chromatin regions were automatically derived from chromatin segmentation as indicated. (D) Lap2β-EGFP was quantified as shown in (A; curves and shaded areas indicate mean ± SD, respectively; n = 66 [siBAF] and n = 61 [siControl] chromosome ensembles). (E) Lap2β-EGFP in rim and internal ensemble subregions at 21:00 min:s, normalized to the average signal in the respective control condition (dots indicate chromosome ensembles, lines indicate median and interquartile range).
(F–H) Shape of chromosome ensembles as shown in (A). (F) Outlines of chromosome ensembles shown in (A) at 31:30 min:s. (G) Circularity measurements over time (curves ± range indicate mean ± SD, n = 72 [siBAF] and n = 76 [siControl] chromosome ensembles). (H) Circularity at 31:30 min:s (dots indicate chromosome ensembles, lines indicate median and interquartile range). Scale bars, 10 μm.
See also Figures S3 and S4 and Movie S3.
Ectopic nuclear membrane binding in BAF-depleted cells might be due to a perturbed arrangement of chromosomes. Geometric measurements, however, showed that BAF-depleted cells had chromosome ensemble geometries that were indistinguishable from controls at the time point of initial NE rebinding (Figures S4A–S4E), indicating proper chromosome segregation and compaction.
Figure S4.

Chromosome Ensemble Geometries in BAF-Depleted Cells, Related to Figure 3
(A–E) Analysis of chromosome ensemble geometries during mitotic exit. (A) Schematic of the measurements shown in (B-E), segmentation was performed by local adaptive thresholding. (B) Height of the chromosome ensemble (curves and range indicate mean ± s.d., complete maximum projection trajectories of chromosome ensembles). Dashed line indicates the time point of initial rebinding of nuclear envelope to the chromosome ensemble (see also Figure 3A) at 7:00 min:s. (C) Chromosome height at 7:00 min:s for data shown in (B; dots indicate individual chromosome ensembles; median with interquartile range is plotted, ns > 0.05 by two-tailed Mann-Whitney test). (D) and (E) width of the chromosome ensembles for the cells shown in (B, C).
(F–H) Distribution analysis of microtubules during mitotic exit. (F) Immunofluorescence staining for Tubulin and Lamin B in HeLa cells 96 hr after siRNA transfection. DNA was stained with Hoechst 33342 (representative images of two independent experiments is shown). Cells were binned into mitotic stages based on chromosome ensemble distance and furrow ingression status. (G) Analysis of cellular microtubule distribution. Chromosomes were segmented by thresholding and the mask (‘chromosomes’) was used to measure tubulin signal within the chromosome ensemble. The mask was then dilated and a band of 1 μm thickness was generated (‘cytoplasm’) to measure cytoplasmic tubulin signal. (H) Quantification of microtubule distribution (median with interquartile range is plotted, ∗∗∗p < 0.0002, ∗∗∗∗p < 0.0001 by Kruskal-Wallis with Dunn’s correction for multiple comparison, n ≥ 28 cells per condition from two independent experiments).
(I) Efficacy of 200 ng/ml nocodazole treatment in BAF-depleted and control cells in comparison with prometaphase under normal cell culture conditions.
(J) Long-term imaging of live HeLa cells stably expressing H2B–mCherry and Lap2β–EGFP 72h after siRNA transfection in the presence of 200 ng/ml nocodazole and 320 nM reversine.
(K) Quantification of Lap2β-EGFP fluorescence in internal and rim regions of the chromosome ensemble (see also Figure 3C) 35 min after mitotic exit and normalized to the average signal in the respective control condition (dots indicate chromosome ensembles, lines indicate median and interquartile range, ∗∗∗∗p < 0.0001, ns > 0.05 by Mann-Whitney test, n ≥ 22 cells from four independent experiments).
Scale bars are 10 μm.
The disorganized nuclear membranes in BAF-depleted cells might result from perturbed disassembly of anaphase spindle microtubules. Immunostaining of microtubules, however, showed that BAF-depleted anaphase cells cleared microtubules from the chromosome ensemble as efficiently as control cells (Figures S4F–S4H). Moreover, BAF depletion did not affect the efficacy of nocodazole-induced microtubule depolymerization (Figure S4I) and time-lapse microscopy of nocodazole/reversine-treated cells showed that BAF depletion induced substantial penetration of nuclear membranes into the mass of chromosomes (Figures S4J and S4K). Thus, micronucleation in BAF-depleted cells is not due to perturbed microtubule organization.
Overall, these data show that BAF stabilizes the compact arrangement of anaphase chromosomes to restrict nuclear membranes to the surface.
BAF’s Essential Role in Nuclear Assembly Depends on DNA Cross-Bridging but Not LEM-Domain Binding
BAF’s previously described function as a recruitment factor for LEM-domain proteins (Haraguchi et al., 2001, Lee et al., 2001, Segura-Totten et al., 2002, Shumaker et al., 2001) does not intuitively explain the observed ectopic nuclear membrane entry into the anaphase chromosome ensemble of BAF-depleted cells. We therefore considered alternative mechanisms for BAF’s role in nuclear assembly. BAF was initially discovered as a protein that binds to viral DNA in the host cell cytoplasm. This is exploited by some retroviruses to prevent destructive autointegration into their genome (Lee and Craigie, 1998). Suppression of viral autointegration has been proposed to result from DNA compaction (Lee and Craigie, 1998), mediated by BAF dimers forming loops between distant DNA segments (Skoko et al., 2009). We hypothesized that the ability of BAF dimers to bridge distant DNA segments, which we refer to as DNA cross-bridging, might be relevant for nuclear assembly.
To dissect the distinct functions of BAF, we designed a mutation at a key hydrophobic residue, BAFL58R, that is predicted to interfere with LEM-domain binding, but not with BAF dimerization and DNA binding (Figure 4A). We compared this mutant to a previously published dimerization-deficient mutant, BAFG47E (Umland et al., 2000), which cannot cross-bridge distant DNA segments (Figure 4A).
Figure 4.

BAF Dimerization, but Not BAF-LEM Binding, Is Required to Shape a Single Nucleus
(A) Design of point mutations to interfere with BAF-LEM binding or with BAF dimerization. Point mutations (red) are indicated on the structure of the BAF dimer (blue) relative to LEM domain (green). Magenta indicates DNA.
(B) Schematic of the assay.
(C) Analysis of recombinant wild-type (WT) and mutant BAF proteins. Fluorescently labeled recombinant BAF proteins were mixed with DNA-coated beads. Then, fluorescently labeled recombinant LEM domains were added and beads were imaged by confocal microscopy.
(D and E) Quantification of BAF (D) and LEM bound to beads (E) (dots indicate beads, lines indicate median and interquartile range, n ≥ 40 beads per condition).
(F and G) RNAi complementation analysis (F) IF of cells stably expressing siBAF-resistant transgenes. (G) Quantification of micronucleation phenotype. Cells were automatically classified into normal or micronucleated morphology by supervised machine learning (bars indicate mean ± SD, see STAR Methods for sample numbers).
(H) Live localization of BAF-EGFP in wild-type HeLa cells and EGFP-BAFL58R mutant in homozygous L58R mutant HeLa cells.
(I) EGFP fluorescence as in (H) was analyzed along line profiles (curves and range indicate mean ± SD, n = 10 cells per condition).
(J) Immunoprecipitation (IP) of EGFP-tagged BAF as in (H). Co-purified Lap2 was detected by immunoblot analysis using anti-Lap2 and anti-EGFP antibodies.
(K and L) Wild-type or homozygous BAFL58R mutant cells were analyzed by IF (K), and micronucleated cells were automatically quantified by supervised machine learning (L) (bars indicate mean ± SD, see STAR Methods for sample numbers). Scale bar is 5 μm in (C), and 10 μm in (F), (H), and (K).
See also Figure S5.
To test if the BAFL58R mutation efficiently abrogated LEM-domain binding, we established an in vitro assay using DNA-coated beads and fluorescently labeled purified recombinant proteins (Figure 4B). We found that BAFL58R bound to DNA-coated beads as efficiently as wild-type BAF (Figures 4C and 4D). However, unlike wild-type BAF, BAFL58R did not recruit the recombinant LEM domain (Figures 4C and 4E). The dimerization-deficient mutant BAFG47E bound to DNA-coated beads less efficiently than wild-type BAF (Figures 4C and 4D), which is likely due to the monomeric protein’s loss of avidity. BAFG47E did not recruit recombinant LEM domain (Figure 4E) as expected, because the LEM-binding site spans the BAF dimer interface (Cai et al., 2007). Hence, the L58R and G47E mutations both efficiently suppress BAF’s binding to LEM-domains in vitro.
We next used these BAF mutants to test which of the two functions—LEM-domain binding or dimerization—is required for nuclear assembly in human cells. We generated HeLa and hTERT-RPE1 cell lines stably expressing the different siRNA-resistant human BAF variants, depleted endogenous BAF by RNAi, and quantified the fraction of micronucleated cells. Expression of wild-type BAF or the LEM-binding-deficient mutant BAFL58R efficiently suppressed micronucleation, whereas the dimerization-deficient mutant BAFG47E did not (Figures 4F, 4G, S5A, and S5B). Hence, BAF dimerization, but not LEM-domain binding, is required to assemble nuclei with normal morphology.
Figure S5.

Characterization of the Homozygous BAFL58R Mutant Cell Line, Related to Figure 4
(A) RNAi complementation assay with siRNA-resistant BAF transgenes, stably expressed in hTERT-RPE1 cells. Cells were fixed and stained for immunofluorescence 112 hr after transfection of siRNA targeting endogenous BAF.
(B) Cells as shown in (A) were automatically classified into normal or micronucleated morphology by supervised machine learning (bars indicate mean ± s.d., ∗∗∗∗p < 0.0001 by one-way ANOVA with Tukey’s correction for multiple comparisons, three independent experiments with a total cell number of n = 1594; 1307; 1736; 1820; 1597 (siControl / parental cell line; siBAF / parental cell line; siBAF / WT transgene; siBAF / L58R transgene; siBAF / G47E transgene).
(C–E) Insertion of the L58R mutation into all alleles of BAF using genome editing. (C) Schematic of CRISPR/Cas9-based DNA strand nicking strategy to modify the coding sequence of the BAF1 genomic locus. The nucleotides at the position coding for leucine 58 (L58) in wild-type BAF were changed on the repair template to encode for an arginine (R) and AgeI restriction site was inserted. Also, the recognition motives (PAM sites) of the sgRNAs were changed by silent mutations to prevent re-cutting of a genomic site that has been repaired with the template. (D) PCR product amplifying the region targeted by genome editing in wild-type cells and a L58R-edited clone. Successful editing of all endogenous alleles was analyzed by diagnostic restriction enzyme digestion of the PCR product with AgeI. (E) DNA sequencing chromatogram of L58R site of a wild-type and the CRISPR/Cas9-mutated cell line, respectively. Asterisks indicate mutated nucleotides.
(F) Immunoprecipitation (IP) of 3xFLAG-EGFP-tagged Lap2β in wild-type HeLa cells and homozygous L58R mutant HeLa cells and immunoblot analysis of EGFP and co-purified BAF and BAFL58R.
(G) Time-lapse microscopy of mitotic exit in live cells stably expressing EGFP-tagged wild-type BAF in wild-type cells, and EGFP-BAFL58R mutant transgene in homozygous L58R mutant cells. Note that EGFP-BAF and EGFP-BAFL58R similarly enriched on the anaphase chromosome ensemble (5:00 and 7:30 min:s time points, respectively), but only wild-type BAF remained enriched at the nuclear envelope of the nascent nucleus (40:00 and 24:30 min:s time points, respectively).
(H) Proliferation analysis of wild-type and homozygous L58R mutant cells. Fold change of cell count per area from three independent experiments. Bars indicate mean ± SD.
(I) Mitotic duration analysis of wild-type and homozygous L58R mutant cells. Duration of prometaphase onset to anaphase onset was analyzed for n = 150 cells per cell line from three independent experiments.
(J) Immunofluorescence of wild-type HeLa cells and HeLa cells containing homozygous endogenous BAFL58R mutation, 96 hr after siRNA transfection.
(K) Immunoblot analysis of wild-type and endogenous BAFL58R HeLa cells 96 hr after siRNA transfection.
Scale bars are 10 μm.
We further investigated the relevance of BAF’s LEM-binding function by introducing the L58R mutation into all endogenous alleles of BAF in HeLa cells using CRISPR/Cas9 (Figures S5C–S5E). Transgenically expressed EGFP-tagged BAF was highly enriched at the NE in interphase wild-type cells, in contrast to EGFP-tagged BAFL58R expressed in the mutant genetic background (Figures 4H and 4I). This confirms that LEM-binding activity, which is required for BAF localization at the interphase NE (Shimi et al., 2004), is disrupted in BAFL58R. Further, immunoprecipitation analyses showed that BAFL58R does not interact with LEM-domain proteins Lap2α and Lap2β in cells (Figures 4J and S5F). Nevertheless, BAFL58R enriched on anaphase chromosomes as wild-type BAF (Figure S5G) and cell proliferation rates and mitotic duration of the homozygous BAFL58R mutant cells were indistinguishable from wild-type cells (Figures S5H and S5I). Moreover, immunofluorescence staining of lamin B and other NE proteins did not reveal any perturbations of nuclear morphology in BAFL58R mutant cells (Figures 4K and S5J). RNAi depletion of BAFL58R in the mutant cell line, however, caused micronucleation (Figures 4K, 4L, S5J, and S5K). Thus, BAF’s essential contribution to nuclear assembly is not provided through LEM-domain binding, but through its ability to dimerize.
BAF Targets to the Entire Surface Surrounding Chromosome Ensembles
BAF dimers might shape a single nucleus by regulating the chromatin surface. To investigate whether BAF covers the entire surface of the chromosome ensemble prior to nuclear assembly, we imaged live cells stably expressing EGFP-tagged BAF and mCherry-tagged Lap2β. During early anaphase, BAF-EGFP indeed accumulated around the entire anaphase chromosome ensemble (Figure 5A, see 2:15 min:s; Movie S4), before it decreased at lateral chromatin surfaces covered with NE (Figure 5A, see 4:00 min:s; Movie S4). BAF’s initial localization is hence consistent with a function in shaping a coherent chromatin surface.
Figure 5.

BAF Enriches at the Entire Surface Formed by the Chromosome Ensemble
(A) Time-lapse images of an anaphase cell. DNA is labeled with SiR-Hoechst and a single confocal section of a representative cell is shown (n = 34 cells).
(B) Time-lapse images as in (A), in the presence of nocodazole; flavopiridol was added at t = 0:00 min:s to induce mitotic exit (n = 19 cells).
(C) Localization of BAF and Lap2β along the chromatin surface, based on the data shown in (B). The segmented chromosome ensemble contour is displayed as a straightened line. Note that BAF initially enriched at the entire chromatin surface at 6:21 min:s, whereas it subsequently decreased at areas that have been covered by Lap2β (09:06 min:s at the left side).
(D) Total BAF-EGFP on chromosomes of cells undergoing mitotic exit as in (B; curve and range indicate mean ± SD of n = 19 cells).
We next investigated whether BAF’s surface localization requires the specific chromosome arrangement imposed by the anaphase spindle. We depolymerized microtubules to randomize mitotic chromosome positions and then induced mitotic exit by the Cdk inhibitor flavopiridol. Strikingly, BAF-EGFP still enriched throughout the surface surrounding the entire ensemble of chromosomes (Figure 5B, see 6:21 min:s; Movie S5). At later stages, BAF continued to accumulate only at surface regions that were not yet covered by nuclear membrane and decreased where NE had contacted chromatin (Figures 5B–5D; Movie S5). BAF’s initial localization to a single surface surrounding the chromosome ensemble hence does not require microtubules and the specific chromosome arrangements imposed by the mitotic spindle.
BAF Targets to Chromatin Surfaces by Diffusion-Stable Binding
To investigate BAF’s interaction with chromatin in the absence of other cellular structures, we established an in vitro system using purified components. We isolated chromatin from HeLa cells using extensive detergent and salt washes, thereby removing endogenous BAF (Figures S6A–S6C). This yielded chromatin structures of ∼10–500 μm diameter, which we attached to an electrically charged glass surface. We then added fluorescently labeled wild-type BAF protein to the buffer and recorded time-lapse movies. BAF accumulated at the surface of chromatin structures within seconds, but remained excluded from chromatin-internal regions (Figures 6A–6C, 0:20–8:00 min:s, and S6D; Movie S6). Thus, soluble BAF targets to chromatin surfaces independent of membranes and other cytoplasmic components.
Figure S6.

BAF’s Interaction with Purified Chromatin In Vitro, Related to Figure 6
(A) Procedure for purification of chromatin from HeLa cells.
(B) Compositional analysis of whole cell extract and chromatin purified from this extract by Coomassie-stained SDS-PAGE gel. The profile plot refers to the purified chromatin lane. Core histones were annotated based on expected size and overlayed with immunoblot data against H2B.
(C) Immunoblotting of whole cell extract and chromatin purified from this extract using anti-H2B and anti-BAF antibodies, respectively.
(D) In vitro assay to probe interaction of recombinant BAF with purified chromatin. Time-lapse images of X-Z scans through the chromatin structure (box marks the cropped region of the chromatin structure that is shown in Figure 6A). BAF and VRK1 were added to the buffer as indicated, DNA was stained with Hoechst 33324.
(E) Time-lapse images of X-Z scans through the chromatin structure (box marks the cropped region of the chromatin structure that is shown in Figure 6D). BAFG47E was added to the buffer as indicated.
Scale bars are 10 μm.
Figure 6.

BAF Enriches at the Surface of Purified Chromatin to Induce Long-Range Chromatin Compaction
(A) Purified chromatin was immobilized on a chambered glass coverslip and stained with Hoechst 33342. Labeled recombinant BAF was added to a final concentration of 1 μM at 00:00 min:s and recombinant VRK1 was added at 08:20 min:s to a final concentration of 40 nM. Images show X-Z scans through the chromatin structure (overview is shown in Figure S6D).
(B) Kymograph of a line profile across the chromatin surface shown in (A, dashed line). Note that BAF transiently relocates throughout the entire chromatin structure (yellow arrowhead) following VRK1 addition.
(C) BAF enrichment at surface and internal regions of chromatin structures as shown in (A) (curves and range indicate mean ± SD, n = 5).
(D) Binding of dimerization-deficient recombinant BAFG47E (1 μM) to purified chromatin (overview is shown in Figure S6E).
(E) Kymograph of a line profile across the chromatin surface shown in (D) with the dashed line.
(F) BAFG47E enrichment was quantified at surface and internal regions of chromatin structures (curves and range indicate mean ± SD, n = 3).
(G–I) Analysis of chromatin compaction. (G) and (I) show the DNA channel of the kymographs in (B) and (E), respectively. (H) Compaction of chromatin upon sequential addition of BAF and VRK1 shown as distance relative to the radial distance of the chromatin surface to the glass surface (mean ± SD are plotted, n = 5). Scale bar in (A) and (D) is 10 μm.
The confined surface localization of BAF might arise from a general inability to move through chromatin or from very stable binding of BAF upon first contact with DNA. To discriminate between these possibilities, we investigated how altering BAF’s DNA affinity affects localization on chromatin. Previous work showed that BAF’s binding to DNA is suppressed by VRK1-mediated phosphorylation near the DNA-binding site (Gorjánácz et al., 2007, Nichols et al., 2006). The extremely high affinity of BAF dimers to DNA (dissociation constant ∼10 pM) is reduced ∼1,000-fold when only one of the two DNA binding domains is inactivated by VRK1-mediated phosphorylation (Skoko et al., 2009). To test whether reduced DNA affinity might enable BAF to diffuse into chromatin-internal regions, we added VRK1 to the buffer after BAF had bound to the chromatin surface. This indeed induced a transient relocalization of BAF throughout the entire chromatin volume, followed by complete dissociation of BAF from chromatin (Figures 6A–6C, 11:00–14:00 min:s; Movie S6). In contrast, monovalent BAFG47E (dimerization-deficient mutant) rapidly bound throughout the entire chromatin volume with no enrichment at the surface (Figures 6D-6F and S6E). The confined localization of BAF at the chromatin surface hence depends on high-affinity binding of dimeric complexes to DNA, which immobilizes BAF before it can enter internal regions.
BAF-Mediated DNA Cross-Bridging Compacts the Surface of Chromatin In Vitro
We next studied the functional consequences of BAF binding to purified chromatin. We observed that addition of wild-type BAF protein induced a pronounced compaction of the chromatin structures, which was reversed upon the addition of recombinant VRK1 (Figures 6A, 6G, and 6H). BAFG47E, in contrast, had no effect on chromatin compaction upon binding (Figures 6D and 6I). Thus, BAF induces large-scale chromatin compaction, which could be driven by thermal motion of the chromatin fiber leading to random contacts of distant chromatin sites that are then cross-bridged by BAF.
BAF Stabilizes Clusters of Micron-Sized Objects
To confine membranes to the surface of the reforming nucleus, the BAF-chromatin network would need to connect neighboring anaphase chromosomes. To investigate whether BAF can link macroscopic structures, we developed an in vitro assay based on DNA-coated beads that roughly match the size of mitotic chromosomes. We used paramagnetic beads that can be moved into proximity by induction of a magnetic field (Figure 7A). Following inactivation of the magnetic field, native DNA-coated beads rapidly moved apart (Figure 7B). When recombinant wild-type BAF or the LEM-domain-binding-deficient mutant BAFL58R were added during application of the magnetic field, the DNA-coated beads remained clustered after inactivation of the magnetic field (Figures 7B and 7C). In contrast, the BAF dimerization-deficient mutant BAFG47E did not maintain bead clustering, even at 5-fold higher protein concentrations than wild-type BAF (Figures 7B and 7C). Furthermore, addition of recombinant VRK1 released wild-type BAF and BAFL58R from DNA beads (Figure S7A) and efficiently resolved clusters into individual beads (Figures 7B and 7C). Furthermore, BAF binding and bead cross-bridging can be temporally uncoupled (Figures S7B and S7C). Thus, BAF-mediated DNA cross-bridging stabilizes clusters of micron-sized objects, which does not require bead proximity during the initial BAF binding.
Figure 7.

BAF Stiffens the Chromatin Surface and Clusters Micron-Sized Beads through Its DNA Cross-Bridging Activity
(A–C) In vitro clustering assay for chromosome-sized DNA beads (∅ 2.8 μm). (A) Experimental setup. (B) Transmission light microscopy images of beads prepared as shown in (A). Beads were segmented by thresholding. Proteins were added as indicated to 1 μM. BAFG47E was tested at 5 μM final concentration to account for reduced binding affinity to DNA beads. For WT and L58R samples, VRK1 was added after the initial analysis. (C) Quantification of bead cluster sizes for data as shown in (B; n = 120 particles per condition, dots indicate bead clusters, lines indicate median with interquartile range).
(D–G) Atomic force microscopy of the chromatin surface. (D) Experimental setup. Purified chromatin is attached to a chambered coverslip and probed by a cantilever that is bent upon tip contact, which deflects a laser and is used to calculate mechanical resistance. Then, recombinant BAF protein and subsequently recombinant VRK1 were added and the same chromatin site was probed again. (E) Representative force curves for one experiment. (F) Young’s moduli derived from consecutive measurements for wild-type BAF as shown in (E; trajectories indicate individual experiments, n = 22 chromatin sites consecutively measured). (G) Young’s moduli determined as in (F), but for BAFG47E (n = 11).
(H–M) Analysis of diffusion of dextrans into purified chromatin. Purified chromatin was pre-incubated in the (H) absence or (I) presence of 5 μM BAF (intracellular concentration = 7 μM) (Itzhak et al., 2016). Then 500 kDa dextran added to the buffer and diffusion was imaged (times indicate seconds post addition). (J) Quantification of dextran distribution across the buffer-chromatin boundary (curves and range indicate mean ± SD, n = 6) for 500 kDa dextran. Purified chromatin was pre-incubated in the (K) absence or (L) presence of 5 μM BAF and 4.4 kDa dextran was subsequently added. (M) Quantification of dextran distribution across the buffer-chromatin boundary (curves and range indicate mean ± SD, n = 4).
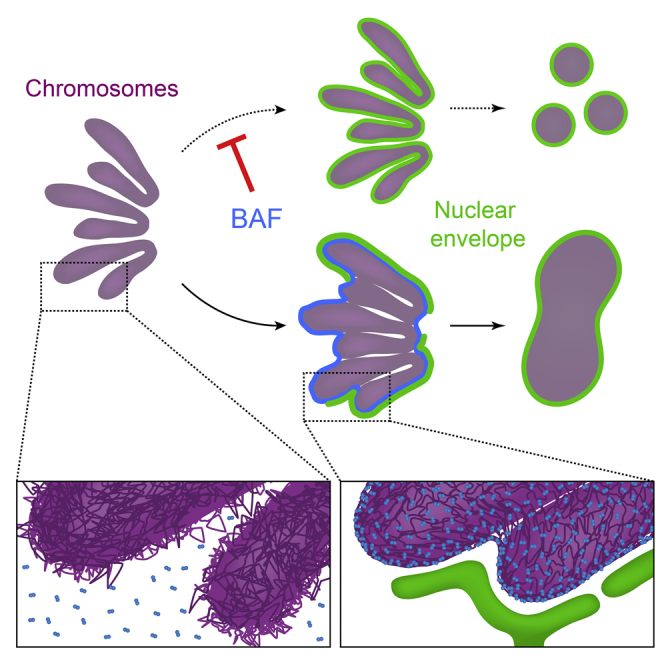
(N) Model of the BAF-DNA network forming at the surface of anaphase chromosomes prior to nuclear envelope reassembly. Scale bar is 10 μm in (B) and 20 μm in (H)–(L).
Figure S7.

BAF Function In Vitro and BAF Chromatin Surface Localization in Cells, Related to Figure 7
(A) Quantification of fluorescently-labeled BAF recombinant proteins bound to DNA-coated beads before and after addition of VRK1 (150 nM final concentration, median with interquartile range is plotted, ∗∗∗∗p < 0.0001 by Kruskal-Wallis with Dunn’s correction for multiple comparison, n ≥ 20 particles per condition from two independent experiments). Note that the dimerization-deficient mutant BAFG47E cannot be released from the DNA-beads by VRK1 kinase, suggesting that VRK1 specifically recognizes the BAF dimer and not the monomer.
(B) Experimental setup for testing the ability of BAF to cross-bridge DNA beads after binding under mono-disperse conditions. (see also Figures 7A–7C).
(C) Quantification of bead cluster sizes (n = 150 particles per condition from three independent experiments, dots indicate bead clusters, ∗∗∗∗p < 0.0001 by Kruskal-Wallis with Dunn’s correction for multiple comparison).
(D–I) Analysis of VRK1 depletion phenotype. HeLa cells stably expressing H2B–mCherry and Lap2β–EGFP were imaged 48 hr post siRNA transfection for 16 hr. (D) Cell fate was analyzed for cells entering mitosis and classified manually into cells entering anaphase and cells undergoing cell death without segregation (n = 125; 130 cells (siControl; siVRK1) from three independent experiments). Bars indicate mean ± SD. Cells that did enter anaphase were further analyzed for (E) mitotic duration (prometaphase onset to anaphase onset) and (F) chromosome segregation errors (chromosome bridges and lagging chromosomes). Bars indicate mean ± SD. (G) shows an example of chromosome bridge and micronucleus formation (yellow arrow) during mitotic exit upon VRK1 depletion. (H) Quantification of Lap2β-EGFP positive membranes on mitotic chromosomes during metaphase and mitotic exit (n > 28 cells per condition from three independent experiments, dots indicate chromosome ensembles, lines indicate median with interquartile range, ns > 0.05 by Kruskal-Wallis with Dunn’s correction). (I) Analysis of nuclear envelope reassembly outcome following a segregation error in VRK1-depleted cells (n = 56 cells from three independent experiments). Bars indicate mean ± SD.
(J) Immunoblot analysis of cell line stably expressing EGFP-BAF and comparison to the parental cell line. The upper blot was probed with an anti-BAF antibody, the lower with an anti-tubulin antibody.
(K–M) Live-cell imaging of a cell stably expressing BAF-EGFP and mCherry-Lap2β during mitotic exit. DNA was labeled with SiR-Hoechst and a single confocal section is shown. Line profiles (yellow dashed line) were used to (L) plot BAF-EGFP fluorescence intensity across the chromatin surface at a site that is not yet enwrapped by nuclear envelope. A Gaussian function was fitted to the data to determine the (M) full width at half maximum (FWHM = 2.35 ∗ standard deviation of the Gaussian fit). Dots represent n = 16 cells from two independent experiments. Bars indicate mean ± SD.
(N) Depletion of BAF-EGFP from the cytoplasm during mitotic exit. Background-corrected measurements of cytoplasmic BAF in metaphase and anaphase cells were normalized to the metaphase signal and plotted (n = 16 cells from two different experiments). Bars indicate mean ± SD.
(O) Atomic force microscopy setup.
(P) In vitro assay to probe diffusion of fluorescently labeled 500 kDa dextran into purified chromatin in the absence or presence of 5 μM BAF. Time-lapse images of X-Y scans through the chromatin structure (dashed line indicates region shown in Figures 7H and 7J respectively). Dextran was added to the buffer at 0 s, DNA was stained with Hoechst 33324.
Scale bar is 10 μm in (G), 5 μm in (K) and 20 μm in (P).
These findings suggest that failure to release BAF from chromosomes during early mitosis might cause premature chromosome cross-bridging and thereby interfere with chromosome alignment and segregation. To test this, we maintained BAF on mitotic chromosomes by RNAi-depletion of VRK1 (Molitor and Traktman, 2014). VRK1-depleted cells that entered mitosis often failed to progress to anaphase, resulting in mitotic cell death (Figure S7D). Some cells entered anaphase after prolonged metaphase (Figure S7E) and then exposed severe chromosome segregation errors (Figure S7F) and perturbed nuclear morphology (Figure S7G), consistent with prior work (Molitor and Traktman, 2014). NE membranes were not recruited to metaphase chromosomes in VRK1-depleted cells (Figures S7G and S7H), consistent with a phospho-regulated disruption of BAF-LEM interactions during mitosis (Hirano et al., 2005, Hirano et al., 2009). Lagging chromosomes in VRK1-depleted cells subsequently formed micronuclei (Figure S7I), yet micronucleation by membranes penetrating the anaphase chromosome mass as in BAF-depleted cells was never observed. Removal of BAF from chromosomes during early mitosis is therefore critical for faithful chromosome segregation.
BAF Forms a Dense Chromatin Network at the Surface of Anaphase Chromosomes
Our data indicate that BAF-mediated DNA cross-bridging forms a network at the chromatin surface. To estimate whether the pore size of this network might be small enough to prevent NE from entering chromatin, we calculated the density of BAF dimers at the surface of anaphase chromosome ensembles.
We first calculated the chromatin volume containing BAF accumulations. The surface area of each mass of segregated anaphase chromosomes in HeLa cells is 408 ± 69 μm2 at 10 min after anaphase onset (Otsuka et al., 2016), yielding a total surface area of 816 ± 138 μm2. Line profiles showed that BAF-EGFP, expressed at levels similar to endogenous BAF (Figure S7J), is confined in a layer of 660 ± 81 nm (Figures S7K–S7M) underneath a total chromosome ensemble surface, which corresponds to a volume of 536 ± 112 μm3 containing BAF.
Next, we estimated the number of BAF dimers localizing to this peripheral chromatin region. According to quantitative mass spectroscopy, HeLa cells contain in average 5.5 million BAF dimers (Itzhak et al., 2016). Live-cell microscopy of BAF-EGFP indicated that 84.1% ± 2.6% of cytoplasmic BAF re-localizes to anaphase chromosomes at the time of nuclear reassembly (Figure S7N). Based on these numbers, we calculated 8,607 ± 1,805 BAF dimers per μm3 of the anaphase chromosome surface layer. BAF is thus concentrated to 45 ± 9 μM at the chromosome surface layer, which corresponds to an average distance between BAF dimers of 49 ± 3 nm. This is considerably smaller than the diameter of ER tubules (60–100 nm) (Shibata et al., 2006). BAF dimers could therefore form a chromatin network that limits access of small membrane structures like ER tubules.
BAF-Mediated DNA Cross-Bridging Stiffens the Chromatin Surface
We next investigated whether the BAF-mediated chromatin network establishes a physical barrier. We therefore measured the mechanical resistance of chromatin to a 40-nm spherical cantilever tip of an atomic force microscope (Figures 7D and S7O). Native purified chromatin had a Young’s modulus of 0.2 kPa (median, interquartile range 0.1–0.8 kPa) (Figures 7E and 7F), similar to chromatin inside the interphase nucleus of live HeLa cells (de Vries et al., 2007). The addition of recombinant BAF increased the Young’s modulus of chromatin to 35.4 kPa (median, interquartile range 1–234 kPa) and this was almost completely reversed after subsequent addition of VRK1 (median 0.25 kPa, interquartile range 0.07–0.75 kPa) (Figures 7E and 7F). Dimerization-deficient BAFG47E, in contrast, did not affect chromatin surface stiffness (Figure 7G). Thus, BAF stiffens the chromatin surface through its ability to cross-bridge DNA. This establishes a mechanical barrier to objects in the size of an ER tubule.
BAF Forms a Permeability Barrier for Macromolecules at the Chromosome Surface
A densely cross-bridged chromatin network should restrict diffusional access of macromolecules with a diameter similar or larger than the average mesh size. To test this, we investigated the entry of dextrans, inert macromolecular probes with well-defined properties, into chromatin regions. A 500 kDa dextran with a diameter of 49 nm efficiently diffused into native purified chromatin within 120 s (Figures 7H, 7I, and S7P; Movie S7). When BAF was bound to purified chromatin prior to the addition of the 500 kDa dextran, this strongly reduced the influx (Figures 7H and 7I; Movie S7). In contrast, a 4.4 kDa dextran with a diameter of 4 nm readily diffused into chromatin in the absence and presence of BAF (Figures 7J and 7K). Therefore, BAF-mediated DNA-cross-bridging forms a diffusional barrier at the surface of chromatin that prevents access of macromolecular objects in the size-range of membrane tubules (Figure 7L).
Discussion
BAF Forms a Rigid Chromatin Network to Shape a Single Nucleus
Our study uncovers a chromatin-based mechanism that shapes a single nucleus from a set of individualized mitotic chromosomes: BAF-mediated DNA cross-bridging forms a compact, mechanically stiff chromatin surface that specifies the geometry of a single nucleus. BAF controls the chromatin surface through several remarkable features. First, the protein is highly abundant and enriches to high micromolar concentrations at the surface layer of anaphase chromosome ensembles. Second, BAF binds persistently to DNA due to extremely high affinity in its unphosphorylated form (Skoko et al., 2009). The high density of persistent DNA cross-bridges limits chromatin polymer deformation, resulting in a drastic stiffening.
Previous work showed that BAF binds to anaphase chromosomes with long residence time, and electron-dense regions at the surface of anaphase chromosomes were absent in BAF-depleted cells (Haraguchi et al., 2008). Our data suggest that these structures represent the compacted chromatin network that restricts nuclear membranes to the surface.
Spatio-Temporal Control of BAF during Mitotic Exit
The formation of a cross-bridged DNA network on anaphase chromosomes must be tightly regulated in time and space, as premature cross-bridging of chromosomes causes segregation errors and mitotic cell death (our data and Molitor and Traktman [2014]). Furthermore, a failure to resolve the tightly linked BAF-DNA network during late stages of mitotic exit might interfere with interphase functions of chromatin.
During early mitosis, BAF’s phosphorylation by VRK1 suppresses binding to DNA to undetectable levels (Gorjánácz et al., 2007, Nichols et al., 2006). During mitotic exit, PP2A and its co-factor LEM4/ANKLE2 dephosphorylate BAF (Asencio et al., 2012) to induce high-affinity DNA binding before membranes contact chromatin. Once the NE has assembled, BAF partially dissociates from chromatin (Haraguchi et al., 2008). This might be driven by nuclear import of VRK1, or by the related kinase VRK2, which resides in the NE (Blanco et al., 2006, Nichols et al., 2006). The mitotic phospho-regulation of BAF hence establishes a dense chromatin network only at a short time window during mitotic exit when nuclear membranes enwrap chromosomes.
BAF’s confinement to the surface of chromosome ensembles is consistent with a localization mechanism of cytoplasmic activation, followed by diffusion and persistent binding upon first chromatin contact (Figure 7L). Following an initial phase where BAF localizes along the entire surface formed by the anaphase chromosome ensemble, BAF continues to enrich mostly in “core” regions close to the pole-to-pole axis of the mitotic spindle (Dechat et al., 2004, Haraguchi et al., 2001). Our data show that this localization is governed by the geometry of NE membranes: once chromatin surface regions are covered by nuclear membranes, they cease to further accumulate BAF. The enrichment of BAF in “core” regions of late anaphase chromosomes hence represents a consequence, not cause for nuclear membrane recruitment.
Dissecting BAF’s Functions during Nuclear Assembly
Previous studies attributed BAF’s essential function in nuclear assembly to its role in recruiting LEM-domain proteins (Cai et al., 2007, Furukawa, 1999, Jamin and Wiebe, 2015, Lee et al., 2001, Zheng et al., 2000). While it is conceivable that inefficient recruitment of inner nuclear membrane proteins might compromise sealing of the NE (Gorjánácz et al., 2007, Margalit et al., 2005), it does not provide an intuitive explanation for micronucleation phenotypes. Indeed, our data show that the BAF-LEM interaction is not required for efficient assembly of nuclei with normal morphology in human cells. This might be explained by the high redundancy in molecular interactions between chromatin and inner nuclear membrane proteins, as many nuclear membrane proteins can directly bind to DNA or chromatin, including several LEM-domain proteins (Cai et al., 2001, Haraguchi et al., 2001, Lee et al., 2001, Shumaker et al., 2001).
The regulation of DNA-BAF-LEM domain interactions might be more relevant for early stages of cell division. During early meiosis of D. melanogaster oocytes, chromosomes detach from the NE to form a single chromatin mass termed karyosome, and this process requires VRK1-dependent inactivation of the DNA-BAF link (Lancaster et al., 2007). At this stage, any type of chromatin-NE interactions might provide dominant function counteracting release of chromosomes from the NE. During mitosis, however, the BAF-mediated link between chromosomes and NE is also suppressed by phosphorylation-mediated disruption of BAF-LEM interaction (Hirano et al., 2005, Hirano et al., 2009).
During mitotic exit in early embryos, some species transiently form multiple nuclei termed karyomeres, which fuse to a single nucleus during subsequent interphase. Karyomere formation in early embryos of X. laevis depends on microtubules (Lemaitre et al., 1998), suggesting that in this cell type, mitotic spindles might actively position chromosomes far enough apart to prevent the formation of a single nucleus. In Zebrafish, the fusion of karyomeres depends on brambleberry, a protein that is expressed only during early embryonic stages (Abrams et al., 2012). The absence of such karyomere-fusion factors in adult cells might explain why micronuclei emerging from chromosome missegregation in human tissue culture cells do not fuse with the primary nucleus (Crasta et al., 2012). Why cells form distinct nuclear geometries during early embryonic divisions and why karyomeres are protected against chromothripsis that often destroys chromosomes in micronuclei of adult cells are interesting questions to be addressed in future studies.
STAR★Methods
Key Resources Table
| REAGENT or RESOURCE | SOURCE | IDENTIFIER |
|---|---|---|
| Antibodies | ||
| Lamin B1 (Immunofluorescence (IF): 1:1000) | Abcam | ab16048Lab ID#217 |
| BAF (A-11) (Immunoblot (IB): 1:250; IF: 1:200) | Santa Cruz Biotechnology | sc-166324 Lab ID #224 |
| Nuclear Pore Complex Proteins (mAb414) (IF: 1:1000) | Eurogentec | MMS-120P-0500 |
| Emerin (IF 1:200) | ProteinTech | 10351-1-APLab ID #247 |
| GFP (Immunoprecipitation (IP): 2μg / 10μl beads IB: 1:1000) | Rockland | 600-101-215Lab ID #55 |
| FLAG (Flag beads M2) | Sigma-Aldrich | M8823 |
| FLAG (M2) (IB 1:10,000) | Sigma-Aldrich | F1804 |
| Lap2 (IB: 1:500) | BD Transduction laboratories (BD biosciences) | CatNr 611000Lab ID #25 |
| Actin, clone C4 (IB 1:1,000) | Millipore | MAB1501Batch 2665057Lab ID #186 |
| Tubulin, DM1A (IF: 1:1,000) | Sigma-Aldrich | T6199Lab ID #205 |
| alpha Tubulin (IB: 1:1,000) | Abcam | ab18251Lab ID#283 |
| CREST (IF: 1:400) | Antibodies Incorperated | obtained from Meradi labLab ID #77 |
| Secondary antibodies | ||
| Horseradish peroxidase goat anti-rabbit | Biorad | 170-6515Lab ID #158 |
| Horseradish peroxidase goat anti-mouse | Biorad | 170-6516Lab ID #185 |
| anti mouse IgG Alexa Fluor 488 | Molecular Probes | A11001 |
| anti mouse IgG Alexa Fluor 546 | Molecular Probes | A11030 |
| anti rabbit IgG Alexa Fluor 488 | Molecular Probes | A21206 |
| anti rabbit IgG Alexa Fluor 546 | Molecular Probes | A11035 |
| Chemicals, Peptides, and Recombinant Proteins | ||
| Hoechst 33342 | Invitrogen | H1399 |
| poly-lysine | Sigma | P8920 |
| 16% Formaldehyde (w/v), Methanol-free | Pierce | 28906 |
| Vectashield | Vector | H-1000 |
| Dynabeads® Protein G for Immunoprecipitation | Thermo Fisher | 10004D |
| cOmplete, EDTA free protease inhibitor | Roche | 11873580001 |
| Amersham Hybond P 0.2 PVDF | GE Healthcare | 10600021 |
| Trizma base | Sigma-Aldrich | T6066 |
| Glycine | AppliChem | 131340.0914 |
| RNAiMAX | Thermo Fisher | 13778-150 |
| QuickExtract | Biozym/epicenter | QE09050 |
| Recombinant VRK1 kinase | Active Motif | 31200 |
| Tetramethylrhodamine isothiocyanate–Dextran (average mol wt 500,000) | Sigma-Aldrich | 52194 |
| Tetramethylrhodamine isothiocyanate–Dextran (average mol wt 4,400) | Sigma-Aldrich | T1037 |
| Experimental Models: Cell Lines | ||
| HeLa cell lines used in this study | ||
| HeLa Kyoto (female) | Obtained from S. Narumiya (Kyoto University, Japan), validated by a Multiplex human Cell line Authentication test (MCA), 21.04.16. | Lab ID #1 |
| HeLa Kyoto siBAF#2 resistent | This study | Lab ID #1345 |
| HeLa Kyoto BAFL58R homozygous endogenous mutant | This study | Lab ID #1452 |
| HeLa Kyoto ; RIEP receptor | This study | Lab ID #1081 |
| HeLa Kyoto BAFL58R homozygous endogenous mutant; RIEP receptor | This study | Lab ID #1518 |
| LamB1-GFP; H2B_cherry | N/A | N/ALab ID #957 |
| H2B-mCherry; alphaTubulin-mEGFP | N/A | (Steigemann et al., 2009)Lab ID #157 |
| H2B-mCherry; IBB-EGFP | N/A | (Schmitz et al., 2010)Lab ID #172 |
| EGFP-Lap2beta, H2B-mcherry | Gift from Mark Petronczki | Lab ID #1150 |
| EGFP-BAF | This study | Lab ID#1271 |
| EGFP-BAF; mCherry-Lap2beta | This study | Lab ID#1383 |
| BAFL58R homozygous endogenous mutant; EGFP-BAF L58R | This study | Lab ID#1517 |
| EGFP-P2A-BAF | This study | Lab ID#1272 |
| EGFP-P2A-BAFL58R | This study | Lab ID#1326 |
| EGFP-P2A-BAFG47E | This study | Lab ID#1325 |
| FKBP-EGFP-BAF; Lyn-mCherry-FRB | This study | Lab ID#1312 |
| hTERT-RPE1 cell lines used in this study | ||
| hTERT-RPE1 (female) | ATCC | Cat. NR. CRL-4000, Lot.Nr.60193307 |
| hTERT-RPE1; RIEP receptor | This study | Lab ID #1092 |
| EGFP-P2A-BAF (RPE1) | This study | Lab ID #1269 |
| EGFP-P2A-BAFL58R (RPE1) | This study | Lab ID #1316 |
| EGFP-P2A-BAFG47E (RPE1) | This study | Lab ID #1315 |
| Key siRNAs of the study | ||
| siBAF#1 (sense: AGUUUCUGGUGCUAAAGAAtt) | ThermoFisherSilencer® Select siRNA | s16807 |
| siBAF#2 (sense: AGAUUGCUAUUGUCGUACUtt) | ThermoFisherSilencer® Select siRNA | s16808 |
| siBAF#3 (sense: CCCUCACUUUCAAUCCGUUtt) | ThermoFisherSilencer® Select siRNA | s16809 |
| siVRK1 (sense: GCAGUUGGAGAGAUAAUAAtt) | ThermoFisherSilencer® Select siRNA | s14820 |
| siControl (sense: UACGACCGGUCUAUCGUAGtt) | ThermoFisherSilencer® Select siRNA | custom |
| Key sgRNAs used in this study | ||
| L58R_sgRNA2.Oligo1 CACCGGAAAGATGAAGACCTCTTCC | This study | N/A |
| L58R_sgRNA2.Oligo2 AAACGGAAGAGGTCTTCATCTTTCC | This study | N/A |
| L58R_sgRNA1.Oligo1 CACCGCAACATAGGCCTGCAAAACA | This study | N/A |
| L58R_sgRNA1.Oligo2 AAACTGTTTTGCAGGCCTATGTTGC | This study | N/A |
| siBAFresist_sgRNA1.oligo1CACCGTCCTCCCCTGTCCTCTACGA | This study | N/A |
| siBAFresist_sgRNA1.oligo2AAACTCGTAGAGGACAGGGGAGGAC | This study | N/A |
| siBAFresist_sgRNA2.oligo1CACCGTCGGCTGCAAACTCTGGATG | This study | N/A |
| siBAFresist_sgRNA2.oligo2AAACCATCCAGAGTTTGCAGCCGAC | This study | N/A |
| Key PCR primers used in this study | ||
| L58R_genotyping.FORCTTTGGTTAGCTTTCCACGCC | This study | N/A |
| L58R_genotyping.REVGGGTCCCTGGGTTTCCAAG | This study | N/A |
| siBAF_resist_genotyping.FORGGGCAAGAAGCTGGAGGAAA | This study | N/A |
| siBAF_resist_genotyping.REVGGGTCCCTGGGTTTCCAA | This study | N/A |
| pCR2.1FW_Biotin [BtnTg]tcgccctttgacgttggagt | This study | N/A |
| pCR2.1_R_200nt_565 [A546]tccggggtcagcaccg | This study | N/A |
| MS145_IVR-IRES.FOR TTTGCCGCCAGAACACAGGAGAATTCGATCCAGTGTGCTGGAATTAA | This study | N/A |
| MS146__IVR-IRES.REV CTTGAGACAAAGGCTTGGCCATGGAAGGTCGTCTCCTTGTGGG | This study | N/A |
| MS147_Blast.FOR ACCCACAAGGAGACGACCTTCCATGGCCAAGCCTTTGTCTCA | This study | N/A |
| MS148_Blast.REV GGTTGATTACCGATAAGCTTGATATCGTTAGCCCTCCCACACATAACCAGAGGG | This study | N/A |
| Recombinant DNA | ||
| EGFP-BAF | Gift from Mattaj lab (EMBL, Heidelberg) | (Haraguchi et al., 2001) |
| EGFP-BAF (lentiviral transfer plasmid) | This study | Lab ID #1149 |
| EGFP- BAFL58R (lentiviral transfer plasmid) | This study | Lab ID #1214 |
| EGFP-P2A-BAF (lentiviral transfer plasmid) | This study | Lab ID #1150 |
| EGFP-P2A-BAFL58R (lentiviral transfer plasmid) | This study | Lab ID #1157 |
| EGFP-P2A-BAFG47E (lentiviral transfer plasmid) | This study | Lab ID #1156 |
| H14-MBP-SUMO-BAF | This study | Lab ID #1289 |
| H14-MBP-SUMO-BAFL58R | This study | Lab ID #1454 |
| H14-MBP-SUMO-BAFG47E | This study | Lab ID #1327 |
| H14-MBP-SUMO-LEM | This study | Lab ID #1299 |
| Software and Algorithms | ||
| CellCognition | http://cellcognition.org/ | (Held et al., 2010) |
| CellCognition Explorer | http://software.cellcognition.org/explorer/ | Preprint BioRxiv: https://doi.org/10.1101/134627 |
| JPK Data Processing software, | version spm-5.0.85. | |
| Graph Pad Prism7 | graphpad.com | N/A |
| RStudio, Version 1.0.136 | Rstudio.com | N/A |
| R version 3.3.2 | cran.r-project.org/ | N/A |
| Zen (2.3 SP1 (64-bit) | Zeiss | N/A |
| Imaris x64 8.4.0 (build 41512) | Bitplane | N/A |
| Other | ||
| Ibidi ‘2 well culture-inserts’ | Ibidi | 80209 |
| 5 x Transferbuffer (28.125 g/L of Trizma base and 131.25 g/L of Glycine are dissolved in Sterile Mono Q, bottled and autoclaved) | In-house media kitchen | N/A |
| Thermo Scientific Nunc Lab-Tek II Chambered Coverglas | Thermo Scientific | 155409 |
| Dynabeads® kilobaseBINDER Kit | Invitrogen | 60101 |
| μ-Slide 18 Well - Flat, ibiTreat: #1.5 polymer coverslip, tissue culture treated, sterilized | ibidi | 81826 |
| Culture-Insert 2 Well in μ-Dish 35 mm, high ibiTreat | ibidi | 81176 |
| Neodymium magnet | supermagnete.de | Q-40-10-05-N |
| TetraSpeck slides | Invitrogen | T14792 |
Contact for Reagent and Resource Sharing
Further information and requests for reagents may be directed to, and will be fulfilled by the Lead Contact Daniel W. Gerlich (daniel.gerlich@imba.oeaw.ac.at).
Experimental Model and Subject Details
Cell culture
HeLa and hTERT-RPE1 cells were cultured in Dulbecco’s modified Eagle medium (DMEM; GIBCO) supplemented with 10% (v/v) fetal bovine serum (FBS; GIBCO), 1% (v/v) penicillin-streptomycin (Sigma-Aldrich) and GlutaMAX (Thermo) at 37°C with 5% CO2 in a humidified incubator. All cell lines used in this study have been regularly tested negatively for mycoplasm contamination. The parental HeLa cell line (‘Kyoto strain’) was obtained from S. Narumiya (Kyoto University, Japan) and validated by a Multiplex human Cell line Authentication test (MCA). The hTERT-RPE1 cell line (subsequently termed RPE1) was obtained from from ATCC (see also Key Resource Table).
Method Details
Plasmids
A general lentiviral transfer vector (lentiEcoRI-Blast) was generated based on the lentiCas9-Blast vector (lentiCas9-Blast was a gift from Feng Zhang (Addgene plasmid # 52962)). The aims were to remove Cas9 from the vector, generate a universal entry site for proteins of interest and to replace the P2A-cassette with an internal ribosome entry site (IRES) that would not leave several unwanted additional amino acids on the C-terminal end of the protein of interest (see description of P2A below). For this, the Cas9-Blast cassette was removed by restriction enzyme digestion with EcoRI and AgeI and two PCR products were inserted via Gibson Assembly (New England Biolabs): the IVS-IRES cassette (IVS; chimera between introns from adenovirus and immunoglobulin heavy chain genes) from pIRESpuro3 (Clontech) and the Blasticin resistance from the original lentiCas9-Blast vector (primers see Key Resource Table). Also, the unique EcoRI site was restored upstream of the new IVS-IRES-Blast cassette as universal entry site.
The plasmid encoding EGFP-BAF (Haraguchi et al., 2001) was a gift from the Mattaj lab, EMBL, Heidelberg, Germany. The coding sequence of EGFP-BAF in this construct was inserted into the lentiviral transfer vector described above by gene synthesis and Gibson Assembly. For easy exchange of wild-type BAF with mutant versions, an AgeI restriction site was inserted into the linker immediately upstream of the start methionine of BAF. For the RNAi phenotype complementation experiments, we aimed to use minimally tagged BAF variants. To monitor expression levels via EGFP, we designed plasmids containing the P2A sequence (2A peptide from porcine teschovirus-1 polyprotein, (Szymczak et al., 2004)). The ribosome fails to insert a peptide bond at the two last amino acids of the P2A sequence, yielding two separate polypeptides from a single mRNA. EGFP-P2A-BAF was generated by gene synthesis and inserted into a lentiviral transfer plasmid via Gibson Assembly. For exchange of wild-type BAF with the respective mutants, an AgeI restriction site was inserted immediately upstream of the start methionine of BAF causing a total of three additional amino acids to the N terminus (ProThrGly). Point mutations were inserted by PCR site-directed mutagenesis and Gibson Assembly. For protein expression in E.coli cells, we used a vector contained a histidine-tag (His x 14) followed by maltose-binding-protein (MBP), a SUMO-protease cleavage site, a long serine-glycine linker and the BAF protein coding sequence. The serine-glycine linker contained a cysteine near its N terminus (AVCGSGSTGSGSSGSGGGSSGSSTGTTTG) for coupling BAF to a fluorophore. For generating an expression construct for the LEM-domain, we proceeded as follows: the N terminus of human MAN1 (aa 1 – 50), including the LEM domain (aa 6 – 50) was amplified from pSVK3-Flag-MAN1 (pSVK3-Flag-MAN1 was a gift from Howard Worman (Addgene plasmid # 26002)), retaining also the N-terminal FLAG tag. This amplicon was cloned in frame downstream of the His14-MBP-SUMO tag of the expression construct described above. All plasmids were verified by DNA sequencing and will be distributed via Addgene.org.
Construction of RIEP receptor parental cell lines
For generating cell lines stably expressing proteins of interest, we used a lentiviral vector system pseudotyped with murine ecotropic envelope that is rodent-restricted (RIEP receptor system) and allows working with lentiviruses in S1 laboratory condition with some additional precautions under local regulation. For this, HeLa and RPE1 parental cell lines were generated that express the murine ecotropic receptor (Slc7a1; from here on ‘EcoR’) on cell surface. The resulting cell lines can then be used for working with a lentiviral infection system that is mouse cell specific. To generate the parental RIEP cell lines, lentivirus was generated by mixing 4 μg pRRL-SFFV-rtTA3-IRES-EcoR-PGK-PURO (Liu et al., 2014), 2 μg pCMVR8.74 a gift from Didier Trono (Addgene plasmid # 22036) and 1 μg pMD2.G a gift from Didier Trono (Addgene plasmid # 12259) in 800 μl serum free DMEM. Upon adding 21 μl PEI (1mg/ml Stock, 25K linear Polyethylenimine, Polysciences, Inc., Cat. No. 23966-1) the mixture was vortexed 3 times and incubated at room temperature for 35 min before adding, in a dropwise manner, to 80% confluent Lenti-X 293T (Clontech, Cat. No. 632180) cells in a 10 cm dish. After 24 hr the media was replaced with fresh DMEM, FBS 10% v/v FBS, 20 mM glutamine, 10 mM sodium pyruvate. After 48 and 72 hr from the point of transfection, viral supernatant was harvested, pooled and filtered through a 0.45 μm PES filter (VWR). For infection, 5 × 10⁵ HeLa or RPE-1 cells were seeded per well in a 6 well plate in 3 mL viral supernatant containing 4 μg/ml Polybrene (EMDMillipore, Cat. No. TR-1003-G). Cells were then spinfected for 35 min at 32°C and 900 x g. After 48 hr, cells were selected for viral integration for 1 week with 2.5 μg/ml puromycin (GIBCO, Cat. No. A1113803).
Construction of stable cell lines
HeLa and RPE1 cell lines stably expressing fluorescent proteins were generated using the RIEP lentiviral system. For this, 4 × 10⁶ HEK293T cells were seeded in 10 mL DMEM in a 75 cm2 flask. 1.6 μg pCMV-Eco Envelope (CellBiolabs, RV-112), 3.2 μg pCMVR8.74 and 6.5 μg of the respective lentiviral transfer plasmid encoding the protein of interest were mixed in 1 mL of OptiMEM, mixed with 45 μl PEI (1mg/mL Stock, 25K linear, Polysciences, Inc.) and incubated for 15 min. The transfection mix was then added in a dropwise manner to the HEK293T cells. 36 hr post transfection, the virus-containing supernatant was filtered through a 0.45 μm PES filter (VWR) and transferred onto 6 × 10⁵ HeLa or RPE1 RIEP cells (target cells) in a 25 cm2 flask. HEK293T cells were incubated in fresh DMEM and the infection step was repeated 24 hr later. 48 hr after the first infection, target cells were thoroughly washed with PBS twice and incubated in fresh DMEM containing 6 μg/ml blasticidin for selection of viral integration. Another 48 hr later, the washing step was repeated and cells were FACS sorted for the respective fluorescent marker.
siRNA transfection
All siRNA transfections were performed using RNAiMAX (ThermoFisher) according to manufacturer’s instructions and at RT. Cells were harvested by trypsinization, resuspended in fresh medium and transferred into a falcon tube through a 35 μm cell strainer cap. 20 pmol siRNA (1 μl of a 20 μM stock solution in RNase-free H2O) were dissolved in 50 μl OptiMEM. 2.5 μl RNAiMAX was diluted in 50 μl OptiMEM. Both solutions were combined, mixed by pipetting and incubated for 5 min. For immunofluorescence, coverslips were transferred to 12-well plates and 50 μl siRNA mix was added. Then, 1.5 × 10⁴ HeLa cells or 2 × 10⁴ RPE1 cells in 1ml DMEM were added. HeLa cells were analyzed after 96 hr, RPE1 cells were analyzed after 96h or (when indicated) split after 72 hr, transferred to a fresh 12-well plate containing coverslips and analyzed after another 40 hr to prevent high local cell density causing inhibition of mitotic entry (112 hr total). For live cell imaging, 25 μl of the above siRNA mix was added to an 8-well LabTek chambered coverglass. 0.5 × 10⁴ HeLa cells were seeded in 300 μl DMEM medium.
Drug concentrations
The following concentrations indicate final concentrations of the drug in the respective assay. Nocodazole was used at 200 ng/ml, reversine was used at 320 nM, taxol was used at 500 nM and flavopiridol was used at 20 μM.
Immunofluorescence
Cells were grown on coverslips as described above. All subsequent steps were done at RT. Coverslips were washed with PBS and fixed with freshly made 4% formaldehyde (from 16% Formaldehyde (w/v), Methanol-free; Pierce) in PBS for 4 min. The reaction was quenched by incubation in PBS supplemented with 20 mM Tris pH 7.5 for 5 min. Cells were permeabilized with PBS containing 0.1% Triton X-100 for 1 min and washed with PBS. Samples were blocked with 2% bovine serum albumin in PBS (blocking solution) for 15 min and then incubated with the primary antibody (see Key Resource Table for dilutions used) in blocking solution for 3 hr. Samples were washed for 5 min in PBS (repeated three times) and then incubated with the respective secondary antibody (1:500) in blocking solution for 1 hr. Samples were washed for 10 min in PBS (repeated three times) and embedded in Vectashield. For immunofluorescence of tubulin, cells were fixed for 6 min in −20°C methanol, transferred back to PBS at RT with two washes and then permeabilized and stained as described above.
Immunoprecipitation
For immunoprecipitation, 10 μl Dynabeads protein G (per sample) were washed in lysis buffer (20 mM Tris pH 7.5; 150mM NaCl; 0.01%TX100 supplemented with 1 x cOmplete protease inhibitor) and coupled with 2 μg anti-GFP antibody for 30 min at RT. Alternatively, 10 μl Flag beads M2 were used per sample. Cells were harvested by trypsinization and the reaction was quenched with prewarmed DMEM. All subsequent steps were performed at 4°C or on ice unless stated otherwise. 1 × 10⁶ cells were collected by centrifugation, washed once in PBS and resuspended in 0.5 mL lysis buffer. Cells were lysed by 5 strokes in a syringe equipped with a 0.4 × 25mm needle and the resulting cell extract was cleared from cell debris by centrifugation at 21,000 x g. The supernatant was transferred to a fresh tube and a 40 μl sample was taken (‘input’). The remaining supernatant was then incubated with the respective beads for 45 min while rotating. Beads were washed three times for 3 min in 500 μl lysis buffer (transferred to a fresh tube after the first wash) and eluted with 45 μl 2 x concentrated SDS-containing sample buffer (without DTT) for 5 min at RT. The supernatant (‘eluate’) was transferred into a fresh tube, supplemented with DTT (10 mM final) and frozen.
Immunoblotting
Samples were separated by Novex NuPAGE SDS-PAGE system using 4%–12% BisTris gels in MES running buffer according to manufacturer’s instructions. All steps were done at RT. Proteins were transferred to Amersham Hybond P 0.2 μm pore size PVDF membrane in a BioRad Mini Trans-Blot Cell at 25 V constant for 16 hr in SDS-free transfer buffer (50 mM Tris base (Trizma), 384 mM glycine). Membranes were blocked in 5% (w/v) milk powder in PBS (blocking solution) for 15 min and incubated for 3 hr with the primary antibody diluted in blocking solution at concentrations indicated in the Key Resource Table. Membranes were washed three times in PBS containing 0.2% Tween 20 (v/v) for 5 min and then incubated for 1 hr at RT with the respective species-specific secondary antibody coupled to horseradish peroxidase. Membranes were washed three times in PBS containing 0.2% Tween 20 (v/v) for 10 min and incubated in ECL Plus Western Blotting Substrate (Thermo Scientific) for 5 min. Chemiluminescence was documented on a ChemiDoc MP (BioRad) system. All immunoblots were recorded with no saturated pixels.
Live cell imaging
Confocal microscopy was performed on a customized Zeiss LSM780 microscope equipped with an incubation chamber (European Molecular Biology Laboratory (EMBL), Heidelberg, Germany), using a × 40, 1.4 NA, Oil DIC Plan-Apochromat objective (Zeiss) and controlled by ZEN 2011 software and an autofocus macro (Autofocuscreen, http://www.ellenberg.embl.de/index.php/software) provided by the Ellenberg lab (EMBL), Heidelberg, Germany. Further (when indicated in the figure legend), a supervised machine learning program was used to systematically search low resolution images online for metaphase cells, return the position to the Autofocuscreen macro and trigger the acquisition of a high-resolution time lapse recording. Cells were maintained at 37°C in a humidified atmosphere of 5% CO2. HeLa and RPE1 cell lines were grown on LabTek II chambered coverglass (Thermo Scientific) in DMEM containing 10% (v/v) FBS and 1% (v/v) penicillin-streptomycin, but without phenol red and riboflavin to reduce autofluorescence (Schmitz et al., 2010).
Genome editing
Genome editing was performed using a CRISPR/Cas9 double-nicking strategy to minimize off-target mutagenesis (Ran et al., 2013). Single-guide RNAs (sgRNAs) were designed using an online tool (Ran et al., 2013). Oligonucleotides encoding the respective sgRNA sequence (see Key Resource Table) were annealed, phosphorylated and inserted into BbsI-digested pSpCas9n(BB)-2A-GFP (pX461, Addgene plasmid #48140) by ligation (Ran et al., 2013). For inserting the L58R mutation homozygously into the genome by homology directed repair, a repair template was designed that contained 750 nucleotide flanks around the inserted point mutation and a unique AgeI restriction site as shown in Figure S5C. Also the protospacer adjacent motif (PAM) was mutated to prevent re-nicking of a successfully exchanged genomic site (see also Figure S5C). 1.5 × 10⁵ HeLa Kyoto cells were seeded in a 6-well plate and transfected 24 hr later. For this, 100 μl OptiMEM was mixed with 500 ng of each of the two sgRNA containing Cas9 plasmids and 500 ng of the repair template plasmid, and subsequently supplemented with 3 μl X-treme GENE 9 (Roche). The mix was incubated for 15 min at RT and added dropwise to the well. Cells were FACS-sorted two days later for the presence of Cas9 and GFP (‘cell pool’). After another seven days, the pool was sorted into 96-well plates (single cell per well), this time selecting for the absence of GFP (to make sure Cas9 is not present anymore and the clones have a stable genome). Following initial expansion of the clonal cell lines, they were split into 12-well plates (for further expansion) and 96-well plates for genotyping. Genomic DNA was prepared by removing the medium, adding 100 μl QuickExtract (epicenter) and incubating 10 min at RT. Cells were resuspended by pipetting and transferred to PCR strips, vortexed for 15 s, incubated at 65°C for 15 min, vortexed for 15 s and incubated at 98°C for 5 min. 1 μl of this solution was used for the genotyping PCR. The genotyping PCR primers were designed such that one of the primers was outside of the flanks used in the repair template to prevent amplification of residual plasmid. PCR products were analyzed by AgeI digest, which results in complete product cleavage in case of homozygous insertion of the mutation. This was validated by Sanger DNA sequencing. We usually designed three sgRNA pairs and confirmed activity of the guide pair on the cell pool by batch genomic DNA extraction and amplification of the genomic target site. Sanger DNA sequencing of the PCR product results in a diagnostic overlay of sequence tracks at the genomic target site in case the guide pair was active and caused insertions and deletions into the genome. The deletion of the siBAF#2 binding site in one of the alleles was induced by a double-nicking strategy (see Key Resource Table for sgRNA sequences) and validated by PCR amplification of the genomic target site at a single clone level. Allelic sequences were validated by subcloning genotyping amplicons into plasmids and Sanger DNA sequencing.
DNA coated beads
DNA coated beads were generated using kilobaseBINDER Dynabeads (Invitrogen). Non-coding DNA of the pCR2.1 plasmid (standard cloning plasmid from Life technologies TOPO TA cloning kit) was amplified by PCR. The forward primer contained a biotin attached to a linker (Biotin-TEG) at the 5′ end, while the reverse primer was labeled with Alexa Fluor 546 at the 5′ end. The resulting amplicon of 250 base pairs was gel-purified and 400 ng of the product were coupled to 5 μl kilobaseBINDER Dynabeads according to manufacturer’s instructions. Beads were then transferred to 100 μl assay buffer (20 mM Tris pH 7.5, 150 mM NaCl, 0.01% TX-100) and stored at 4°C.
DNA bead binding assay
DNA-coated beads (5 μl) were diluted in 95 μl assay buffer (20 mM Tris pH 7.5, 150 mM NaCl, 0.01% TX-100). 20 μl of this suspension was incubated with 200 nM fluorescently labeled BAF protein (Alexa Fluor 488) and 100 nM fluorescently labeled LEM-domain protein (Alexa Fluor 633) for 5 min at RT and transferred to imaging chambers (μ-Slide 18 Well; ibidi) for confocal microscopy analysis.
DNA bead clustering assay
DNA-coated beads (10 μl) were diluted in 90 μl assay buffer (20 mM Tris pH 7.5, 150 mM NaCl, 0.01% TX-100) with freshly added 0.5 mM MgCl2, 1 mM ATP and 2 mM DTT (final concentrations). 10 μl of the paramagnetic beads were transferred to a fresh tube and collected by placing a magnet on the side of the tube. BAF was added in a volume of 10 μl in the presence of the magnet to a final concentration of 1 μM at RT. BAFG47E was added to 5 μM. Samples were incubated for 10 min in the presence of the magnetic field, then the field was removed and samples were transferred to imaging chambers (μ-Slide 18 Well; ibidi) and analyzed on a confocal microscope. 5 μl VRK1 kinase in assay buffer was added (150 nM final) to the BAF and the BAFL58R containing samples, incubated for 10 min and imaged again.
For binding to monodispersed beads, twice the amount of all reagents was used and BAF was added without a magnetic field. The mixture was then rotated during incubation for 10 min. Residual unbound BAF was washed off by pelleting beads with a 5 s spin in a table top centrifuge and exchange of the supernatant with fresh assay buffer. The sample was then split and one half was incubated in a magnetic field for 5 min while the other half was rotated. Samples were then imaged as described above.
RNAi screen
The RNAi screen targeted a total of 1,295 genes including genes that had previously been linked to mitosis in the MitoCheck genome-wide RNAi-depletion study (Neumann et al., 2010), genes predicted to be involved in chromosome condensation (Hériché et al., 2014) and components of the chromosome periphery. A complete list of all siRNA sequences used in this screen was previously published (Cuylen et al., 2016). siRNAs were delivered using solid-phase reverse transfection (Erfle et al., 2008) in 384-well imaging plates (Falcon). HeLa cells stably co-expressing H2B-mCherry and Lamin B-GFP were harvested by trypsinization and resuspended in imaging medium. 900 cells were seeded per 394-well using a Multidrop Reagent Dispenser (Thermo Scientific). 40 hr post siRNA transfection (‘pre-drug time point’), cells were imaged using an automated wide-field fluorescence screening microscopy (ImageXpressMicro XL, Molecular Devices) equipped with reflection-based laser autofocus and a × 20, 0.75 NA, S Fluor dry objective (Nikon). All images were flatfield-corrected with the Metamorph software (Molecular Devices) using background images acquired in empty wells to compensate for inhomogeneous illumination. Images were recorded in two z-planes with 4 μm off-set to capture in-focus images of flat interphase cells and rounded mitotic cells. Then, nocodazole (200 ng/ml final concentration) and reversine (320 nM final concentration) were added using the Multidrop Reagent Dispenser and cells were imaged every 4 hr for a total of 20 hr. The last time point was used for the analysis (‘post-drug time point’). The obtained images were automatically analyzed by in-house-developed supervised machine learning software CellCognition (Held et al., 2010). Nuclei and mitotic chromosomes were segmented by local adaptive threshold based on the H2B-mCherry signal. Classifiers for the pre-drug time point (‘interphase’, ‘mitotic’, ‘apoptotic’) were trained on wells that included positive and negative control siRNAs, the former targeting INCENP, KIF11, PLK1, CDC20. All positive controls showed the expected phenotypes (Neumann et al., 2010), validating siRNA transfection efficiency. Wells that contained > 15% apoptotic cells or < 50 cells total at the pre-drug time point were excluded from further analysis. For the post-drug time point, an additional class (‘micronucleated’) was trained on cells that were imaged 20 hr post addition of 500 nM taxol and 320 nM reversine, which resulted in a pronounced micronucleation phenotype (see Figure 1E).
Protein expression and purification
Recombinant wild-type BAF and its mutants were purified under denaturing conditions by Ni(II) chelate chromatography as previously described (Harris and Engelman, 2000, Zheng et al., 2000) with adaptations to in-house equipment. 5 l of E. coli expression culture (E. coli BL21 (DE3); 25°C overnight, shaking at 220 rpm) were harvested and resuspended in 5 mL denaturing lysis buffer (20 mM HEPES; 150 mM KCl; 20 mM imidazole pH 7.5; 8 M urea) per gram cell pellet. Cells were sonicated and the resulting lysate was cleared by centrifugation at 19,000 rpm at 4°C. The supernatant was loaded on a HisTrap FF column (GE Healthcare), washed extensively with lysis buffer and eluted with high imidazole buffer (20 mM HEPES; 150 mM KCl; 500 mM imidazole pH 7.5; 8M urea). Elution fractions were controlled by Coomassie-stained SDS-PAGE and BAF-containing fractions were pooled and buffer exchanged to 20 mM HEPES, 150 mM KCl pH 7.5, 2M Urea. Proteins were then refolded by dialysis against 50 mM potassium phosphate pH 6.5, 200 mM NaCl, 10 mM EDTA, 5 mM DTT over night at 4°C (all following steps also at 4°C). Also, 500 μl of SenP2 Protease (3.9 mg/ml) was added to the samples and cleavage was performed while dialyzing (dialysis tube had a 3 kDa molecular weight cut-off). The resulting protein solution was cleared by centrifugation at 19,000 rpm and the supernatant was loaded onto a pre-equilibrated 5 mL HisTrap FF column to remove the His14-MBP-SUMO tag. The flow-through fractions containing untagged BAF were pooled, concentrated using Vivaspin centrifugal concentrators and purified on a Superdex 75 16/60 column pre-equilibrated with storage buffer (20mM Tris pH7.0; 150mM NaCl; 0.1mM EDTA; 5mM DTT; 10% glycerol). Elution fractions were checked for purity by Coomassie-stained SDS-PAGE, pooled and snap-frozen in liquid nitrogen. The recombinant LEM-domain was purified as follows: the protein was expressed in E. coli (E. coli BL21 (DE3); 25°C overnight, shaking at 220 rpm) and purified from cleared lysates at 4°C under native conditions in lysis buffer (50 mM Tris pH 7.5; 200 mM NaCl; 4 mM DTT and 1x cOmplete protease inhibitor (Roche)) by binding to a HisTrap FF column (GE Healthcare), washing with native lysis buffer supplemented with 20 mM imidazole pH 7.5 and elution with native lysis buffer containing 500 mM imidazole pH 7.5 analogous to the procedure described above. The protein containing fractions were pooled, dialyzed and protease cleaved. Removal of the His14-MBP-SUMO tag, gel filtration and freezing was performed as above.
Protein labeling
For fluorescent labeling with maleimide-containing fluorophores, proteins were transferred into PBS by desalting on an 0.5 mL Zeba spin desalting column (ThermoFisher; 7 kDa molecular weight cut-off) according to manufacturer’s instructions. All steps were performed at 4°C or on ice. Purified BAF proteins contained a total of five cysteins, of which four are in the BAF coding sequence and likely not accessible due to their internal position in the protein fold. The fifth cysteine is near the N-terminal end of the long glycine-serine linker. The protein concentration was quantified following buffer exchange to PBS and an equimolar amount of Alexa Fluor 488-maleimide in PBS was added. The reaction was incubated for 30 min and quenched by the addition of DTT (10 mM final). Free fluorophores were removed by a second desalting step using 0.5 mL Zeba spin desalting column (7 kDa molecular weight cut-off) that were pre-equilibrated with storage buffer (20 mM Tris pH7.5; 150 mM NaCl; 1mM DTT (freshly added); 0.01% Triton X-100; 10% Glycerol). Protein concentration and labeling efficiency were quantified on a NanoDrop 2000 (ThermoFisher) and proteins were snap-frozen in liquid nitrogen. All protein preparations had a labeling efficiency of approximately 60%. The recombinant LEM-domain contains a single cysteine in the linker region. Therefore, all steps were as for the BAF proteins except that a 2-fold molar excess of Alexa Fluor 633-maleimide was added.
Chromatin purification
HeLa wild-type cells were harvested by trypsinization from an 80% confluent 15 cm dish. All steps were performed at 4°C or on ice. 1 × 10⁷ cells were washed in PBS and resuspended in 1 mL lysis buffer (20 mM Tris pH 7.5; 100 mM NaCl; 0.01% Triton X-100; 5 mM MgCl2; 0.2% NP-40 equivalent). Cells were lysed by 5 strokes through a syringe with 0.4 × 19 mm needle and the resulting lysate was centrifuged for 3 min at 3,400 x g. The chromatin-containing pellet was resuspended in high-salt buffer (20 mM Tris pH 7.5; 1 M NaCl; 0.01% Triton X-100; 5 mM MgCl2), incubated for 5 min and centrifuged for 3 min at 21,000 x g. The pellet was again resuspended in high salt buffer, incubated for 5 min and centrifuged for 3 min at 21,000 x g. The final pellet was resuspended in 300 μl storage buffer (20 mM Tris pH7.5; 150 mM NaCl; 0.01% Triton X-100; 10% Glycerol). Chromatin was sheered by 8 strokes through a syringe with a with 0.8 × 38 mm needle and snap-frozen in liquid nitrogen.
Chromatin-BAF binding assay in vitro
A 35 mm μ-Dish (Culture-Insert 2 Well; ibidi) was coated with 0.1% w/v poly-lysine by incubation at RT for 15 min and thoroughly washed with H2O three times and assay buffer (20 mM Tris pH 7.5, 150 mM NaCl, 0.01% TX-100, 1 mM DTT, 0.1 mM ATP and 0.2 mM MgCl2) once. 10 μl of the purified chromatin preparation was mixed with 40 μl assay buffer (+ Hoechst 33342 at 10 μM), added to one of the two wells and incubated for 15 min. After a single wash with assay buffer, chromatin structures of approximately 80 – 120 μm in size were imaged over time by an X-Z line scan on a confocal microscope. BAF or BAFG47E, labeled with Alexa Fluor 488, were then added in 20 μl assay buffer to a final concentration of 1 μM, followed by the addition of recombinant VRK1 in 20 μl assay buffer to a final concentration of 40 nM (for wild-type BAF only).
Dextran diffusion assay in chromatin in vitro
Dextran diameter was calculated from the radius of gyration (Lénárt et al., 2003) based on the hydrodynamic radius (15.9 nm for 500 kDa dextran (Armstrong et al., 2004)). The 500 kDa dextran therefore has a diameter of 15.9 nm x 1.54 × 2 = 48.9 nm. However, it should be noted that this only represents the mean value. The value for the 4.4 kDa dextran was calculated as follows: 1.4 nm x 1.54 × 2 = 4.3 nm.
Purified chromatin was immobilized as described for ‘Chromatin-BAF binding assay in vitro’ in assay buffer assay buffer (20 mM Tris pH 7.5, 150 mM NaCl, 0.01% TX-100, 1 mM DTT, 10 μM Hoechst 33342). Then BAF was added in volume of 10μl to a final concentration of 5 μM (BAF labeled with Alexa Fluor 488 was spiked in at 10% concentration) and incubated for 15 min. Dextrans were dissolved to a final concentration of 25 mg/ml in assay buffer (w/o DTT) and further diluted to a working stock of 0.8 mg/ml. Chromatin structures of approximately 200 - 700 μm in size were imaged over time by an X-Y scan on a confocal microscope during addition of fluorescently labeled dextran to the buffer. To enhance intermixing, 30 μl buffer was removed from the well and 70 μl dextran solution was added (0.6 mg/ml final concentration).
Chromatin elasticity measurements
Chromatin elasticity was assessed by indentation experiments using the pyramidal tip on a cantilever in an atomic force microscope (AFM) setup. All AFM experiments were carried out on a CellHesion 200 system (JPK Instruments, Germany) at 25°C. Silicon nitride cantilever chips (MLCT, Veeco (now Bruker AFM Probes, CA)) were surface-activated in a low-pressure air plasma generated in a plasma cleaner (Harrick Plasma, NY) for 3 min. Subsequent passivation was achieved by incubation in a drop of heat-inactivated fetal bovine serum (Thermo Fisher) at 4°C for a few hours or overnight. Glass-bottom tissue culture dishes (FluoroDish, World Precision Instruments, FL) were equipped with Ibidi ‘2 well culture-inserts’ and coated with 0.1% w/v poly-lysine by incubation at room temperature for 15 min. After thorough rinsing with assay buffer (20 mM Tris pH 7.5, 150 mM NaCl, 0.01% TX-100, 1 mM DTT, 0.1 mM ATP, and 0.2 mM MgCl2), 10 μl purified chromatin suspension in 100 μl assay buffer was added and allowed to adhere for 10 min at RT. Supernatant and ‘2 well culture-inserts’ were removed and the dish was filled with 4 mL assay buffer. The cantilever chip was thorough rinsed in PBS and mounted on the AFM, submerged into the medium and the triangular cantilever C (nominal spring constant k = 10 mN m-1) was calibrated using the thermal noise method (Hutter and Bechhoefer, 1998) (measured spring constants 15-19 mN m-1). In each experiment, positions of six to ten similarly sized chromatin fragments (50-100 μm diameter) were selected and force-indentation (F-δ) curves were acquired at every position with 0.5 μm s–1 approach velocity (loading rate 7.5-9.6 nN s-1) up to a setpoint of 1 nN. Wild-type BAF was added to a final concentration of 190 nM and after approximately 25 min, a second series of F-δ curves was recorded at the same positions under identical conditions. Then, VRK1 kinase was added to a final concentration of 3.2 nM and a third set of F-δ curves was acquired approximately 25 min after addition. The BAF dimerization mutant BAFG47E was measured under identical conditions as the wild-type protein, except 45 min after protein addition were given to allow additional time for complete binding to chromatin and no VRK1 addition was recorded. F-δ curves were analyzed using the JPK Data Processing software, version spm-5.0.85. The Hertz model was applied to determine the Young’s modulus, E, of chromatin; it assumes a linear and isotropic material with (infinitely) large dimensions compared to the probing indentation. The F-δ relationship for four-sided pyramidal indenters
with the edge half-angle (an average value of the nominal angles) of the cantilever tip and Poisson’s ratio (standard value for biological materials) was used as a model to fit experimental F-δ curves. The range of the fit was adjusted to cover only the first “elasticity regime” beyond the contact point, typically 50 to 500 nm into the sample. Thus, E obtained from these fits reflects the elasticity of the outermost layer of the probed chromatin structures.
Quantification and Statistical Analysis
Sample numbers and statistical tests
All sample numbers shown are from three independent experiments, except Figures 3G, 3H, 4G and 7M (four independent experiments), 3A and 4H (two independent experiments) and 7J (five independent experiments).
The sample numbers for the siRNA complementation experiment in Figure 4G are n = 982; 702; 882; 981; 987 (siControl / parental cell line; siBAF / parental cell line; siBAF / WT transgene; siBAF / L58R transgene; siBAF / G47E transgene) cells and for Figure 4L are n = 954; 805; 741 (siControl / parental cell line; siControl / BAFL58R cell line; siBAF / BAFL58R cell line) cells.
The following statistical tests have been applied based on the criteria described below to determine significance. Figures 1J and 3H was analyzed by Kolmogorov-Smirnov test, Figure 1K by two-tailed t test, Figure 3E by Mann-Whitney test, Figures 4D, 4E, 4G, 4L, and 6H by one-way ANOVA with Tukey’s correction for multiple comparisons, Figure 7C by Kruskal-Wallis with Dunn’s correction for multiple comparison, Figure 7F by Friedman test with Dunn’s correction for multiple comparison and Figure 7G by two-tailed Wilcoxon test.
Statistical analysis
Indicated sample number refers to total number of samples from all biological replicates. Data were tested for normality and equal variances with Shapiro–Wilk or D’Agostino & Pearson normality test and Levene’s tests (α = 0.05), respectively. The appropriate statistical test was then chosen as follows: Unpaired normal distributed data were tested with a two-tailed t test (in case of similar variances) or with a two-tailed t test with Welch’s correction (in case of different variances). Unpaired non-normal distributed data were tested with two-tailed Mann–Whitney test (in case of similar variances) or with a two-tailed Kolmogorov–Smirnov test (in case of different variances). Paired data with non-normal distribution were tested with a two-tailed Wilcoxon test. Three or more groups were analyzed by one-way ANOVA with Tukey’s correction for multiple comparison if groups were unmatched, and by Friedman test with Dunn’s correction for multiple comparison if groups were matched. In case of non-normal distribution in unmatched samples, Kruskal-Wallis with Dunn’s correction for multiple comparison was used.
The following definitions of significance are shown in the respective figures: ∗∗∗∗p < 0.0001 for Kolmogorov-Smirnov test; ∗∗∗∗p < 0.0001 for two-tailed t test; ∗∗∗∗p < 0.0001 and ns > 0.05 for Mann-Whitney test; ∗∗∗∗p < 0.0001, ∗∗∗p < 0.0002, ∗∗p < 0.0021, ∗p ≤ 0.05 and ns > 0.05 for one-way ANOVA with Tukey’s correction for multiple comparisons; ∗∗∗∗p < 0.0001 for Kruskal-Wallis with Dunn’s correction for multiple comparison; ∗∗∗p < 0.0002 for Friedman test with Dunn’s correction for multiple comparison and ns > 0.05 for two-tailed Wilcoxon test.
All test were performed with Prism7, except Levene’s test was performed in R.
Quantification of RNAi phenotypes
Following siRNA-mediated target protein depletion and fixation of cells at the respective time point (usually 96 hr post siRNA transfection unless specified differently), cells were stained for DNA with Hoechst 33342. Tile scan images of cells (425 × 425 μm for HeLa cells and 708 × 708 μm for RPE1 cells) were recorded by confocal microscopy and imported into the supervised machine learning software CellCognition Explorer. Chromatin was segmented using a local adaptive threshold (Held et al., 2010). The software then cropped the tile images into numerous gallery images that contain only a single cell, and blinds the siRNA treatment context. Also, 238 image features describing the segmented chromatin are calculated (Held et al., 2010). A classifier was trained on these gallery images of nuclei (classes: ‘normal’ and ‘micronucleated’) using 0.5 - 3% of the total cell number (usually 30 – 60 cells per class). Classification was optimized by multiple rounds of phenotype class prediction and re-annotation of mis-classified cells (still in the blinded context). Once a reliable classifier was trained, all cells were automatically grouped into class annotations, and the software subsequently decoded the treatment to produce a class count output that was used to calculate fractions of total. Statistical testing and plotting were done in Prism 7 software.
Quantification of number of post-mitotic nuclei per cell
The time-lapse microscopy data shown in Figures 1B and 1E were analyzed by manual classification using the ‘cell counter’ plugin in the Fiji software package (ImageJ version 1.48v). Samples were not blinded.
3D reconstruction of super-resolution microscopy images
Immunofluorescence images were recorded as Z stacks with an offset of 152 nm at optimal settings for X-Y-Z resolution at an LSM 880 with Airy scan in super-resolution mode and subsequent deconvolution in the Zen software package. 3D reconstruction of the nuclear envelope surface was performed using Bitplane Imaris software.
Quantification of nucleus/cytoplasmic ratio of IBB-EGFP
The analysis was performed using Fiji (ImageJ version 1.48v). Live cells stably expressing H2B–mCherry and the nuclear import substrate IBB-EGFP were imaged by confocal microscopy and a single confocal section through the center of the nucleus was used for analysis. The nucleus was segmented as follows: the chromatin channel was blurred by a Gaussian Blur (σ = 2) and auto-thresholded using the Otsu threshold, the image was then converted to binary and a ‘fill holes’ operation was applied. The binary mask was converted into a region of interest (ROI; ‘nucleus’) and a second ROI was generated by dilating the nucleus segmentation by one pixel and then making a band of 10 pixels width around it (‘cytoplasm’). These two ROIs were used to measure IBB-EGFP signal (background signal was subtracted by measuring signal outside of cells) and a ratio of nucleus/cytoplasm was calculated.
Quantification of Lap2β-EGFP on anaphase chromosome ensembles
High-resolution time-lapse confocal microscopy of cells automatically selected in metaphase (9 slices in total) was analyzed using CellCognition Explorer. For the intensity measurements in the EGFP channel of a central z-slice, we defined a primary segmentation mask in the chromatin channel by applying a local adaptive threshold. This primary mask was used to calculate different secondary masks: erosion by 10 pixels (‘internal signal’), dilation by 2 pixels (‘total signal’) and a ring mask which is the dilated minus the eroded mask (‘rim signal’). These secondary masks were used for intensity measurements in the EGFP channel. Cells touching the image boundary were excluded from analysis. For tracking the chromosome ensembles over time, a nearest neighbor tracking approach that recognized also split and merge events of cell trajectories was used. Trajectories that did not contain a split event or contained a split event caused by segmentation errors or linking errors caused by the tracking algorithm were excluded from analysis.
Quantification of anaphase chromosome ensemble circularity and geometry
The following analysis was performed on the high-resolution time-lapse confocal microscopy dataset described above using CellCognition Explorer. The measurements were performed on a maximum intensity projection along the z-coordinate of the high-resolution stacks of the chromatin channel. Chromosome ensembles were tracked as maximum intensity projections as described for the single z-slice above. For the width and height measurements, a minimum area bounding box was fit around the individual chromosome ensembles. Circularity was measured on the segmentation outline of the maximum intensity projection (; p = perimeter; A = area) (Held et al., 2010). Tracking of the maximum intensity projection data was more robust than the single z-slice data, resulting in more analyzable trajectories.
Analysis of protein binding to DNA-beads
The following analysis was performed using CellCognition Explorer. DNA-coated beads were imaged as a single confocal section and segmented by local adaptive thresholding using the DNA signal. A ring segmentation representing the bead surface was defined using the segmentation settings of the software tool. BAF and LEM fluorescence were measured in this segment in the respective channels.
Analysis of DNA-bead clustering
Clustering of DNA-coated beads was analyzed with Fiji (ImageJ version 1.48v). Confocal sections of the beads were recorded, the DNA channel was blurred by a Gaussian Blur (σ = 1) and auto-thresholded using the Otsu threshold. The image was then converted to a mask and a ‘fill holes’ operation was applied. Then an ‘analyze particles’ operation was performed and particle size was plotted.
Analysis of line profiles across the nuclear envelope
Confocal sections through the nuclei of interphase cells were recorded and line profiles across the nuclear envelope (nucleus to cytoplasm) were generated using Fiji (ImageJ version 1.48v). Automatic alignment of the EGFP profiles based on the nuclear boundary defined by Hoechst staining showed variability greater than the EGFP peak width itself. Therefore, line profiles were aligned by smoothing the EGFP profile in R (smooth.spline; ‘stats’ package) and detection of the curve maximum. This position was then used to align the original data. Measurements were normalized to the mean nuclear signal (mean signal from −2 μm to −0.5 μm).
Chromatin surface line profiles
Confocal images (as shown in Figure 5B) were analyzed using Fiji (ImageJ version 1.48v). In a single confocal z-slice, the chromatin surface was outlined manually in the DNA channel using the ‘freehand line’ tool. This outline was used to segment the respective other channels by using the ‘straighten’ command and a width setting of 30 pixels.
Analysis of BAF enrichment on chromatin during mitotic exit
Three-dimensional confocal time-lapse images of cells were analyzed using Fiji (ImageJ version 1.48v). For each cell, a single central z-slice was chosen and background signal was measured outside the cell. Chromatin was segmented by blurring the H2B channel using a Gaussian Blur (σ = 2) and auto-thresholding using the Otsu threshold. The ‘chromatin’ region of interest (ROI) was then defined by the ‘analyze particles’ operation. The ‘cytoplasm’ ROI was generated by dilating the ‘chromatin’ ROI by 13 pixels and using the ‘make band’ operation with a width setting of 10 pixels. These ROIs were then used to measure signal in the EGFP channel (background subtracted). Using R, the signals were normalized to the mean value measured during the first three time points in the ‘cytoplasm’ ROI and a ratio of ‘chromatin’ over ‘cytoplasm’ was calculated over time for each cell.
Analysis of BAF enrichment on chromatin and chromatin compaction in vitro
Confocal X-Z line scan time-lapse data of chromatin attached to a glass surfaces were analyzed using Fiji (ImageJ version 2.0.0.-rc-54/1.51 g). Line profiles across the chromatin surface were drawn and converted to kymographs using the ‘KymographBuilder’ (https://github.com/fiji/KymographBuilder). A chromatin ‘surface’ and ‘internal’ ROI in this kymograph were defined by drawing two rectangles based on the chromatin channel. These ROIs were then used to measure fluorescence in the BAF channel over time. Chromatin compaction was analyzed in the chromatin channel of the kymographs by measuring the height difference after BAF addition and VRK1 addition respectively as shown in Figure 6G. For analysis of BAF-EGFP enrichment on live anaphase cells, line profiles were drawn across the chromosome ensemble surface (as in Figure S7K) and cytoplasmic signal was subtracted. Gaussian fitting of the resulting curves was done in Prism 7 using the built-in analysis function using a least-squares (ordinary) fit and full width half maximum (FWHM = 2.35 ∗ standard deviation of the Gaussian fit) was calculated. To improve accuracy, we imaged fluorescent beads of a known size (n = 28, 500 nm diameter) with identical acquisition settings, analyzed FWHM analogously and calculated a correction factor (1.43).
Analysis of dextran diffusion in vitro
Confocal time-lapse data of chromatin attached to a glass surfaces were analyzed using Fiji (ImageJ version 2.0.0.-rc-54/1.51 g). Line profiles across the buffer-chromatin boundary with a line width of 20 pixels were analyzed for the respective time points following dextran addition and values were normalized to 1 for the buffer side.
Calculation of network density
We calculated 8607 ± 1805 BAF-mediated cross-bridges per μm3 at the chromosome ensemble surface (see manuscript main text). Therefore, every dimer occupies a cube of 1.16 ∗ 105 ± 2.44 ∗ 104 nm3, which corresponds to an average distance between BAF dimers of 48.8 nm .
Data plotting
Data were plotted with Prism7.
Author Contributions
Conceptualization: D.W.G. and M.S.; Methodology: M.S. except siBAF-resistant mutant cell line and rapamycin-target away (with M.W.G.S.), 3D reconstruction and quantification (M.W.G.S.), atomic force microscopy (with P.S.S.) and RIEP lentiviral infection system (J.G.J. and J.Z.); Software: R.H.; Formal Analysis: M.S., R.H., M.W.G.S., and P.S.S.; Investigation: M.S., except siBAF-resistant mutant cell line, rapamycin-target away, and 3D reconstruction/quantification (M.W.G.S.) and atomic force microscopy (with P.S.S.); Resources: J.G.J. and J.Z.; Writing – Original Draft: D.W.G. and M.S.; Writing – Revised Draft: D.W.G. and M.S.; Visualization: M.S.; Supervision: D.W.G.; Funding Acquisition: D.W.G.
Acknowledgments
The authors thank O. Wueseke (https://www.impulse-science.org), R. Foisner, D. Handler, and I. Patten for comments on the manuscript, the IMBA/IMP/GMI BioOptics core facility, the Vienna Biocenter Core Facilities GmbH (VBCF) Protein Technologies facility, the IST Austria Bioimaging Facility, and C. Blaukopf for technical support, C. Sommer for statistical advice, B.E. Mierzwa for illustration of the model figure (http://www.beatascienceart.com), and Life Science Editors for editing assistance. D.W.G. has received financial support from the European Community’s Seventh Framework Programme FP7/2007-2013 under grant agreements 241548 (MitoSys) and 258068 (Systems Microscopy), from an ERC Starting Grant (281198), from the Wiener Wissenschafts-, Forschungs- und Technologiefonds (WWTF; LS14-009), and from the Austrian Science Fund (FWF; SFB F34-06).
Published: August 24, 2017
Footnotes
Supplemental Information includes seven figures, one table, and seven movies and can be found with this article online at http://dx.doi.org/10.1016/j.cell.2017.07.038.
Supplemental Information
Fraction of total is shown for each of the phenotype classes as annotated by supervised machine learning software CellCognition. Target gene and siRNA ID are indicated as well.
Live HeLa cells stably expressing H2B–mCherry were imaged in the presence of 200 ng/ml nocodazole and 320 nM reversine. A maximum intensity projection of three confocal z-slices is shown. Scale bar is 10 μm.
Live HeLa cells stably expressing H2B–mCherry were imaged in the presence of 500 nM taxol and 320 nM reversine. A maximum intensity projection of three confocal z-slices is shown. Scale bar is 10 μm.
Live HeLa cells stably expressing H2B–mCherry/Lap2β–EGFP were imaged 72 h after siRNA transfection as indicated; metaphase cells were automatically detected by the microscope software and then imaged until they progressed to anaphase. A single representative z-section out of nine confocal sections is shown. Scale bar is 10 μm.
Live HeLa cells stably expressing BAF-EGFP and mCherry-Lap2β during mitotic exit. DNA is labeled with SiR-Hoechst and a single confocal section. Scale bar is 10 μm.
Live HeLa cells stably expressing BAF-EGFP and mCherry-Lap2β during mitotic exit. DNA is labeled with SiR-Hoechst and a single confocal section is shown. The cell was treated with 200 ng/ml nocodazole to depolymerize microtubules. 20 μM flavopiridol were added at t = 0:00 min:s to induce mitotic exit. To minimize bleaching, the first 11 frames were acquired with a time lapse of 30 s, frames 12 – 173 were acquired with a time lapse of 3 s. Scale bar is 10 μm.
Chromatin purified from HeLa cells was immobilized on a chambered glass coverslip and stained with Hoechst 33342. Alexa Fluor 488-labeled recombinant BAF was added to a final concentration of 1 μM at 00:00 min:s and recombinant VRK1 was added at 08:20 min:s to a final concentration of 40 nM. Images show X-Z scans though the chromatin structure. Scale bar is 10 μm.
Chromatin purified from HeLa cells was immobilized on a chambered glass coverslip, stained with Hoechst 33342 and incubated with recombinant BAF (Alexa Fluor 488-labeled BAF spiked in) at a final concentration of 5 μM or buffer control. 500 kDa dextran (labelled with Tetramethylrhodamine isothiocyanate) was added at 0 seconds. Images show X-Y scans though the chromatin structure. Scale bar is 20 μm.
References
- Abrams E.W., Zhang H., Marlow F.L., Kapp L., Lu S., Mullins M.C. Dynamic assembly of brambleberry mediates nuclear envelope fusion during early development. Cell. 2012;150:521–532. doi: 10.1016/j.cell.2012.05.048. [DOI] [PMC free article] [PubMed] [Google Scholar]
- Armstrong J.K., Wenby R.B., Meiselman H.J., Fisher T.C. The hydrodynamic radii of macromolecules and their effect on red blood cell aggregation. Biophys. J. 2004;87:4259–4270. doi: 10.1529/biophysj.104.047746. [DOI] [PMC free article] [PubMed] [Google Scholar]
- Asencio C., Davidson I.F., Santarella-Mellwig R., Ly-Hartig T.B.N., Mall M., Wallenfang M.R., Mattaj I.W., Gorjánácz M. Coordination of kinase and phosphatase activities by Lem4 enables nuclear envelope reassembly during mitosis. Cell. 2012;150:122–135. doi: 10.1016/j.cell.2012.04.043. [DOI] [PubMed] [Google Scholar]
- Blanco S., Klimcakova L., Vega F.M., Lazo P.A. The subcellular localization of vaccinia-related kinase-2 (VRK2) isoforms determines their different effect on p53 stability in tumour cell lines. FEBS J. 2006;273:2487–2504. doi: 10.1111/j.1742-4658.2006.05256.x. [DOI] [PubMed] [Google Scholar]
- Blomen V.A., Májek P., Jae L.T., Bigenzahn J.W., Nieuwenhuis J., Staring J., Sacco R., van Diemen F.R., Olk N., Stukalov A. Gene essentiality and synthetic lethality in haploid human cells. Science. 2015;350:1092–1096. doi: 10.1126/science.aac7557. [DOI] [PubMed] [Google Scholar]
- Cai M., Huang Y., Ghirlando R., Wilson K.L., Craigie R., Clore G.M. Solution structure of the constant region of nuclear envelope protein LAP2 reveals two LEM-domain structures: one binds BAF and the other binds DNA. EMBO J. 2001;20:4399–4407. doi: 10.1093/emboj/20.16.4399. [DOI] [PMC free article] [PubMed] [Google Scholar]
- Cai M., Huang Y., Suh J.-Y., Louis J.M., Ghirlando R., Craigie R., Clore G.M. Solution NMR structure of the barrier-to-autointegration factor-Emerin complex. J. Biol. Chem. 2007;282:14525–14535. doi: 10.1074/jbc.M700576200. [DOI] [PubMed] [Google Scholar]
- Crasta K., Ganem N.J., Dagher R., Lantermann A.B., Ivanova E.V., Pan Y., Nezi L., Protopopov A., Chowdhury D., Pellman D. DNA breaks and chromosome pulverization from errors in mitosis. Nature. 2012;482:53–58. doi: 10.1038/nature10802. [DOI] [PMC free article] [PubMed] [Google Scholar]
- Cuylen S., Blaukopf C., Politi A.Z., Müller-Reichert T., Neumann B., Poser I., Ellenberg J., Hyman A.A., Gerlich D.W. Ki-67 acts as a biological surfactant to disperse mitotic chromosomes. Nature. 2016;535:308–312. doi: 10.1038/nature18610. [DOI] [PMC free article] [PubMed] [Google Scholar]
- de Vries A.H.B., Krenn B.E., van Driel R., Subramaniam V., Kanger J.S. Direct observation of nanomechanical properties of chromatin in living cells. Nano Lett. 2007;7:1424–1427. doi: 10.1021/nl070603+. [DOI] [PubMed] [Google Scholar]
- Dechat T., Gajewski A., Korbei B., Gerlich D., Daigle N., Haraguchi T., Furukawa K., Ellenberg J., Foisner R. LAP2alpha and BAF transiently localize to telomeres and specific regions on chromatin during nuclear assembly. J. Cell Sci. 2004;117:6117–6128. doi: 10.1242/jcs.01529. [DOI] [PubMed] [Google Scholar]
- Erfle H., Neumann B., Rogers P., Bulkescher J., Ellenberg J., Pepperkok R. Work flow for multiplexing siRNA assays by solid-phase reverse transfection in multiwell plates. J. Biomol. Screen. 2008;13:575–580. doi: 10.1177/1087057108320133. [DOI] [PubMed] [Google Scholar]
- Furukawa K. LAP2 binding protein 1 (L2BP1/BAF) is a candidate mediator of LAP2-chromatin interaction. J. Cell Sci. 1999;112:2485–2492. doi: 10.1242/jcs.112.15.2485. [DOI] [PubMed] [Google Scholar]
- Furukawa K., Sugiyama S., Osouda S., Goto H., Inagaki M., Horigome T., Omata S., McConnell M., Fisher P.A., Nishida Y. Barrier-to-autointegration factor plays crucial roles in cell cycle progression and nuclear organization in Drosophila. J. Cell Sci. 2003;116:3811–3823. doi: 10.1242/jcs.00682. [DOI] [PubMed] [Google Scholar]
- Gorjánácz M., Klerkx E.P.F., Galy V., Santarella R., López-Iglesias C., Askjaer P., Mattaj I.W. Caenorhabditis elegans BAF-1 and its kinase VRK-1 participate directly in post-mitotic nuclear envelope assembly. EMBO J. 2007;26:132–143. doi: 10.1038/sj.emboj.7601470. [DOI] [PMC free article] [PubMed] [Google Scholar]
- Görlich D., Henklein P., Laskey R.A., Hartmann E. A 41 amino acid motif in importin-alpha confers binding to importin-beta and hence transit into the nucleus. EMBO J. 1996;15:1810–1817. [PMC free article] [PubMed] [Google Scholar]
- Hammond G.R.V., Fischer M.J., Anderson K.E., Holdich J., Koteci A., Balla T., Irvine R.F. PI4P and PI(4,5)P2 are essential but independent lipid determinants of membrane identity. Science. 2012;337:727–730. doi: 10.1126/science.1222483. [DOI] [PMC free article] [PubMed] [Google Scholar]
- Haraguchi T., Koujin T., Segura-Totten M., Lee K.K., Matsuoka Y., Yoneda Y., Wilson K.L., Hiraoka Y. BAF is required for emerin assembly into the reforming nuclear envelope. J. Cell Sci. 2001;114:4575–4585. doi: 10.1242/jcs.114.24.4575. [DOI] [PubMed] [Google Scholar]
- Haraguchi T., Kojidani T., Koujin T., Shimi T., Osakada H., Mori C., Yamamoto A., Hiraoka Y. Live cell imaging and electron microscopy reveal dynamic processes of BAF-directed nuclear envelope assembly. J. Cell Sci. 2008;121:2540–2554. doi: 10.1242/jcs.033597. [DOI] [PubMed] [Google Scholar]
- Harris D., Engelman A. Both the structure and DNA binding function of the barrier-to-autointegration factor contribute to reconstitution of HIV type 1 integration in vitro. J. Biol. Chem. 2000;275:39671–39677. doi: 10.1074/jbc.M002626200. [DOI] [PubMed] [Google Scholar]
- Hatch E.M., Fischer A.H., Deerinck T.J., Hetzer M.W. Catastrophic nuclear envelope collapse in cancer cell micronuclei. Cell. 2013;154:47–60. doi: 10.1016/j.cell.2013.06.007. [DOI] [PMC free article] [PubMed] [Google Scholar]
- Held M., Schmitz M.H.A., Fischer B., Walter T., Neumann B., Olma M.H., Peter M., Ellenberg J., Gerlich D.W. CellCognition: time-resolved phenotype annotation in high-throughput live cell imaging. Nat. Methods. 2010;7:747–754. doi: 10.1038/nmeth.1486. [DOI] [PubMed] [Google Scholar]
- Hériché J.-K., Lees J.G., Morilla I., Walter T., Petrova B., Roberti M.J., Hossain M.J., Adler P., Fernández J.M., Krallinger M. Integration of biological data by kernels on graph nodes allows prediction of new genes involved in mitotic chromosome condensation. Mol. Biol. Cell. 2014;25:2522–2536. doi: 10.1091/mbc.E13-04-0221. [DOI] [PMC free article] [PubMed] [Google Scholar]
- Hirano Y., Segawa M., Ouchi F.S., Yamakawa Y., Furukawa K., Takeyasu K., Horigome T. Dissociation of emerin from barrier-to-autointegration factor is regulated through mitotic phosphorylation of emerin in a xenopus egg cell-free system. J. Biol. Chem. 2005;280:39925–39933. doi: 10.1074/jbc.M503214200. [DOI] [PubMed] [Google Scholar]
- Hirano Y., Iwase Y., Ishii K., Kumeta M., Horigome T., Takeyasu K. Cell cycle-dependent phosphorylation of MAN1. Biochemistry. 2009;48:1636–1643. doi: 10.1021/bi802060v. [DOI] [PubMed] [Google Scholar]
- Hutter J.L., Bechhoefer J. Calibration of atomic-force microscope tips. Rev. Sci. Instrum. 1998;64:1868–1873. [Google Scholar]
- Itzhak D.N., Tyanova S., Cox J., Borner G.H. Global, quantitative and dynamic mapping of protein subcellular localization. eLife. 2016;5:570. doi: 10.7554/eLife.16950. [DOI] [PMC free article] [PubMed] [Google Scholar]
- Jamin A., Wiebe M.S. Barrier to Autointegration Factor (BANF1): interwoven roles in nuclear structure, genome integrity, innate immunity, stress responses and progeria. Curr. Opin. Cell Biol. 2015;34:61–68. doi: 10.1016/j.ceb.2015.05.006. [DOI] [PMC free article] [PubMed] [Google Scholar]
- Lancaster O.M., Cullen C.F., Ohkura H. NHK-1 phosphorylates BAF to allow karyosome formation in the Drosophila oocyte nucleus. J. Cell Biol. 2007;179:817–824. doi: 10.1083/jcb.200706067. [DOI] [PMC free article] [PubMed] [Google Scholar]
- Lee M.S., Craigie R. A previously unidentified host protein protects retroviral DNA from autointegration. Proc. Natl. Acad. Sci. USA. 1998;95:1528–1533. doi: 10.1073/pnas.95.4.1528. [DOI] [PMC free article] [PubMed] [Google Scholar]
- Lee K.K., Haraguchi T., Lee R.S., Koujin T., Hiraoka Y., Wilson K.L. Distinct functional domains in emerin bind lamin A and DNA-bridging protein BAF. J. Cell Sci. 2001;114:4567–4573. doi: 10.1242/jcs.114.24.4567. [DOI] [PubMed] [Google Scholar]
- Leibowitz M.L., Zhang C.-Z., Pellman D. Chromothripsis: a new mechanism for rapid karyotype evolution. Annu. Rev. Genet. 2015;49:183–211. doi: 10.1146/annurev-genet-120213-092228. [DOI] [PubMed] [Google Scholar]
- Lemaitre J.M., Géraud G., Méchali M. Dynamics of the genome during early Xenopus laevis development: karyomeres as independent units of replication. J. Cell Biol. 1998;142:1159–1166. doi: 10.1083/jcb.142.5.1159. [DOI] [PMC free article] [PubMed] [Google Scholar]
- Lénárt P., Rabut G., Daigle N., Hand A.R., Terasaki M., Ellenberg J. Nuclear envelope breakdown in starfish oocytes proceeds by partial NPC disassembly followed by a rapidly spreading fenestration of nuclear membranes. J. Cell Biol. 2003;160:1055–1068. doi: 10.1083/jcb.200211076. [DOI] [PMC free article] [PubMed] [Google Scholar]
- Liu G.J., Cimmino L., Jude J.G., Hu Y., Witkowski M.T., McKenzie M.D., Kartal-Kaess M., Best S.A., Tuohey L., Liao Y. Pax5 loss imposes a reversible differentiation block in B-progenitor acute lymphoblastic leukemia. Genes Dev. 2014;28:1337–1350. doi: 10.1101/gad.240416.114. [DOI] [PMC free article] [PubMed] [Google Scholar]
- Margalit A., Segura-Totten M., Gruenbaum Y., Wilson K.L. Barrier-to-autointegration factor is required to segregate and enclose chromosomes within the nuclear envelope and assemble the nuclear lamina. Proc. Natl. Acad. Sci. USA. 2005;102:3290–3295. doi: 10.1073/pnas.0408364102. [DOI] [PMC free article] [PubMed] [Google Scholar]
- Molitor T.P., Traktman P. Depletion of the protein kinase VRK1 disrupts nuclear envelope morphology and leads to BAF retention on mitotic chromosomes. Mol. Biol. Cell. 2014;25:891–903. doi: 10.1091/mbc.E13-10-0603. [DOI] [PMC free article] [PubMed] [Google Scholar]
- Neumann B., Walter T., Hériché J.-K., Bulkescher J., Erfle H., Conrad C., Rogers P., Poser I., Held M., Liebel U. Phenotypic profiling of the human genome by time-lapse microscopy reveals cell division genes. Nature. 2010;464:721–727. doi: 10.1038/nature08869. [DOI] [PMC free article] [PubMed] [Google Scholar]
- Nichols R.J., Wiebe M.S., Traktman P. The vaccinia-related kinases phosphorylate the N′ terminus of BAF, regulating its interaction with DNA and its retention in the nucleus. Mol. Biol. Cell. 2006;17:2451–2464. doi: 10.1091/mbc.E05-12-1179. [DOI] [PMC free article] [PubMed] [Google Scholar]
- Ohsugi M., Adachi K., Horai R., Kakuta S., Sudo K., Kotaki H., Tokai-Nishizumi N., Sagara H., Iwakura Y., Yamamoto T. Kid-mediated chromosome compaction ensures proper nuclear envelope formation. Cell. 2008;132:771–782. doi: 10.1016/j.cell.2008.01.029. [DOI] [PubMed] [Google Scholar]
- Otsuka S., Bui K.H., Schorb M., Hossain M.J., Politi A.Z., Koch B., Eltsov M., Beck M., Ellenberg J. Nuclear pore assembly proceeds by an inside-out extrusion of the nuclear envelope. eLife. 2016;5:76. doi: 10.7554/eLife.19071. [DOI] [PMC free article] [PubMed] [Google Scholar]
- Ran F.A., Hsu P.D., Wright J., Agarwala V., Scott D.A., Zhang F. Genome engineering using the CRISPR-Cas9 system. Nat. Protoc. 2013;8:2281–2308. doi: 10.1038/nprot.2013.143. [DOI] [PMC free article] [PubMed] [Google Scholar]
- Rivera V.M., Clackson T., Natesan S., Pollock R., Amara J.F., Keenan T., Magari S.R., Phillips T., Courage N.L., Cerasoli F., Jr. A humanized system for pharmacologic control of gene expression. Nat. Med. 1996;2:1028–1032. doi: 10.1038/nm0996-1028. [DOI] [PubMed] [Google Scholar]
- Santaguida S., Tighe A., D’Alise A.M., Taylor S.S., Musacchio A. Dissecting the role of MPS1 in chromosome biorientation and the spindle checkpoint through the small molecule inhibitor reversine. J. Cell Biol. 2010;190:73–87. doi: 10.1083/jcb.201001036. [DOI] [PMC free article] [PubMed] [Google Scholar]
- Schmitz M.H.A., Held M., Janssens V., Hutchins J.R.A., Hudecz O., Ivanova E., Goris J., Trinkle-Mulcahy L., Lamond A.I., Poser I. Live-cell imaging RNAi screen identifies PP2A-B55alpha and importin-beta1 as key mitotic exit regulators in human cells. Nat. Cell Biol. 2010;12:886–893. doi: 10.1038/ncb2092. [DOI] [PMC free article] [PubMed] [Google Scholar]
- Segura-Totten M., Kowalski A.K., Craigie R., Wilson K.L. Barrier-to-autointegration factor: major roles in chromatin decondensation and nuclear assembly. J. Cell Biol. 2002;158:475–485. doi: 10.1083/jcb.200202019. [DOI] [PMC free article] [PubMed] [Google Scholar]
- Shibata Y., Voeltz G.K., Rapoport T.A. Rough sheets and smooth tubules. Cell. 2006;126:435–439. doi: 10.1016/j.cell.2006.07.019. [DOI] [PubMed] [Google Scholar]
- Shimi T., Koujin T., Segura-Totten M., Wilson K.L., Haraguchi T., Hiraoka Y. Dynamic interaction between BAF and emerin revealed by FRAP, FLIP, and FRET analyses in living HeLa cells. J. Struct. Biol. 2004;147:31–41. doi: 10.1016/j.jsb.2003.11.013. [DOI] [PubMed] [Google Scholar]
- Shumaker D.K., Lee K.K., Tanhehco Y.C., Craigie R., Wilson K.L. LAP2 binds to BAF.DNA complexes: requirement for the LEM domain and modulation by variable regions. EMBO J. 2001;20:1754–1764. doi: 10.1093/emboj/20.7.1754. [DOI] [PMC free article] [PubMed] [Google Scholar]
- Skoko D., Li M., Huang Y., Mizuuchi M., Cai M., Bradley C.M., Pease P.J., Xiao B., Marko J.F., Craigie R., Mizuuchi K. Barrier-to-autointegration factor (BAF) condenses DNA by looping. Proc. Natl. Acad. Sci. USA. 2009;106:16610–16615. doi: 10.1073/pnas.0909077106. [DOI] [PMC free article] [PubMed] [Google Scholar]
- Steigemann P., Wurzenberger C., Schmitz M.H.A., Held M., Guizetti J., Maar S., Gerlich D.W. Aurora B-mediated abscission checkpoint protects against tetraploidization. Cell. 2009;136:473–484. doi: 10.1016/j.cell.2008.12.020. [DOI] [PubMed] [Google Scholar]
- Szymczak A.L., Workman C.J., Wang Y., Vignali K.M., Dilioglou S., Vanin E.F., Vignali D.A.A. Correction of multi-gene deficiency in vivo using a single ‘self-cleaving’ 2A peptide-based retroviral vector. Nat. Biotechnol. 2004;22:589–594. doi: 10.1038/nbt957. [DOI] [PubMed] [Google Scholar]
- Umland T.C., Wei S.Q., Craigie R., Davies D.R. Structural basis of DNA bridging by barrier-to-autointegration factor. Biochemistry. 2000;39:9130–9138. doi: 10.1021/bi000572w. [DOI] [PubMed] [Google Scholar]
- Ungricht R., Kutay U. Mechanisms and functions of nuclear envelope remodelling. Nat. Rev. Mol. Cell Biol. 2017;18:229–245. doi: 10.1038/nrm.2016.153. [DOI] [PubMed] [Google Scholar]
- Wandke C., Kutay U. Enclosing chromatin: reassembly of the nucleus after open mitosis. Cell. 2013;152:1222–1225. doi: 10.1016/j.cell.2013.02.046. [DOI] [PubMed] [Google Scholar]
- Webster M., Witkin K.L., Cohen-Fix O. Sizing up the nucleus: nuclear shape, size and nuclear-envelope assembly. J. Cell Sci. 2009;122:1477–1486. doi: 10.1242/jcs.037333. [DOI] [PMC free article] [PubMed] [Google Scholar]
- Zhang C.-Z., Spektor A., Cornils H., Francis J.M., Jackson E.K., Liu S., Meyerson M., Pellman D. Chromothripsis from DNA damage in micronuclei. Nature. 2015;522:179–184. doi: 10.1038/nature14493. [DOI] [PMC free article] [PubMed] [Google Scholar]
- Zheng R., Ghirlando R., Lee M.S., Mizuuchi K., Krause M., Craigie R. Barrier-to-autointegration factor (BAF) bridges DNA in a discrete, higher-order nucleoprotein complex. Proc. Natl. Acad. Sci. USA. 2000;97:8997–9002. doi: 10.1073/pnas.150240197. [DOI] [PMC free article] [PubMed] [Google Scholar]
Associated Data
This section collects any data citations, data availability statements, or supplementary materials included in this article.
Supplementary Materials
Fraction of total is shown for each of the phenotype classes as annotated by supervised machine learning software CellCognition. Target gene and siRNA ID are indicated as well.
Live HeLa cells stably expressing H2B–mCherry were imaged in the presence of 200 ng/ml nocodazole and 320 nM reversine. A maximum intensity projection of three confocal z-slices is shown. Scale bar is 10 μm.
Live HeLa cells stably expressing H2B–mCherry were imaged in the presence of 500 nM taxol and 320 nM reversine. A maximum intensity projection of three confocal z-slices is shown. Scale bar is 10 μm.
Live HeLa cells stably expressing H2B–mCherry/Lap2β–EGFP were imaged 72 h after siRNA transfection as indicated; metaphase cells were automatically detected by the microscope software and then imaged until they progressed to anaphase. A single representative z-section out of nine confocal sections is shown. Scale bar is 10 μm.
Live HeLa cells stably expressing BAF-EGFP and mCherry-Lap2β during mitotic exit. DNA is labeled with SiR-Hoechst and a single confocal section. Scale bar is 10 μm.
Live HeLa cells stably expressing BAF-EGFP and mCherry-Lap2β during mitotic exit. DNA is labeled with SiR-Hoechst and a single confocal section is shown. The cell was treated with 200 ng/ml nocodazole to depolymerize microtubules. 20 μM flavopiridol were added at t = 0:00 min:s to induce mitotic exit. To minimize bleaching, the first 11 frames were acquired with a time lapse of 30 s, frames 12 – 173 were acquired with a time lapse of 3 s. Scale bar is 10 μm.
Chromatin purified from HeLa cells was immobilized on a chambered glass coverslip and stained with Hoechst 33342. Alexa Fluor 488-labeled recombinant BAF was added to a final concentration of 1 μM at 00:00 min:s and recombinant VRK1 was added at 08:20 min:s to a final concentration of 40 nM. Images show X-Z scans though the chromatin structure. Scale bar is 10 μm.
Chromatin purified from HeLa cells was immobilized on a chambered glass coverslip, stained with Hoechst 33342 and incubated with recombinant BAF (Alexa Fluor 488-labeled BAF spiked in) at a final concentration of 5 μM or buffer control. 500 kDa dextran (labelled with Tetramethylrhodamine isothiocyanate) was added at 0 seconds. Images show X-Y scans though the chromatin structure. Scale bar is 20 μm.