Abstract
Amino acids have crucial roles in central metabolism, both anabolic and catabolic. To elucidate these roles, steady-state concentrations of amino acids alone are insufficient, as each amino acid participates in multiple pathways and functions in a complex network, which can also be compartmentalized. Stable Isotope-Resolved Metabolomics (SIRM) is an approach that uses atom-resolved tracking of metabolites through biochemical transformations in cells, tissues, or whole organisms. Using different elemental stable isotopes to label multiple metabolite precursors makes it possible to resolve simultaneously the utilization of these precursors in a single experiment. Conversely, a single precursor labeled with two (or more) different elemental isotopes can trace the allocation of e.g. C and N atoms through the network.
Such dual-label experiments however challenge the resolution of conventional mass spectrometers, which must distinguish the neutron mass differences among different elemental isotopes. This requires ultrahigh resolution Fourier transform mass spectrometry (UHR-FTMS). When combined with direct infusion nano-electrospray ion source (nano-ESI), UHR-FTMS can provide rapid, global, and quantitative analysis of all possible mass isotopologues of metabolites. Unfortunately, very low mass polar metabolites such as amino acids can be difficult to analyze by current models of UHR-FTMS, plus the high salt content present in typical cell or tissue polar extracts may cause unacceptable ion suppression for sources such as nano-ESI.
Here we describe a modified method of ethyl chloroformate (ECF) derivatization of amino acids to enable rapid quantitative analysis of stable isotope labeled amino acids using nano-ESI UHR-FTMS. This method showed excellent linearity with quantifiable limits in the low nanomolar range represented in microgram quantities of biological specimens, which results in extracts with total analyte abundances in the low to sub-femtomole range. We have applied this method to profile amino acids and their labeling patterns in 13C and 2H doubly labeled PC9 cell extracts, cancerous and non-cancerous tissue extracts from a lung cancer patient and their protein hydrolysates as well as plasma extracts from mice fed with a liquid diet containing 13C6-glucose.
The multi-element isotopologue distributions provided key insights into amino acid metabolism and intracellular pools in human lung cancer tissues in high detail. The 13C labeling of Asp and Glu revealed de novo synthesis of these amino acids from 13C6-glucose via the Krebs cycle, specifically the elevated level of 13C3-labeled Asp and Glu in cancerous versus non-cancerous lung tissues was consistent with enhanced pyruvate carboxylation. In addition, tracking the fate of double tracers, (13C6-Glc + 2H2-Gly or 13C6-Glc + 2H3-Ser) in PC9 cells clearly resolved pools of Ser and Gly synthesized de novo from 13C6-Glc (13C3-Ser and 13C2-Gly) versus Ser and Gly derived from external sources (2H3-Ser, 2H2-Gly). Moreover the complex 2H labeling patterns of the latter were results of Ser and Gly exchange through active Ser-Gly one-carbon metabolic pathway in PC9 cells.
Keywords: Ultrahigh Resolution Fourier Transform Mass Spectrometry, Stable Isotope Resolved Metabolomics, Amino Acids, Direct infusion nano-electrospray
Graphical abstract
1. Introduction
1.1 Importance of amino acid metabolism
Amino acids play crucial roles in anabolic and catabolic metabolism. Not only are they the building blocks of proteins, they also are precursors to many key metabolites and oxidized to provide metabolic energy [1]. It was reported that amino acids account for the majority of dry cell mass in proliferating mammalian cells [2]. The non-essential amino acids Ala, Asp, and Glu play important roles in nitrogen metabolism via transamination, along with Arg, Orn, and citrulline in the urea cycle. Ser, Gly, Gln, and Asp are precursors in nucleotide synthesis, providing both carbon (Asp, Gly) and nitrogen (Gln, Asp) to the nucleobases [3]. Gln is also the nitrogen donor in the synthesis of amino sugars [4]. Arg, Orn, and Met are also precursors of polyamines, which are essential in stress tolerance and nucleic acid function [5, 6]. These are just a few out of hundreds of vital metabolic roles of amino acids.
1.2 Stable Isotope-Resolved Metabolomics (SIRM) for robust pathway tracing
It is therefore crucially important to quantify amino acids to measure changes in concentrations and help determine their transformation pathways. The metabolic information contained in steady-state concentrations of metabolites, however, is often very limited, as each metabolite usually participates in multiple pathways, and most pathways are parallel, branched, reversible, and/or intersecting with each other to form a complex network. Thus, to robustly discern the precursor-product relationships for metabolic functions, it is necessary to “label” selected atoms in given metabolites so that their fates can be traced through metabolic pathways. Although radioisotopes such as 14C were popular tracers in the past [7–9], many studies now use stable isotopes since they are nonhazardous for ease-of-use, and key elements can be readily observed by both NMR (e.g. 13C and 15N) and MS, given sufficient sensitivity and resolution of the instruments [10, 11]. We have coupled stable isotope tracers with NMR and MS analysis in stable isotope-resolved metabolomics (SIRM) to track the provenance of individual atoms through various transformation pathways in cells, tissues and whole organisms (including human subjects) while still achieving wide metabolome coverage [10, 12–16]. By determining the label position (isotopomer) and number (isotopologue) distribution in the various metabolites, SIRM generates the information that is used to reconstruct the turnover in pathways and abundances of newly synthesized metabolites with low ambiguities, providing a solid foundation for metabolic flux determination [17–19].
1.3. Need for ultrahigh resolution Fourier transform mass spectrometry (UHR-FTMS)
Using multiple precursors, each with distinct stable isotopes, makes it possible to simultaneously discern intersecting, cyclical, and even compartmentalized pathways in a single experiment, thereby providing novel insights into metabolic networks as perturbed by disease or other stressors. For example, administering 13C6-glucose and 2H2-Gly simultaneously to a biological system would enable not only tracing of glycolysis, the Krebs cycle, pentose phosphate pathway (PPP), nucleotide synthesis, and one carbon metabolism pathway but also delineation of the fate of de novo synthesized or exogenously derived Gly. Interpretations would be initially based on well-established networks [20].
Stable isotopes such as 13C, 15N, and 2H differ from their most abundant isotopes by a single neutron. The apparent mass of a neutron in the nucleus differs slightly for each element due to differential nuclear binding energy [21]. The resulting mass difference for a molecule where 12C was substituted by 13C, versus 14N substituted by 15N, is too small to be resolved by the common “high resolution” mass spectrometers such as time-of-flight (TOF) MS with a maximum mass resolution (which is generally defined as m1/(m1-m2), where m1 and m2 are two peaks of equal intensity with less than 10% overlap, and by convention stated for an m/z such as 400 [22]) up to about 60,000. Instead, they can be distinguished using sufficiently high m/z resolution, as afforded by certain models of Fourier transform mass spectrometers (FTMS) [10, 13]. In practice, we have found that UHR-FTMS with a minimal resolving power in excess of 200,000 (at 400 m/z, 10% valley) is required [13, 22], and usually a resolving power of 400,000 or more is needed [22–25]. In addition to “ultra” high resolution, all current models of UHR-FTMS instruments are capable of high m/z accuracy (<0.2 ppm RMS error with external calibration) for operative assignment of molecular formula candidates, yet have high sensitivity permitting quantification of analytes at low femtomole abundance in a sample [10].
1.4 Considerations of analyte derivatization for chromatography versus direct infusion UHR-FTMS
Most, if not all, MS-based analytical methods reported for quantitative analysis of amino acids in biological systems have been in combination with gas-liquid chromatography (GC) or liquid chromatography (LC). N-(tert-butyldimethylsilyl)-N-methyltrifluoroacetamide, introduced by Fan et al. in 1986 for GCMS analysis of organic and amino acids [26], has been a widely used silylation method for GC-based quantification of amino acids in biological materials. This method provides a high yield of molecular-ion isotopologue patterns under electron ionization [26–28], making it well suited for SIRM studies. Subsequently, Husek [29] reported a method of derivatizing amino acids with ethyl chloroformate (ECF) and demonstrated the fast analysis of amino acids by GCMS. Other researchers then modified the ECF derivatization method and applied it to a variety of materials including food, plant and urine samples [30, 31]. 9-Fluorenylmethyl-chloroformate (Fmoc-Cl) coupled with high performance liquid chromatography (HPLC) or fluorescence detection was also used to analyze amino acids in fruit juices and hydrolyzed peptides [32, 33]. Related reagents such as isobutyl chloroformate, methyl chloroformate, pentafluorobenzyl chloroformate have also been reported in amino acids analysis using GCMS or LCMS [34–36], although none of these were intended for use with SIRM.
With chromatography sample introduction to the MS, the short duration of each analyte available to the MS limits signal averaging, often causing critical isotopologues to be undetected [25]. In addition, the rapidly changing concentrations presented to the MS from chromatography compromises the quality of isotopologue data required for accurate and reproducible quantification. In contrast, through extensive signal averaging, the continuous infusion UHR-FTMS acquisition can provide high quality spectra rapidly with expanded dynamic range and accurate molecular formulae. Among the direct infusion methods, we have chosen the nano-electrospray ionization source (nano-ESI) because of its high sensitivity and capability of small sample consumption (typically 15 μL) and negligible sample waste. The latter is crucial to the increasing demand for microanalysis of cell or tissue samples (particularly those from human subjects), which is a result of sample size limitations such as the need to share the same biospecimens with other analyses such as genomics, transcriptomics, and proteomics, plus a wide range of biological assessments needed for interpretation, i.e. immunohistochemistry. For these reasons, UHR-FTMS coupled with nano-ESI has been a high priority for SIRM studies.
1.5 Limitations of direct infusion FTMS analysis of amino acids can be overcome by derivatization
Nano-ESI-UHR-FTMS has been successfully applied to analyze lipids, nucleotides, and other metabolites in SIRM studies [10, 13, 23]. Despite this versatility, it has been difficult to detect some low m/z and/or polar metabolites such as amino acids and polyamines in crude cell extracts because of the ion suppression and instability of any ESI ion source caused by the high salt content inherent in crude cell or tissue extracts. This increases sample consumption, compromises sample throughput due to re-analyses, and interferes with quantitative data analysis. Furthermore, all current UHR-FTMS models are optimized for analytes with m/z greater than 150, compromising performance for smaller m/z metabolites. These problems are exacerbated by the need to analyze numerous isotopologues present at very low abundance in SIRM experiments, even abundant metabolites whose monoisotopic species are readily detected by UHR-FTMS can have low enrichment isotopologues crucial for biochemical interpretation. Lastly, the biochemical liability of some metabolites makes them impractical to quantify with confidence. Therefore, there is a need to develop a suitable derivatization method for these small metabolites for nano-ESI-UHR-FTMS analysis.
In this report, we have coupled ECF derivatization with nano-ESI-UHR-FTMS for microanalysis of amino acids. ECF can derivatize both –NH2 and –COOH groups on amino acids. After the ECF derivatization, all amino acids have an m/z greater than 170, which makes them suitable for UHR-FTMS analysis by current models. The derivatives are also more hydrophobic and can be extracted by chloroform to eliminate the salt effect. The derivatization can also stabilize some labile amino acids such as Gln. We applied the method to analyze the stable isotopologue distribution in polar extract of various isotope-labeled biological samples including single-opportunity surgical lung cancer patient tissues, lung cancer cells, patient-derived mouse xenograft tissues, hydrolyzed protein samples from these sources, and human plasmas.
2. Materials and Methods
2.1 Reagents
All unlabeled amino acid standards were purchased from Sigma Aldrich (St. Louis, MO) as a mixture of acidic and neutral amino acids (A6407) and basic amino acids (A6282). Gln, ethyl chloroformate (ECF), ethanol, pyridine and chloroform were also purchased from Sigma Aldrich. The uniformly 15N-labeled amino acids mixture was purchased from Cambridge Isotope Laboratories (NLM-6695, Cambridge, MA).
2.2 Methods
2.2.1 Preparation of amino acid standards
Immediately prior to analysis, the amino acids mixtures A6407 and A6282 were combined in equal volumes before experiments, and then a freshly prepared aqueous solution of Gln solution was added. In the final solution, the concentration of each amino acid was 0.556 mM except cystine, which was 0.278 mM. This stock was then serially diluted to concentrations of 0.278 mM, 0.111 mM, 0.056 mM, 0.028 mM, 0.011 mM, 0.0056 mM and 0.0011 mM.
2.2.2 Preparation of unlabeled PC-9 cell polar extract
Human lung adenocarcinoma PC-9 cells were grown on 10 cm cell culture plates in Dulbecco’s Modified Eagle’s Medium (DMEM) containing 10% fetal bovine serum (FBS) (Life Technologies, Carlsbad, CA), 50 U mL−1 penicillin (Thermo Fisher Scientific), 50 μg mL−1 streptomycin (Fisher Scientific, Waltham, MA), 0.2% unlabeled glucose (MP Biomedicals, LLC) for two days. Then the media was changed to DMEM media containing 10% dialyzed FBS (Life Technologies, Carlsbad, CA), 50 U mL−1 penicillin, 50 μg mL−1 streptomycin, 2 mM Gln (Sigma Aldrich), 0.45% glucose, 0.4 mM unlabeled Ser (Sigma Aldrich) and 0.4 mM unlabeled Gly (Sigma Aldrich). After 24 h, the cells were quenched, harvested and extracted with CH3CN:H2O:CHCl3 (2:1.5:1) [37]. Then the aqueous phase containing polar extracts was distributed into aliquots and lyophilized for ECF derivatization.
2.2.3 Preparation of plasma polar extract from NOD/SCID/Gamma (NSG) mice fed with 13C6- Glc enriched liquid diet
The NOD/SCID/Gamma (NSG) mice were fed with a custom liquid diet in which 13C6-glucose is the primary carbohydrate source for 18 h as described previously [38]. The mice were then sacrificed and 20 μl of plasma was extracted twice with 600 μL acetonitrile:methyl tert-butyl ether (MTBE):H2O (2:3:1) mixture to eliminate lipids [39]. Then the polar phase was deproteinized with 800 μL acetonitrile:acetone:methanol (8:1:1), followed by taking a 1/10 aliquot to lyophilize for ECF derivatization.
2.2.4 Preparation of lung cancer patient tissue polar extract
Both cancer tissues and surrounding non-cancer tissues of patients were collected in the operating room within 5 minutes of resection from patient UK018 under our University of Kentucky Internal Review Board (IRB) protocol (IRB 14-0288-F6A). The tissues were cut into thin slices at approximately 0.7 to 1 mm thickness each. Paired cancer and non-cancer tissue slices were collected and incubated in glucose, Gly and Ser-free DMEM medium (Life Technologies, Carlsbad, CA) with 10% dialyzed fetal bovine serum, 50 U mL−1 penicillin, 50 μg mL−1 streptomycin, 2 mM Gln, 0.4 mM Ser, 0.4 mM Gly and 0.45% 13C6-Glc (Sigma, St. Louis, MO). The slices were cultured at 37 °C with 5% CO2 for 24 h with gentle rocking as described [40]. The slices were quickly rinsed in cold PBS 3 times to remove any remaining media, vacuum aspirated, and then flash frozen in liquid N2. The frozen tissue slices were then homogenized in 60% cold CH3CN in a ball mill (Precellys-24, Bertin Technologies, Washington, DC, MD), then extracted with CH3CN:H2O:CHCl3 (2:1.5:1) [37]. Again the aqueous phase containing polar extracts was distributed into aliquots and lyophilized for ECF derivatization.
2.2.5 Hydrolysis of proteins from human lung tissues
After polar and lipid extraction of the ground tissue sample, the protein pellet was dried in a vacuum centrifuge and then extracted with 62.5 mM tris(hydroxymethyl)aminomethane (Tris) (Fisher Scientific) with 2% sodium dodecyl sulfate (SDS) (Fisher Scientific), 1 mM dithiothreitol (DTT) (Fisher Scientific), pH 6.8 [37]. The protein solution was precipitated with 10% trichloroacetic acid (TCA) (Fisher Scientific) and washed twice with H2O. Then the protein pellet was hydrolyzed in 6 N HCl with a focused beam microwave (CEM, Discover-SP, Matthews, NC, USA) at 160 °C for 10 min at a maximum power of 150 W, guided by previous work [41] and optimized by Y. Yang [42]. The hydrolyzed samples were then distributed into aliquots and lyophilized for ECF derivatization.
2.2.6 Preparation of double tracer labeled PC-9 cell polar extract
Human lung adenocarcinoma PC-9 cells were grown on 10 cm cell culture plates in DMEM containing 10% FBS, 50 U mL−1 penicillin, 50 μg mL-1 streptomycin, 0.2% unlabeled glucose for two days first. Then the media was changed to DMEM media containing 10% dialyzed fetal bovine serum, 50 U mL−1 penicillin, 50 μg mL−1 streptomycin and 2 mM Gln, and also with 0.45% 13C6-Glc/0.4 mM unlabeled Ser/0.4 mM unlabeled Gly, or 0.45% 13C6-Glc/0.4 mM 2H3-Ser (Cambridge Iosotope Laboratories, Tewksbury, MA)/0.4 mM unlabeled Gly, or 0.45% 13C6-Glc/0.4 mM unlabeled Ser/0.4 mM 2H2-Gly (Cambridge Iosotope Laboratories, Tewksbury, MA) respectively for different isotope tracer groups. After 24 h, the cells were quenched, harvested and extracted with CH3CN:H2O:CHCl3 (2:1.5:1) [37]. Then the aqueous phase containing polar extracts was distributed into aliquots and lyophilized for ECF derivatization.
2.2.7 ECF derivatization
For the amino acid standards, 9 μL of each amino acid standard sample was used at the concentration stated in section 2.2.1. For the cell/tissue/plasma polar extract, the freeze-dried fraction was used directly. H2O/Ethanol/Pyridine (6:3:1) mixture (100 μL) was added, followed by 5 μL of ECF. The mixture was allowed to react by vortexing for 30 s. Chloroform (100 μL) was then added to extract the products followed by 10 μL of 7 M NaOH to adjust the aqueous layer to pH 9–10, after which a further 5 μL of ECF was added and allowed to react again for 30 s. The solution was extracted a second time with 100 μL chloroform, and combined with the first extract. The combined chloroform extract was diluted 100 fold for the amino acid standards and 10 fold for cell or tissue samples with acetonitrile/water (9:1) solution to a final concentration of 20 μM NaCl to convert the ions to their sodium adducts. The samples were then directly injected into the FTMS using nano-ESI for UHR-FTMS analysis.
2.2.8 Mass spectrometry and peak assignments
UHR-FTMS analysis was carried out using the Tribrid Fusion Orbitrap (Thermo Scientific, San Jose, CA, USA), interfaced with an Advion Triversa Nanomate (Advion Biosciences, Ithaca, NY, USA). The Nanomate was operated at 1.5 kV and 0.5 psi head pressure in positive ion mode. The maximum ion time for the automatic gain control (AGC) was set to 100 ms, acquiring 5 micro scans, and each sample was acquired for >5 min with m/z range 100–1000 selected using quadrupole isolation. For data analysis, a single spectrum was obtained for each sample by averaging spectra over the entire acquisition time.
All 12C, 13C, 15N and 2H isotopologue peaks were assigned using “PREMISE” (PRecalculated Exact Mass Isotopologue Search Engine) [13] based on their accurate m/z values and the natural abundance distribution of each isotopologue was corrected (or “stripped”) using the method developed by Moseley [43].
3. Results and discussion
3.1 Analysis of amino acid standards
The ECF derivatization method was first evaluated using the amino acid mixture (Figure A.1 and Table 1). NMR analysis established that the ECF reaction efficiency was between 82–99.9% for the amino acid standards (Table A.1), based on 15N labeled amino acids added as internal standards for quantification. Since these 15N standards were added before reaction with ECF, the ratio between each amino acid and its spiked 15N counterpart was used to correct for the reaction and extraction efficiency, thus enabling quantification of each amino acid and its 13C labeled isotopologues despite lacking the actual reaction efficiency. Note that the use of UHR-FTMS enables the deployment of such isotopic surrogates as internal standards for biologically stable isotope labeled analytes. The ECF-derivatized amino acids were observed as sodium adducts except Arg, which was measured as the protonated form that dominated over the sodium adduct. For His and Lys, both protonated and Na adducts were present, but the Na adducts dominated at low concentrations.
Table 1.
Linearity of response of the ECF-derivatized amino acids standard
| Amino acids | N | Linear range (nM) |
R2 |
|---|---|---|---|
| Ala | 4 | 5-5000 | 0.995 |
| Arg | 4 | 5-5000 | 0.999 |
| Asn | 4 | 5-5000 | 0.997 |
| Asp | 4 | 5-5000 | 0.998 |
| Cystine | 4 | 5-1250 | 0.988 |
| Glu | 4 | 5-5000 | 0.990 |
| Gln | 4 | 5-5000 | 0.997 |
| Gly | 4 | 5-5000 | 0.994 |
| His | 4 | 5-5000 | 0.999 |
| Leu+Ile | 4 | 5-5000 | 0.999 |
| Lys | 4 | 5-5000 | 0.999 |
| Met | 4 | 5-5000 | 0.999 |
| Phe | 4 | 5-5000 | 1.000 |
| Pro | 4 | 5-5000 | 0.999 |
| Ser | 4 | 5-5000 | 0.992 |
| Thr | 4 | 5-5000 | 0.987 |
| Trp | 4 | 5-5000 | 0.998 |
| Tyr | 4 | 5-5000 | 1.000 |
| Val | 4 | 5-5000 | 0.997 |
For all amino acids tested, the UHR-FTMS quantification showed excellent linear response over more than three orders of magnitude with high sensitivity (Figure A.1 and Table 1), indicating that reliable absolute quantification of amino acids was achieved by this method. Leu and Ile are shown as a single entry as they are isobaric, and therefore are not resolved by direct infusion MS.
3.2 Analysis of amino acids in unlabeled polar extracts of PC9 cells
Direct analysis of cell extracts without derivatization by direct infusion nano-ESI UHR-FTMS was unsuccessful, even after 100-fold dilution to reduce the ion suppression. However, after ECF derivatization and chloroform extraction, the nano-ESI spray was stable for more than fifteen minutes, which readily enabled sensitive detection and reliable quantification of amino acids and their isotopologues. Figure 1 shows a typical positive-ion mode spectrum of a polar extract of PC9 cells after ECF derivatization and chloroform extraction. Small amino acids such as Gly and Ala were now detected with good sensitivity (at low femtomole levels), even though their underivatized forms were difficult to analyze by direct infusion-FTMS due to their low m/z values.
Figure 1. Typical positive ion mode spectrum of an unlabeled polar extract of PC9 cells after derivatization with ECF.
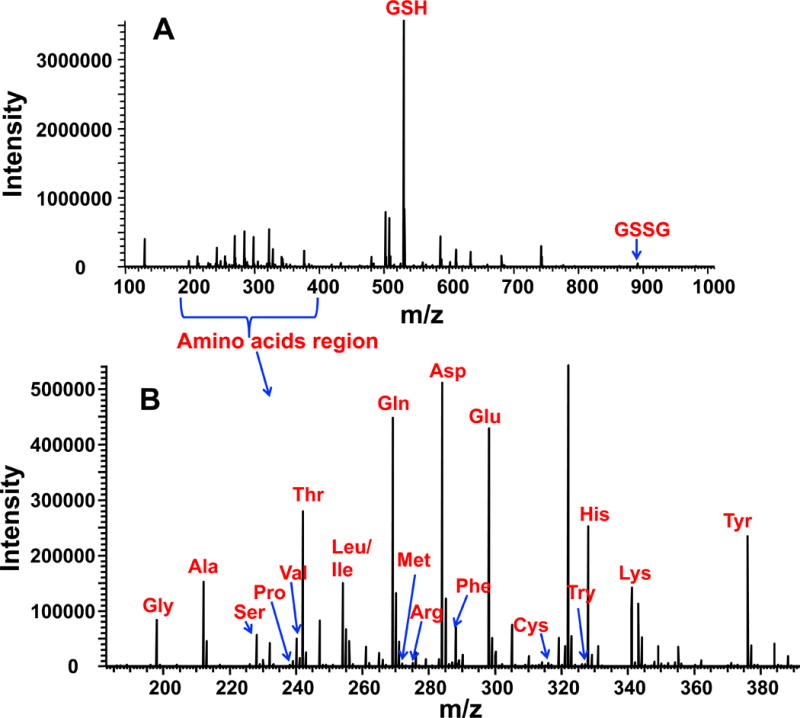
Panel A shows the full m/z range profile spectrum, which included the Na adducts of GSH and GSSG derivatives along with amino acid derivatives. Panel B shows the zoom-in profile spectrum in the amino acid range. The m/z peaks were assigned using “PREMISE” [13]. Most of the amino acids shown represented Na adduct species except for Arg and His, which were protonated species.
3.3 Analysis of amino acids in plasma from NOD/SCID/Gamma (NSG) mice fed with 13C6-Glc enriched liquid diet
Figure 2 summarizes the 13C enrichment of amino acids in mouse plasma after 18 h of feeding with 13C6-glucose diet. We found that about a third of the Ala was 13C3 labeled, and about half of Glu was 13C labeled (sum of all 13C isotopologues), indicating that about one third of Ala and one half of Glu in plasma was synthesized de novo from dietary glucose. The rationale is as follows: 13C3-Ala is synthesized from 13C6-Glc via the production of 13C3-pyruvate through glycolysis followed by transamination. 13C3-pyruvate can also enter the Krebs Cycle to produce 13C2-α-ketoglutarate, which can in turn generate 13C2-Glu via the action either of glutamate dehydrogenase or glutamate-α-ketoglutarate aminotransferase. The 13C2-Glu may subsequently be converted to 13C2-Gln by glutamine synthetase. Additional cycling through the Krebs cycle can produce 13C3-, 13C4 -, 13C1 - and 13C5-α-ketoglutarate and thus generate 13C3-, 13C4 13C1 - and 13C5-Gln via correspondingly labeled Glu. Glu, however, was present at low concentrations and showed very little 13C enrichment (Figure 2), which suggests the majority of Glu originated from the diet rather than by de novo synthesis from glucose, and further, the majority of newly synthesized Glu was consumed for Gln synthesis. The total concentrations of amino acids measured (the sum of all isotopologues) in mice plasma was comparable to values reported in the literature [44].
Figure 2. 13C labeled amino acids in blood plasma of mice fed with a 13C6-glucose diet.
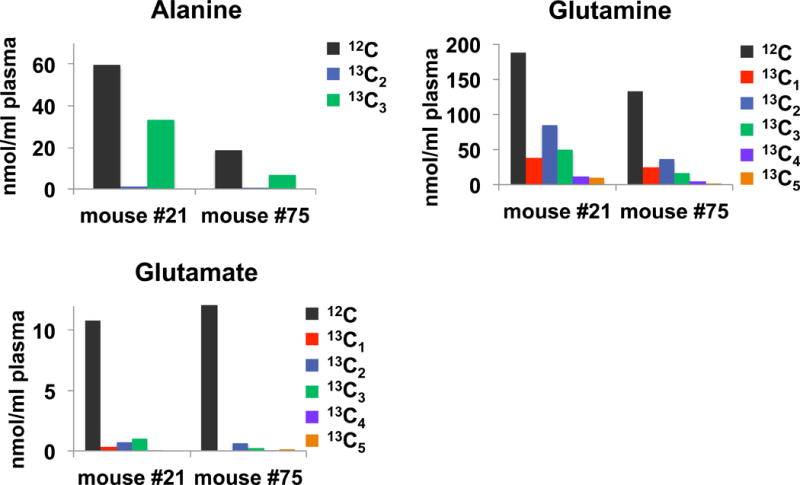
Blood plasma from mice fed with the 13C6-glucose diet was obtained and treated as described in the methods. Isotopologues of the amino acids were determined via the ECF derivatives by UHR-FTMS. High 13C enrichment was observed in Ala (ca. 33%) and Gln (ca. 50%) but not in Glu (<10–15%).
3.4. Analysis of free amino acids in 13C6-Glc labeled tissue slices from a lung cancer patient
We obtained freshly resected cancerous (CA) and paired non-cancerous (NC) lung tissues from human subjects, which were thinly sliced and incubated in 13C6-Glc containing DMEM media, as previously described [25, 40]. Figure 3 shows the isotopologues of selected amino acids determined in these tissue slices. The left three figures show the absolute quantification of amino acids in NC versus CA tissue extracts normalized to protein weight (nmole/mg protein) while the right three figures show the corresponding fractional enrichment. We found that after 24 h of incubation with 13C6-Glc, about 14% Ala was synthesized de novo in NC tissues and 62% in CA tissues, which suggested higher glycolytic and aminotransferase capacity in CA tissues. This is consistent with the metabolic reprogramming shown previously [12]. In addition, 13C2-Asp and 13C3-Asp were synthesized, evidently via the pyruvate dehydrogenase (PDH) and pyruvate decarboxylase (PCB) reactions, respectively (Figure 4). The fractional enrichment data suggested that compared with paired NC tissue slices, CA tissue slices had a relatively higher capacity for PCB- than PDH-initiated Krebs cycle reactions, which was consistent with previous report [11]. Moreover, since 13C3- and 13C4-Glu can be produced from additional Krebs Cycle turns and 13C4-Glu can be synthesized from the PCB activity (Figure 4), the relatively higher enrichment of these isotopologues in the CA versus NC tissue slices pointed to more active Krebs cycle in the CA tissues. This is consistent with a higher energy and carbon demand of cancer cells to support their survival and growth.
Figure 3. 13C labeling in human lung tissues.
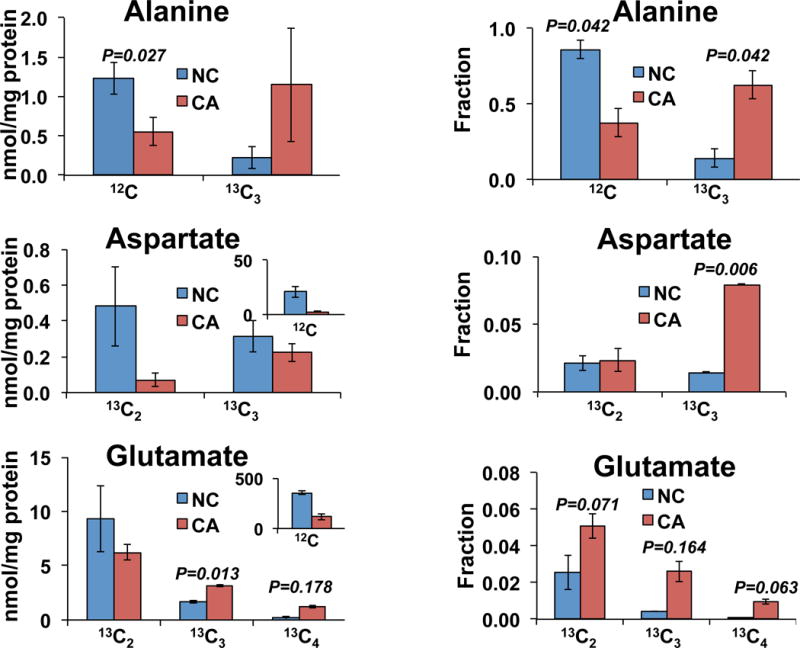
The polar extract of lung tissues slices incubated for 24 h in the presence of 13C6-glucose were processed as described in the methods. The amounts of different isotopologues of three amino acids were normalized to the tissue protein weight (left) and the fractional enrichments were calculated (right). Non-cancerous (NC, blue) and cancerous (CA, red) tissue slices procured from a lung cancer patient (UK018). N=2; error bars represent standard error of mean (SEM).
Figure 4. 13C atom-resolved tracing of 13C6-Glc oxidation through the interconnecting cytoplasmic glycolysis and mitochondrial Krebs cycle.
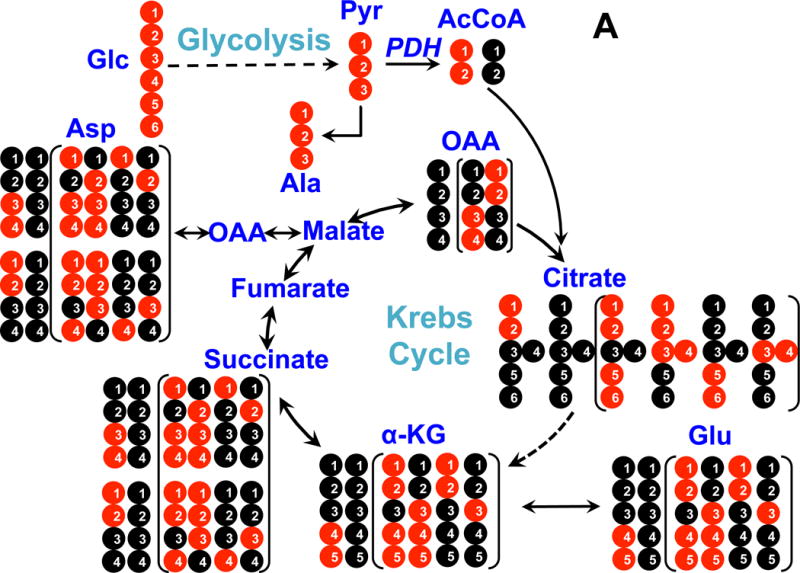
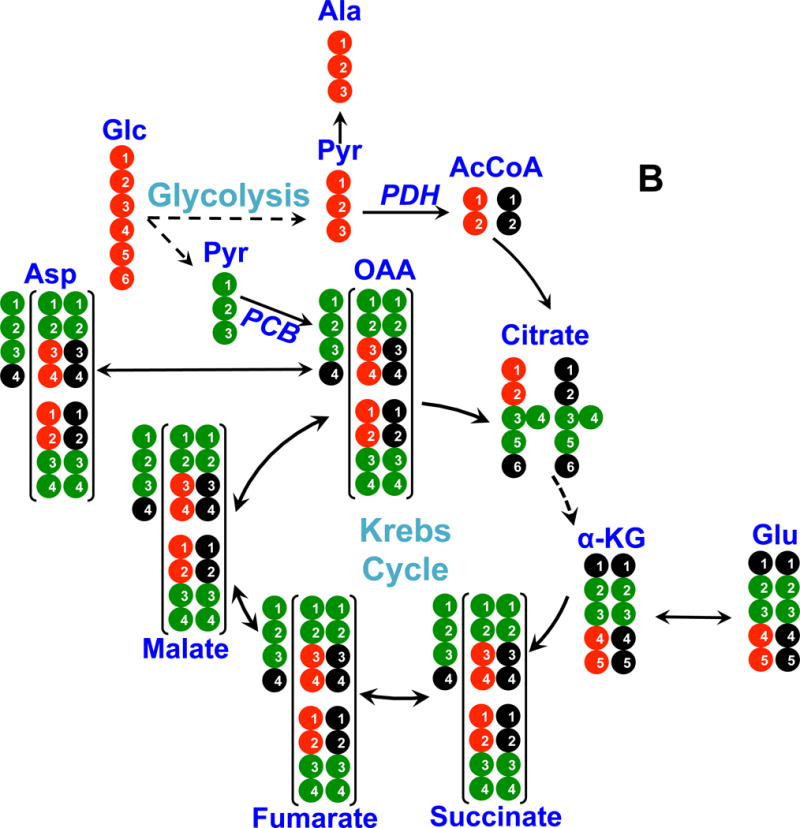
Panel A shows 13C incorporation from 13C6-Glc into various metabolites via the PDH (pyruvate dehydrogenase) pathway; panel B shows 13C incorporation from 13C6-Glc into metabolites via the PCB (pyruvate carboxylase) pathway. ●: 12C; ●: 13C; ●,● indicates 13C derived from PDH or PCB mediated Krebs cycle reactions, respectively; In panel A, the labeled patterns of the first and second (in brackets) turns of the PDH-initiated Krebs cycle are shown. In panel B, 13C3-pyruvate (Pyr) is carboxylated to form 13C3-oxaloacetate (OAA), leading to the formation of 13C3-Asp, -malate, -fumarate, and -succinate (patterns outside brackets); the labeled structures in brackets are derived from the reaction of 13C3-OAA with 13C2- or unlabeled acetyl CoA (AcCoA) to form other labeled Krebs cycle intermediates after one cycle turn. α-KG: α-ketoglutarate; not all expected labeled patterns of metabolites are shown [10].
3.5 Analysis of proteinaceous amino acids from lung cancer patient UK018
We also extracted protein fractions from the tissue slices of the same patient described above. To determine the incorporation of 13C labeled amino acids into proteins, we first hydrolyzed the protein extracts by microwave digestion using a modified method [41, 42] Independent of the hydrolysis efficiency, the fractional enrichment data of the isotopologues of each amino acid is reliable. Figure 5 shows the 13C fractional enrichment in amino acids hydrolyzed from the protein fraction of the lung cancer patient (UK018) tissue slice experiment. While the essential amino acids were unlabeled in the protein pool as expected, we observed appreciable 13C enrichment in non-essential amino acids, Glu, Ala, and Asp. The Glu and Asp data showed that the 13C enrichment was significantly increased in proteins from the CA tissue slices compared to the NC counterparts. It should be noted that Glu represented Glu+Gln as acid hydrolysis converts Gln to Glu. This result indicates that amino acids synthesized de novo from glucose were incorporated into proteins, and that the capacity of protein synthesis was higher in CA than in NC tissues. True protein turnover would require measurements of synthesis and degradation rates, which can be obtained with the present method but is beyond the scope of this report.
Figure 5. Fractional enrichment of isotopologues in different amino acids hydrolyzed from non-cancerous or cancerous tissue proteins.
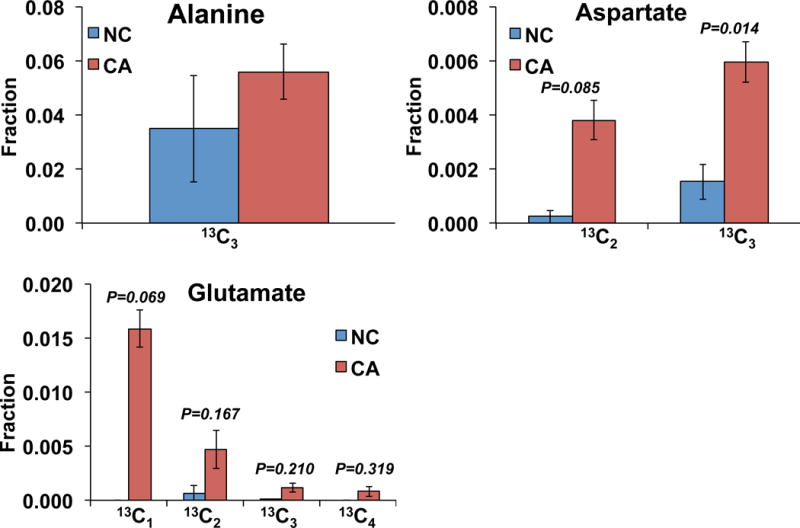
N=2; error bars represent SEM.
3.6. Analysis of amino acids in polar extracts of PC9 cells grown on dual labeled sources
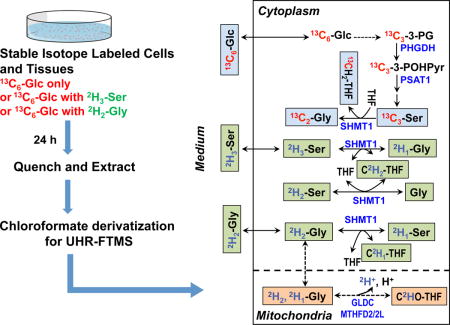
Stable isotope labeling is indispensible for robust mapping of metabolic pathways. Due to the complexity of metabolic networks, even the single tracer approach is often insufficient in terms of biochemical resolving power and coverage for gaining a comprehensive understanding of the system. The use of UHR-FTMS enables freedom to design experiments that multiplex different isotopes in the same experiment, including 13C, 15N and 2H (cf. Figure A2). We have grown PC9 cells in DMEM media for 24 h with 13C6-Glc + 2H2-Gly, or with 13C6-Glc + 2H3-Ser (see Methods) to distinguish the de novo synthesis of Ser and Gly (derived from 13C6-Glc) from metabolism of exogenous 2H labeled Ser or Gly present in the growth medium. Ser can be synthesized from glucose via the glycolytic intermediate 3-phosphoglycerate (3-PGA) and Ser can be subsequently converted to Gly by the action of serine hydroxymethyl transferase (SHMT), as shown in Figure 6. This Ser-Gly-one carbon pathway provides precursors for the synthesis of purines [3]. Thus the enrichment of Ser and Gly with 13C is expected to proceed via this pathway. Both Ser and Gly, however, can be taken up from the medium, which can be simultaneously tracked using 2H-labeled Ser or Gly in the medium. The SHMT-catalyzed exchange between Ser and Gly may lead to scrambling of the deuterium label, which is discerned by ECF derivatization UHR-FTMS analysis independently of the 13C enrichment in the amino acids pools. Recent report has shown that Ser is more likely than Gly to support one-carbon metabolism and proliferation of cancer cells [45]. It is therefore crucial to understand the pools and fates of Ser and Gly in regard of cancer metabolism.
Figure 6. De novo synthesis of Ser and Gly from glucose via glycolysis and the 3-phosphoglycerate (3-PG) pathway and exchanges of exogenously derived Ser and Gly via one-carbon metabolism.
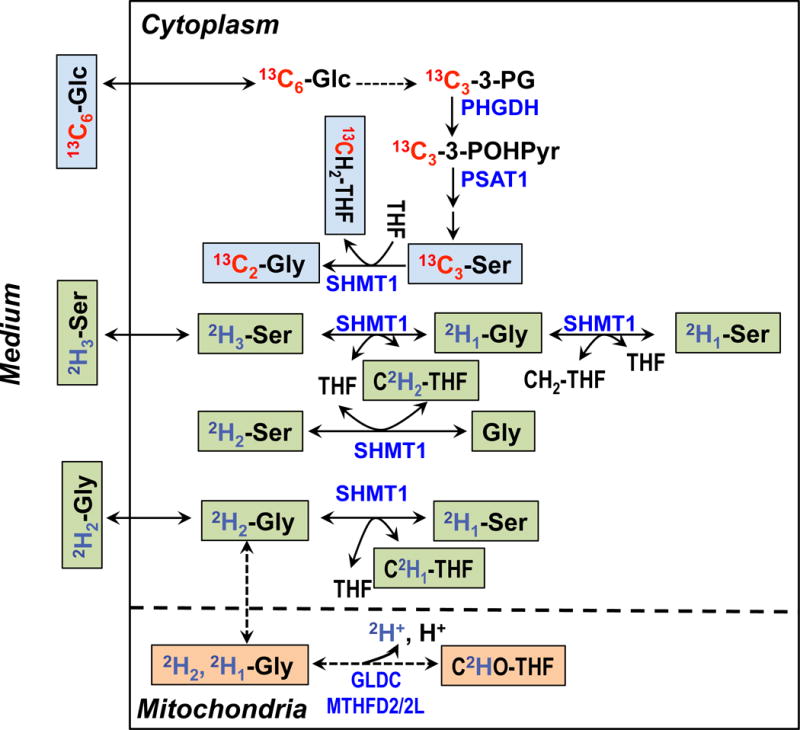
Selected Ser and Gly exchange reactions are depicted for the cytoplasmic and mitochondrial compartments to illustrate the production of different 2H isotopologues of Gly and Ser in Figs. 7 and 8. For example, the serine hydroxymethyl transferase (SHMT) reaction was shown for the cytoplasm (SHMT1) but omitted for the mitochondria (SHMT2) [10, 46]. Blue text blocks depict the de novo synthesis carbon pathway from 13C6-glucose while green and beige text blocks respectively depict the hydrogen exchange pathway of Gly and Ser via 1-carbon metabolism catalyzed by SHMT1, glycine decarboxylase complex (GLDC), and methylenetetrahydrofolate dehydrogenase (MTHFD). PHGDH: phosphoglycerate dehydrogenase; PSAT1: phosphoserine amino transferase 1; MTHFD2: mitochondrial NAD+-dependent methylene tetrahydrofolate dehydrogenase/methylene tetrahydrofolate cyclohydrolase; MTHFD2L: mitochondrial NADP+-dependent methylene tetrahydrofolate dehydrogenase.
Figure 7 shows the Gly and Ser regions in the UHR-FTMS spectrum of a polar extract of dually labeled PC9 cells. The expanded region illustrates clear resolution of 13C2 - from 2H2-isotopologues of Gly, and 13C3- from 2H3-isotopologues of Ser, and Figure 8 shows the fractional enrichment results of these assigned isotopologue species. After 24 h of growth in labeled cell media, about 20 to 30% of Gly and Ser were labeled with 13C only, which indicates de novo synthesis of Gly and Ser from glucose via glycolysis and the 3-PG pathway (Figure 6). A further 20–30% were 2H labeled only, indicating that these amino acids were newly imported from the external medium. However, more than half of the exogenously derived 2H3-Ser was converted to 2H2- and 2H1-Ser, while the main deuterated isotopologue of Gly was 2H1-Gly when either 2H3-Ser or 2H2-Gly was present in the medium. As before, these scrambled products of Ser and Gly indicated extensive deuterium exchange processes between Ser and Gly via 1-carbon metabolism, as catalyzed by SHMT, glycine decarboxylase complex (GLDC), and methylenetetrahydrofolate dehydrogenase (MTHFD).
Figure 7. UHR-FTMS of an extract of PC9 cells.
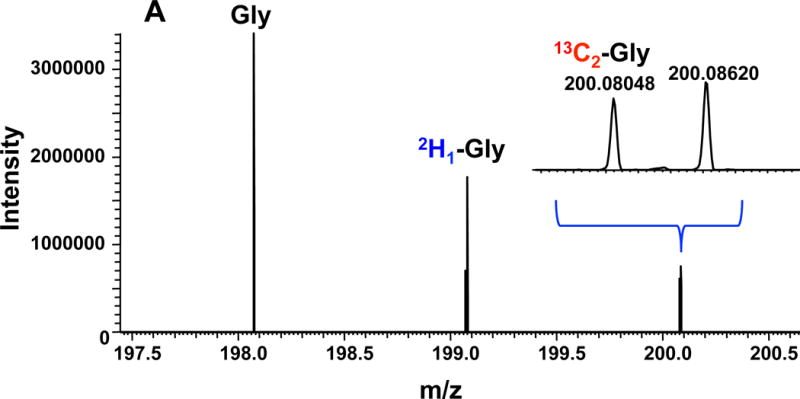
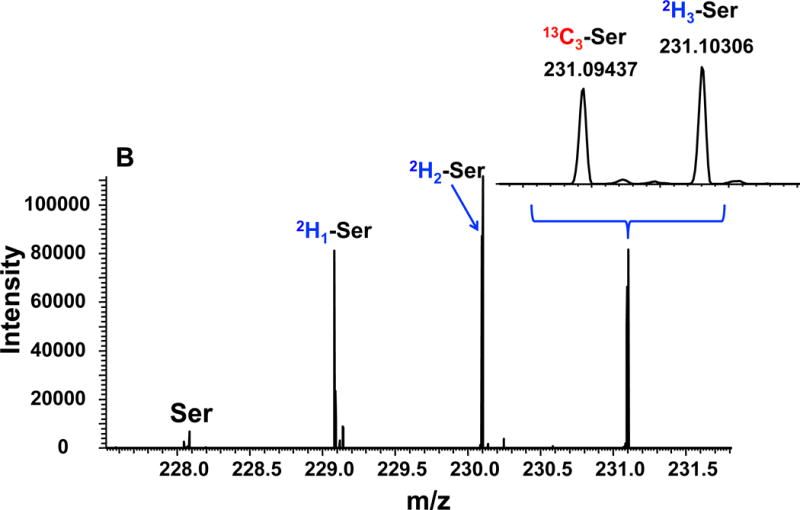
Panel A shows the UHR-FTMS profile spectrum of the Gly-ECF region of a polar extract of PC9 cells grown in a medium containing 13C6-Glc+2H2-Gly. Panel B shows the UHR-FTMS profile spectrum of the Ser-ECF region of a polar extract of 13C6-Glc+2H3-Ser labeled PC9 cells.
Figure 8.
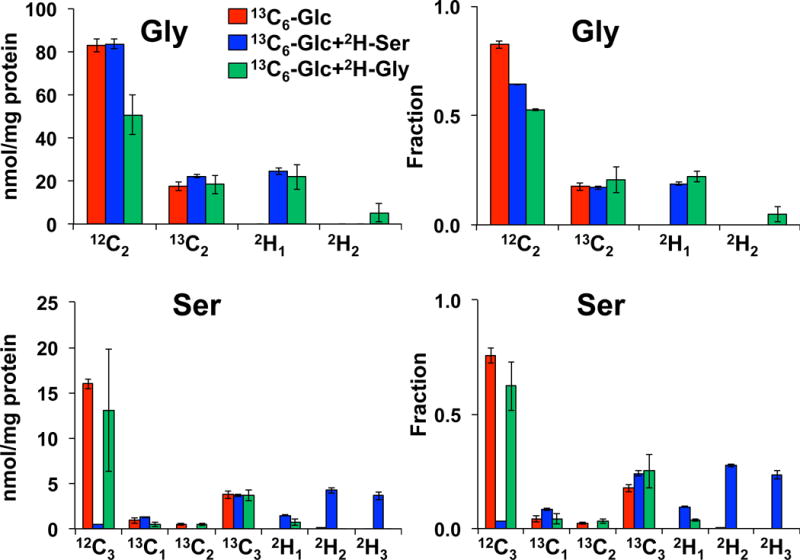
13C and 2H Isotopologue distribution of Ser and Gly in dually labeled PC9 cell extracts indicates extensive exchanges between the two amino acids. N=3; error bars represent SEM.
4. Conclusions
We have harnessed and modified the rapid ECF derivatization coupled with nano-ESI-UHR-FTMS method for microanalysis of amino acids. The resulting hydrophobic derivatives allowed use of chloroform extraction to minimize salt in polar extracts of biological samples, which avoided major matrix interferences. Together with the use of internal 15N labeled amino acid standards, we achieved highly sensitive, rapid, and reliable quantification of amino acids without the need for chromatography. Isobaric compounds such as Leu and Ile are not resolved with this new method, which would require chromatographic separation. We have applied this method to analyze amino acids in a wide range of biological matrices including cells, tissues, biofluids, and their protein hydrolysates. This, in turn, demonstrated the ability of mass spectrometry at sub-atomic (neutron) resolution to resolve dual tracers (13C and 2H) simultaneously present in amino acids, thereby opening new avenues for studies of metabolic networks at the atom-resolved level.
Supplementary Material
Highlights.
Chloroformate-based UHR-FTMS method shows excellent linear response to amino acids.
UHR-FTMS resolves simultaneous 13C and 2H isotopologues of amino acids in mSIRM.
Method was used to characterize metabolic change in lung cancer cells and tissues.
Characterized metabolic changes in cancer are consistent with previous reports.
Acknowledgments
This work was supported in part by National Institute of Health [5R01ES022191-04, 3R01ES022191-04S1, 1U24DK097215-01A1 and P01 CA163223-01A1]. We thank Dr. Ronald Bruntz for the PC9 cell extraction, Ms. Yan Zhang for the UK022 tissue slice extraction, Dr. Ramon Sun for mouse sample preparation, and Dr. Penghui Lin for recording NMR spectra on the samples and for data reduction. We also thank Dr. Hunter Moseley for discussion of the natural abundance stripping.
Abbreviations
- DMEM
Dulbecco’s modified Eagle’s medium
- ECF
ethyl chloroformate
- EI
electron ionization
- PPP
pentose phosphate pathway
- GC
gas chromatography
- LC
liquid chromatography
- nano-ESI
nano-electrospray ion source
- SIRM
stable isotope resolved metabolomics
- UHR-FTMS
ultrahigh resolution Fourier transform mass spectrometry
- NMR
nuclear magnetic resonance
- MS
mass spectrometry
- HPLC
high performance liquid chromatography
- GCMS
gas chromatography mass spectrometry
- LCMS
liquid chromatography mass spectrometry
Footnotes
Publisher's Disclaimer: This is a PDF file of an unedited manuscript that has been accepted for publication. As a service to our customers we are providing this early version of the manuscript. The manuscript will undergo copyediting, typesetting, and review of the resulting proof before it is published in its final citable form. Please note that during the production process errors may be discovered which could affect the content, and all legal disclaimers that apply to the journal pertain.
References
- 1.Lehninger AL, Nelson DL, Cox MM. Lehninger principles of biochemistry. New York: Worth Publishers; 2000. [Google Scholar]
- 2.Hosios AM, Hecht VC, Danai LV, Johnson MO, Rathmell JC, Steinhauser ML, Manalis SR, Vander Heiden MG. Amino Acids Rather than Glucose Account for the Majority of Cell Mass in Proliferating Mammalian Cells. Dev Cell. 2016;36(5):540–9. doi: 10.1016/j.devcel.2016.02.012. [DOI] [PMC free article] [PubMed] [Google Scholar]
- 3.Lane AN, Fan TWM. Regulation of mammalian nucleotide metabolism and biosynthesis. Nucleic Acids Res. 2015;43:2466–2485. doi: 10.1093/nar/gkv047. [DOI] [PMC free article] [PubMed] [Google Scholar]
- 4.Vogler AP, Trentmann S, Lengeler JW. Alternative route for biosynthesis of amino sugars in Escherichia coli K-12 mutants by means of a catabolic isomerase. J Bacteriol. 1989;171(12):6586–92. doi: 10.1128/jb.171.12.6586-6592.1989. [DOI] [PMC free article] [PubMed] [Google Scholar]
- 5.Ha HC, Sirisoma NS, Kuppusamy P, Zweier JL, Woster PM, Casero RA., Jr The natural polyamine spermine functions directly as a free radical scavenger. Proc Natl Acad Sci U S A. 1998;95(19):11140–5. doi: 10.1073/pnas.95.19.11140. [DOI] [PMC free article] [PubMed] [Google Scholar]
- 6.Sagor GH, Berberich T, Takahashi Y, Niitsu M, Kusano T. The polyamine spermine protects Arabidopsis from heat stress-induced damage by increasing expression of heat shock-related genes. Transgenic Res. 2013;22(3):595–605. doi: 10.1007/s11248-012-9666-3. [DOI] [PubMed] [Google Scholar]
- 7.Lappin G. A historical perspective on radioisotopic tracers in metabolism and biochemistry. Bioanalysis. 2015;7(5):531–40. doi: 10.4155/bio.14.286. [DOI] [PubMed] [Google Scholar]
- 8.Nelson DR, Zeikus JG. Rapid method for the radioisotopic analysis of gaseous end products of anaerobic metabolism. Appl Microbiol. 1974;28(2):258–61. doi: 10.1128/am.28.2.258-261.1974. [DOI] [PMC free article] [PubMed] [Google Scholar]
- 9.Sinzinger H, Rogatti W. Prostaglandins and arterial wall lipid metabolism–in vitro, ex-vivo and in-vivo radioisotopic studies. J Physiol Pharmacol. 1994;45(1):27–40. [PubMed] [Google Scholar]
- 10.Fan TW, Lorkiewicz PK, Sellers K, Moseley HN, Higashi RM, Lane AN. Stable isotope-resolved metabolomics and applications for drug development. Pharmacol Ther. 2012;133(3):366–91. doi: 10.1016/j.pharmthera.2011.12.007. [DOI] [PMC free article] [PubMed] [Google Scholar]
- 11.Sellers K, Fox MP, Bousamra M, 2nd, Slone SP, Higashi RM, Miller DM, Wang Y, Yan J, Yuneva MO, Deshpande R, Lane AN, Fan TW. Pyruvate carboxylase is critical for non-small-cell lung cancer proliferation. J Clin Invest. 2015;125(2):687–98. doi: 10.1172/JCI72873. [DOI] [PMC free article] [PubMed] [Google Scholar]
- 12.Fan TW, Lane AN, Higashi RM, Farag MA, Gao H, Bousamra M, Miller DM. Altered regulation of metabolic pathways in human lung cancer discerned by (13)C stable isotope-resolved metabolomics (SIRM) Mol Cancer. 2009;8:41. doi: 10.1186/1476-4598-8-41. [DOI] [PMC free article] [PubMed] [Google Scholar]
- 13.Lane AN, Fan TW, Xie Z, Moseley HN, Higashi RM. Isotopomer analysis of lipid biosynthesis by high resolution mass spectrometry and NMR. Anal Chim Acta. 2009;651(2):201–8. doi: 10.1016/j.aca.2009.08.032. [DOI] [PMC free article] [PubMed] [Google Scholar]
- 14.Ballevre O, Prugnaud J, Houlier ML, Arnal M. Assessment of threonine metabolism in vivo by gas chromatography/mass spectrometry and stable isotope infusion. Anal Biochem. 1991;193(2):212–9. doi: 10.1016/0003-2697(91)90011-h. [DOI] [PubMed] [Google Scholar]
- 15.Bluck LJ. Recent progress in stable isotope methods for assessing vitamin metabolism. Curr Opin Clin Nutr Metab Care. 2009;12(5):495–500. doi: 10.1097/MCO.0b013e32832eb5af. [DOI] [PubMed] [Google Scholar]
- 16.Vaitheesvaran B, Chueh FY, Xu J, Trujillo C, Saad MF, Lee WN, McGuinness OP, Kurland IJ. Advantages of dynamic “closed loop” stable isotope flux phenotyping over static “open loop” clamps in detecting silent genetic and dietary phenotypes. Metabolomics. 2010;6(2):180–190. doi: 10.1007/s11306-009-0190-2. [DOI] [PMC free article] [PubMed] [Google Scholar]
- 17.Lane AN, Fan TW, Bousamra M, 2nd, Higashi RM, Yan J, Miller DM. Stable isotope-resolved metabolomics (SIRM) in cancer research with clinical application to nonsmall cell lung cancer. OMICS. 2011;15(3):173–82. doi: 10.1089/omi.2010.0088. [DOI] [PMC free article] [PubMed] [Google Scholar]
- 18.Foguet C, Marin S, Selivanov VA, Fanchon E, Lee WN, Guinovart JJ, de Atauri P, Cascante M. HepatoDyn: A Dynamic Model of Hepatocyte Metabolism That Integrates 13C Isotopomer Data. PLoS Comput Biol. 2016;12(4):e1004899. doi: 10.1371/journal.pcbi.1004899. [DOI] [PMC free article] [PubMed] [Google Scholar]
- 19.de Mas IM, Selivanov VA, Marin S, Roca J, Oresic M, Agius L, Cascante M. Compartmentation of glycogen metabolism revealed from 13C isotopologue distributions. BMC Syst Biol. 2011;5:175. doi: 10.1186/1752-0509-5-175. [DOI] [PMC free article] [PubMed] [Google Scholar]
- 20.Moseley HN, Lane AN, Belshoff AC, Higashi RM, Fan TW. A novel deconvolution method for modeling UDP-N-acetyl-D-glucosamine biosynthetic pathways based on (13)C mass isotopologue profiles under non-steady-state conditions. BMC Biol. 2011;9:37. doi: 10.1186/1741-7007-9-37. [DOI] [PMC free article] [PubMed] [Google Scholar]
- 21.Greene GL, Kessler EG, Jr, Deslattes RD, Borner H. New determination of the deuteron binding energy and the neutron mass. Phys Rev Lett. 1986;56(8):819–822. doi: 10.1103/PhysRevLett.56.819. [DOI] [PubMed] [Google Scholar]
- 22.Higashi RM. The handbook of Metabolomics Methods in Pharmacology and Toxicology. Humana Press; 2012. Chapter 4: Structural Mass Spectrometry for Metabolomics. [Google Scholar]
- 23.Lorkiewicz PK, Higashi RM, Lane AN, Fan TW. High information throughput analysis of nucleotides and their isotopically enriched isotopologues by direct-infusion FTICR-MS. Metabolomics. 2012;8(5):930–939. doi: 10.1007/s11306-011-0388-y. [DOI] [PMC free article] [PubMed] [Google Scholar]
- 24.Higashi RM, Fan TW, Lorkiewicz PK, Moseley HN, Lane AN. Stable isotope-labeled tracers for metabolic pathway elucidation by GC-MS and FT-MS. Methods Mol Biol. 2014;1198:147–67. doi: 10.1007/978-1-4939-1258-2_11. [DOI] [PMC free article] [PubMed] [Google Scholar]
- 25.Fan TW, Warmoes MO, Sun Q, Song H, Turchan-Cholewo J, Martin JT, Mahan A, Higashi RM, Lane AN. Distinctly perturbed metabolic networks underlie differential tumor tissue damages induced by immune modulator beta-glucan in a two-case ex vivo non-small-cell lung cancer study. Cold Spring Harb Mol Case Stud. 2016;2(4):a000893. doi: 10.1101/mcs.a000893. [DOI] [PMC free article] [PubMed] [Google Scholar]
- 26.Fan TW, Higashi RM, Lane AN, Jardetzky O. Combined use of 1H-NMR and GC-MS for metabolite monitoring and in vivo 1H-NMR assignments. Biochim Biophys Acta. 1986;882(2):154–67. doi: 10.1016/0304-4165(86)90150-9. [DOI] [PubMed] [Google Scholar]
- 27.Schummer C, Delhomme O, Appenzeller BM, Wennig R, Millet M. Comparison of MTBSTFA and BSTFA in derivatization reactions of polar compounds prior to GC/MS analysis. Talanta. 2009;77(4):1473–82. doi: 10.1016/j.talanta.2008.09.043. [DOI] [PubMed] [Google Scholar]
- 28.MacKenzie SL, Tenaschuk D, Fortier G. Analysis of amino acids by gas-liquid chromatography as tert.-butyldimethylsilyl derivatives. Preparation of derivatives in a single reaction. J Chromatogr. 1987;387:241–53. doi: 10.1016/s0021-9673(01)94528-5. [DOI] [PubMed] [Google Scholar]
- 29.Husek P. Amino acid derivatization and analysis in five minutes. FEBS Lett. 1991;280(2):354–6. doi: 10.1016/0014-5793(91)80330-6. [DOI] [PubMed] [Google Scholar]
- 30.Mudiam MK, Ratnasekhar C, Jain R, Saxena PN, Chauhan A, Murthy RC. Rapid and simultaneous determination of twenty amino acids in complex biological and food samples by solid-phase microextraction and gas chromatography-mass spectrometry with the aid of experimental design after ethyl chloroformate derivatization. J Chromatogr B Analyt Technol Biomed Life Sci. 2012;907:56–64. doi: 10.1016/j.jchromb.2012.08.035. [DOI] [PubMed] [Google Scholar]
- 31.Qiu Y, Su M, Liu Y, Chen M, Gu J, Zhang J, Jia W. Application of ethyl chloroformate derivatization for gas chromatography-mass spectrometry based metabonomic profiling. Anal Chim Acta. 2007;583(2):277–83. doi: 10.1016/j.aca.2006.10.025. [DOI] [PubMed] [Google Scholar]
- 32.Fabiani A, Versari A, Parpinello GP, Castellari M, Galassi S. High-performance liquid chromatographic analysis of free amino acids in fruit juices using derivatization with 9-fluorenylmethyl-chloroformate. J Chromatogr Sci. 2002;40(1):14–8. doi: 10.1093/chromsci/40.1.14. [DOI] [PubMed] [Google Scholar]
- 33.Shangguan D, Zhao Y, Han H, Zhao R, Liu G. Derivatization and fluorescence detection of amino acids and peptides with 9-fluorenylmethyl chloroformate on the surface of a solid adsorbent. Anal Chem. 2001;73(9):2054–7. doi: 10.1021/ac001243c. [DOI] [PubMed] [Google Scholar]
- 34.Villas-Boas SG, Delicado DG, Akesson M, Nielsen J. Simultaneous analysis of amino and nonamino organic acids as methyl chloroformate derivatives using gas chromatography-mass spectrometry. Anal Biochem. 2003;322(1):134–8. doi: 10.1016/j.ab.2003.07.018. [DOI] [PubMed] [Google Scholar]
- 35.Deng C, Li N, Zhang X. Rapid determination of amino acids in neonatal blood samples based on derivatization with isobutyl chloroformate followed by solid-phase microextraction and gas chromatography/mass spectrometry. Rapid Commun Mass Spectrom. 2004;18(21):2558–64. doi: 10.1002/rcm.1660. [DOI] [PubMed] [Google Scholar]
- 36.Simpson JT, Torok DS, Markey SP. Pentafluorobenzyl chloroformate derivatization for enhancement of detection of amino acids or alcohols by electron capture negative ion chemical ionization mass spectrometry. J Am Soc Mass Spectrom. 1995;6(6):525–8. doi: 10.1016/1044-0305(95)00231-2. [DOI] [PubMed] [Google Scholar]
- 37.Fan TW-M. Chapter 2: Considerations of Sample Preparation for Metabolomics Investigation. In: Fan TW-M, Lane AN, Higashi RM, editors. The Handbook of Metabolomics. Springer Protocols; 2012. [Google Scholar]
- 38.Sun RC, Warmoes MO, Yang Y, Deng P, Sun Q, Lane AN, Higashi RM, Fan TWM. Noninvasive liquid diet delivery of stable isotopes into PDX mice for deep metabolic pathway tracing. Nature Communication. 2017 doi: 10.1038/s41467-017-01518-z. under review. [DOI] [PMC free article] [PubMed] [Google Scholar]
- 39.Matyash V, Liebisch G, Kurzchalia TV, Shevchenko A, Schwudke D. Lipid extraction by methyl-tert-butyl ether for high-throughput lipidomics. J Lipid Res. 2008;49(5):1137–46. doi: 10.1194/jlr.D700041-JLR200. [DOI] [PMC free article] [PubMed] [Google Scholar]
- 40.Fan TWM, Lane AN, Higashi RM. Stable Isotope Resolved Metabolomics Studies in ex vivo Tissue Slices. Bio-protocol. 2016;6:e1730. doi: 10.21769/bioprotoc.1730. [DOI] [PMC free article] [PubMed] [Google Scholar]
- 41.Engelhart WG. Microwave hydrolysis of peptides and proteins for amino acid analysis. Am Biotechnol Lab. 1990;8(15):30, 32, 34. [PubMed] [Google Scholar]
- 42.Yang Y. Department of Toxicology and Cancer Biology. Univerisity of Kentucky; 2017. Metabolic Reprogramming of Human Lung Cancer Cells and ex vivo Tissues Revealed by UHR-FTMS Analysis of Small Amino and Carboxyl Metabolites. [Google Scholar]
- 43.Moseley HN. Correcting for the effects of natural abundance in stable isotope resolved metabolomics experiments involving ultra-high resolution mass spectrometry. BMC Bioinformatics. 2010;11:139. doi: 10.1186/1471-2105-11-139. [DOI] [PMC free article] [PubMed] [Google Scholar]
- 44.Takeshita H, Horiuchi M, Izumo K, Kawaguchi H, Arimura E, Aoyama K, Takeuchi T. Long-term voluntary exercise, representing habitual exercise, lowers visceral fat and alters plasma amino acid levels in mice. Environ Health Prev Med. 2012;17(4):275–84. doi: 10.1007/s12199-011-0249-3. [DOI] [PMC free article] [PubMed] [Google Scholar]
- 45.Labuschagne CF, van den Broek NJ, Mackay GM, Vousden KH, Maddocks OD. Serine, but not glycine, supports one-carbon metabolism and proliferation of cancer cells. Cell Rep. 2014;7(4):1248–58. doi: 10.1016/j.celrep.2014.04.045. [DOI] [PubMed] [Google Scholar]
- 46.Lawrence SA, Hackett JC, Moran RG. Tetrahydrofolate recognition by the mitochondrial folate transporter. J Biol Chem. 2011;286(36):31480–9. doi: 10.1074/jbc.M111.272187. [DOI] [PMC free article] [PubMed] [Google Scholar]
Associated Data
This section collects any data citations, data availability statements, or supplementary materials included in this article.


