

ABSTRACT
Adipocytes were identified in human bone marrow more than a century ago, yet until recently little has been known about their origin, development, function or interactions with other cells in the bone marrow. Little functional significance has been attributed to these cells, a paradigm that still persists today. However, we now know that marrow adipose tissue increases with age and in response to a variety of physiologic induction signals. Bone marrow adipocytes have recently been shown to influence other cell populations within the marrow and can affect whole body metabolism by the secretion of a defined set of adipokines. Recent research shows that marrow adipocytes are distinct from white, brown and beige adipocytes, indicating that the bone marrow is a distinct adipose depot. This review will highlight recent data regarding these areas and the interactions of marrow adipose tissue (MAT) with cells within and outside of the bone marrow.
KEYWORDS: marrow adipose tissue, lineage tracing, marrow adipocyte differentiation, adipocyte progenitors, marrow fat
Introduction
Mammalian bone marrow (BM) is a complex, heterogeneous tissue, found for the most part in the medullary canal of the long bones (tibia, femur and humerus) as well as the vertebrae and iliac crest. The differentiation of many cellular lineages including hematopoietic and mesenchymal, starting from the most immature stem cells and culminating in mature functional cells occurs in the BM. This includes bones cells such as osteoblasts, the cells that form bone, osteocytes, the most mature population of osteoblast lineage cells found in bone matrix and mineralized bone. These cells are mesenchymal in origin. The bone marrow contains hematopoietic cells, composed in their majority by hematopoietic precursors of the myeloid, lymphoid and erythroid lineages, as well as differentiated cells such as osteoclasts, which resorb bone, red blood cells, B and T lymphocytes, macrophages, megakaryocytes and natural killer cells.
Although the presence of BM fat (adipocytes) was recognized grossly and histologically more than century ago, the BM adipocyte has been ignored, and until recently its function(s) were unknown.1 Unlike adipose tissue in other better-known depots, these cells have never been considered more than “filler” for other BM cells. Although this concept is passé, it persists today. However, it is now well-accepted that the number of BM adipocytes increase with age and as a result of a variety of induction signals. In many but not all cases these changes have been correlated with reduced bone mass.2 Additionally, BM adipocytes have been implicated as negative regulators of hematopoiesis.3 These studies suggest that BM adipocytes play an important role in regulating not only the local BM environment, but also may contribute to overall body homeostasis. However, very little is known about the origin (stem cell), lineage progression (differentiation), or function (regulatory activity) of marrow adipocytes. In this review, we will highlight recent data regarding these areas and explore the current state of marrow adipose tissue (MAT) research.
Adipose tissue development and expansion
There are 3 distinct adipocyte cell populations outside of BM. White adipocytes are primarily dispersed throughout the body in distinct subcutaneous white adipose tissue (SWAT) and visceral white adipose tissue (VWAT) depots. Within the peritoneum there are individual visceral depots including perigonadal, retroperitoneal and mesenteric. SWAT and VWAT serve as both major lipid reservoirs and important endocrine organs.4 However, VWAT does have functions distinct from those of SWAT.5,6 Brown adipocytes are much less abundant than white adipocytes, with distinct brown adipose tissue (BAT) depots located intra-scapullarly in mice and in the neck and supraclavicular region in humans.7 Unlike white adipocytes, which store and provide lipids as an energy source for other tissues, brown adipocytes actively metabolize fatty acids to generate heat.8 BAT is derived from a Myf5+/Pax7+ progenitor cell while WAT progenitors are Myf5−/Pax7−, indicating the lineages are distinct.9-11 Beige adipocytes constitute the third adipocyte cell population. The progenitors of beige adipocytes are interspersed within WAT depots, located in inguinal WAT in mice, are Myf5−/Pax7−, are inducible (e.g. cold exposure), multilocular, brown-like thermogenic adipocytes.11-13 In both mouse and human, WAT forms early in life. In humans, lipid filled SWAT first arise during the second trimester14 with developed SWAT depots being present at birth.14-16 In mouse, lipid filled SWAT adipocytes are observed concomitantly at birth and a distinguishable SWAT depot develops within 24 hours.17 Murine VWAT develops shortly after murine SWAT as lipid filled visceral white adipocytes become present on postnatal day 4.18 Less is known about human VWAT development. However, it is known that some human VWAT does not develop until after birth and there is little VWAT in non-obese humans at puberty.19-21 Therefore, in both species, SWAT forms at or before birth and VWAT forms shortly after birth.
Distinct BAT depots are present embryonically in both mouse and human, functioning to maintain thermo-neutrality.15,22 Murine BAT persists throughout adulthood and recent data indicates that BAT is both present in adult humans and increases in activity upon cold exposure.23,24 However, functional BAT mass is negatively correlated with age,23 suggesting that aging is characterized by increased WAT mass and decreased BAT mass in humans.
Early in life, the BM is “red” with hematopoietic and osteogenic cells. The development of BM adipocytes leads to “yellow” fatty marrow, which replaces the “red” marrow within long bones of humans and mice with age and appears late in life at other skeletal sites such as the spine.25,26 The yellow color of MAT is clearly different from white or brown adipose tissue in humans. This was one of the early clues that MAT might be different from WAT and BAT. In mice, the presence of MAT postnatally is strain-dependent and appears to be a heritable trait (Farber and Horowitz unpublished). As an example, C3H/HeJ mice have high numbers of marrow adipocytes extending from below the growth plate through the metaphysis and into the diaphysis by 16 weeks of age.27 This tissue is referred to as inducible or regulated marrow adipose tissue (rMAT). In contrast, the adipocytes that fill the medullary canal from the tibia-fibular junction into the malleolus are referred to by some as constitutive marrow adipose tissue (cMAT). This is because it appears early in postnatal development, is in high concentration in this site compared with rMAT and does not appear to be susceptible to agents that induce rMAT. In contrast to C3H mice, C57BL/6J mice have exceedingly low numbers rMAT until more than 21 weeks of age27,28 (For a more detail discussion of C3H MAT and bone mass please refer to the Autocrine, Paracrine and Endocrine Interactions section).
The known inducers of marrow adiposity include commonly used drugs such as glucocorticoids and thiazolidinedione, which also induce bone loss.29 Mice fed a diet containing rosiglitazone for at least 5 weeks develop a striking number of BM adipocytes, extending through the metaphysis into the diaphysis and exhibit bone loss.30,31 While high fat diet (HFD) is a potent inducer of subcutaneous and visceral adiposity, its ability to induce MAT and bone loss is variable. We have reported that adult male C57BL/6J mice on a HFD (60 kcal %) for 12 weeks leads to increased body weight, total body fat and MAT.32 In addition, mice on a single-source HFD for 12 weeks induces extensive visceral and subcutaneous WAT with no induction of MAT, as measured by osmium tetroxide staining, or bone loss (Horowitz, Kaplan and Rodeheffer unpublished). Using the same mice and diet, it has been reported that a significant increase in weight occurs after 12 weeks and an increase in MAT only after 16 weeks.33 These data are in agreement with our data, suggesting that MAT appears after 12 weeks on a HFD. In contrast to our data, bone loss was seen after 12 weeks of HFD feeding.33 This suggest that the mechanism of HFD induced MAT is different than that for bone loss. This is yet another parameter that distinguishes MAT from WAT. In contrast, irradiation can be a potent and rapid inducer of MAT depending on the dose. Altered states of metabolism such as starvation and calorie restriction or the syndrome of anorexia nervosa can cause increased MAT. Restriction of sulfur amino acids, particularly methionine, which may be the major effector of calorie restriction, is a potent inducer of beige adipogenesis, induces MAT and causes bone loss.34-37 While many pathways lead to increased marrow adiposity, accurate measurement of BM adipogenesis has been problematic until recent experimental advances.
Marrow adipose tissue – measurement and imaging
Although MAT can be found in the ribs, vertebrae and sternum the majority of MAT is located in the medullary canal of long bones (tibia, femur and humerus). Because of the physical location of MAT (inside bone) and the small volume of tissue, at least in mice, MAT is much more difficult to study. Standard histologic/histomorphometric methods are good for measuring adipocyte cell size and cell number in some cases. However, these are 2 dimensional measurements and therefore cannot quantitate MAT accurately. To overcome these limitations, we developed an ex vivo technique that allows for the quantitation and visualization of MAT in the medullary canal of mouse long bones and vertebrae using osmium tetroxide, which has been used for decades to stain lipid.38,39 Importantly, because osmium tetroxide is a heavy metal, it is opaque when imaged using computerized tomography (CT), which makes it ideal for staining lipid in bone. Briefly, mouse bones (tibia, femur, and/or humerus) are harvested, the soft tissue removed and the bones fixed in 10% neutral buffered formalin for 18–24 hours.40 The formalin is removed by washing the bones in tap water. The fixed bones are then decalcified in EDTA for 20 d at 4°C, changing the EDTA every 3–4 d. Gentle decalcification is critical to allow for complete penetration of the osmium tetroxide through the cortical bone and into the medullary canal. Our previous experience showed that 15 d of decalcification with EDTA may be sufficient, however, we cannot guarantee sufficient decalcification to allow full penetrance of the osmium in mouse bones from strains with high bone density. The EDTA is removed by washing in tap water and the bones are then stained with 1% osmium tetroxide for 48 hours. Because we are working in osmium excess, 48 hrs is sufficient to completely stain the marrow adipocytes. The osmium tetroxide is also removed by washing in tap water and the bones imaged by micro-CT. CT images of osmium stained bones shows the position of MAT in the bone and provides quantitation in 3 dimensions (adipocyte volume/total volume – AV/TV). This measurement is similar in scope to bone volume/total volume (BV/TV). The vast majority of the osmium appears as a solid black sphere inside the adipocyte membrane. It has been our experience that little staining is seen in the smaller hematopoietic cells when examined histologically (Horowitz, unpublished). One of the few limitations of this method is that when BM has few adipocytes the variability within experiments increases. We always do multiple experiments, with different animals to overcome this limitation. In addition, using image analysis and masking, MAT measurements in different experiments can be compared directly.41 We have been uniformly unsuccessful using this method for staining rat long bones, even when we have used harsh methods (i.e. formic acid) to decalcify the bones. Stain penetrates the cortical bone but does not enter the marrow space. We assume this is a result of the lack of osmotic pressure or passive flux.
Using osmium staining to visualize and measure BM adipogenesis we have been able to map MAT development in long bones. In the region below (distally) the tibia-fibula junction extending the rest of the length of the medullary canal ending in the malleolus, marrow fat can be seen as early as one-week post-birth in C57BL/6J and C3H/HeJ mice.27 This is referred to by some as constitutive marrow adipose tissue (cMAT) or constitutive marrow fat. cMAT is present in the distal tibia before the appearance of adipocytes in the proximal tibia and femur. In contrast, we found that C57BL/6J mice (from 4–21 weeks old) have very few naturally occurring BM adipocytes in the proximal tibia and femur. These adipocytes are difficult to quantitate by osmium staining and cannot be visualized histologically (Horowitz and Rosen, personal observation of hundreds of individually stained bones). However, extensive BM adipogenesis in these sites, which can be quantitated by osmium staining and confirmed by histology, can be induced using a variety of methods including feeding mice a rosiglitazone containing diet, a methionine restricted diet or x-irradiation (Fig. 1). This is sometimes referred to as inducible or regulated marrow adipose tissue (rMAT) or regulated marrow fat. It is important to note that in addition to the cMAT seen in the distal tibia, tail vertebrae of C57BL/6J mice also have high numbers of endogenous marrow adipocytes. However, whether these adipocytes arise from the same lineage as the cMAT in distal tibia is unknown.
Figure 1.
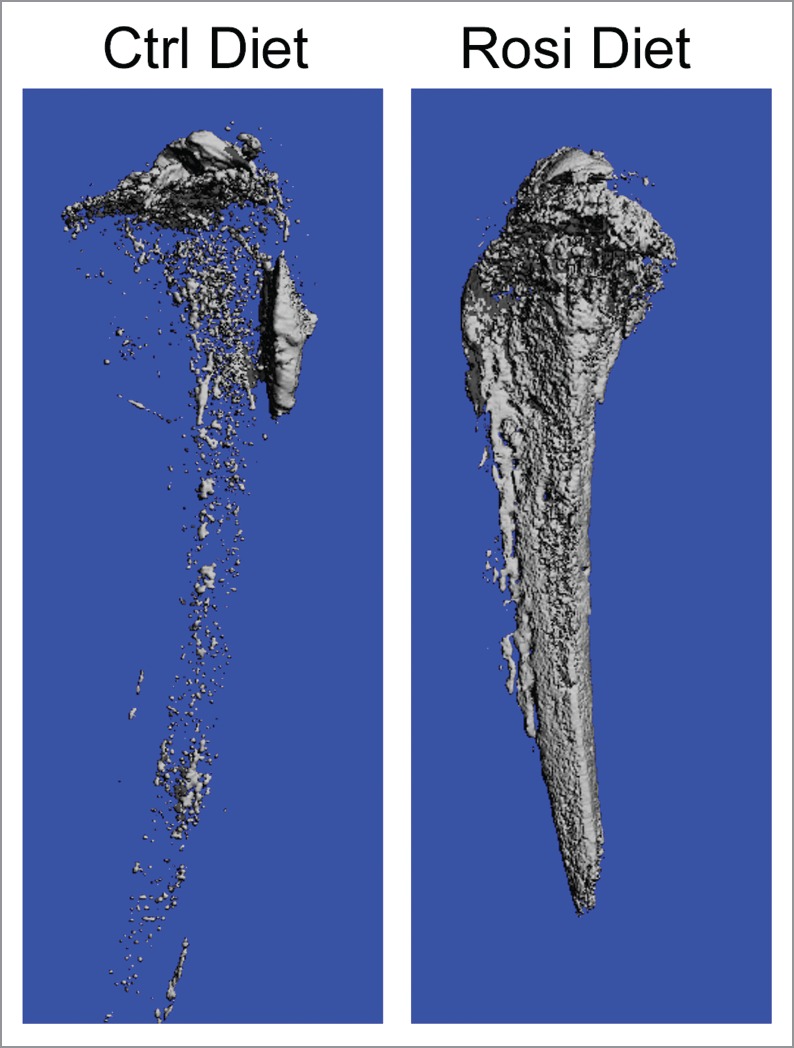
FVB mice were fed a rosiglitazone or control diet for 8 weeks. Tibias were fixed in 10% buffered formalin overnight, washed in tap water, decalcified for 20 d in EDTA and stained with osmium tetroxide. The bones were then washed and imaged by micro-CT. Micro-CT images show the tibia on control diet (Ctrl Diet) and on rosiglitazone (rosi Diet).
Induction of bone marrow adipogenesis can be quite striking with adipocytes filling the medullary canal from the region just below the growth plate (primary spongiosa) extending distally through the metaphysis and into the diaphysis. This induction often results in increased adipogenesis above the growth plate in the secondary center of ossification. cMAT is thought not to respond to the signals that induce rMAT. However, the sensitivity of cMAT to these signals and therefore the ability of cMAT to respond by increased adipogenesis in situ remains to be shown. It is possible that cMAT and rMAT represent different populations of MAT arising from different progenitors. However, further experiments are required to define the differences in the anatomically distinct populations of cells. While these studies have quantitatively assessed the process of marrow adipogenesis, little is still known about the cellular or molecular regulation of BM adipogenesis in vivo.
Marrow adipose tissue – origin and differentiation
It is generally accepted that marrow adipocytes arise in the BM from mesenchymal stem cells (MSC) and are more closely related to osteoblasts than other cells of mesenchymal origin (chondrocytes, myocytes and marrow stromal cells). Recent data supports this conclusion. Several recent studies have focused on identifying the BM osteoblast/adipocyte progenitor cell in vivo. Although the bone marrow of young C57BL/6J mice is largely devoid of BM adipocytes, a small number of perillipin+:osterix (Osx1) traced cells were observed in the BM of 8-week old mice.42 Osterix was thought to be expressed solely in osteoblasts, but this result has raised the possibility of a bi-potent progenitor capable of generating osteogenic and adipogenic cells within the BM. In a separate set of experiments, the majority of colony forming unit-fibroblasts (CFU-Fs) (94%) were found to be traced by expression of the leptin receptor (LepR).43 LepR also traced most adipocytes and osteoblasts in adult BM. Importantly, the LepR+ traced BM population largely overlaps with a Nestin-GFP+ BM population. Notably, others have reported that a Gremlin 1 expressing cell in the BM can self-renew and give rise to osteoblasts, chondrocytes and reticular marrow stromal cells but not adipocytes.44 Using flow cytometry 2 populations of bone marrow cells could be separated based on the expression of Sca1.45 CD45−; CD31−; PdgfRα+; Sca1+ cells, which were highly adipogenic but had limited osteochondrogenic potential as measured by in vitro differentiation. In contrast, CD45−; CD31−; PdgfRα+; Sca1− cells, did not differentiate into adipocytes in vitro but had a strong osteochondrogenic potential. The CD45−; CD31−; PdgfRα+; Sca1+ population could be further separated based on CD24 expression. CD45−; CD31−; PdgfRα+; Sca1+; CD24+ population was able to differentiate into osteoblasts, chondrocytes and adipocytes; while the CD45−; CD31−; PdgfRα+; Sca1+; CD24− population gave rise to only adipocytes.45 Based on these data, BM adipocytes must be derived from BM resident mesenchymal progenitor cells. However, whether this is a single population of progenitors or a small number of different progenitors remains controversial. In addition, it remains unclear whether BM adipocytes are lineage related to white, brown or beige adipocytes, or if they are a separate, fourth class of adipocyte. Consequently, the cellular identity of BM adipocyte progenitor/precursor cells requires additional definition. While adipocyte progenitors (AP) have been identified in WAT and skeletal muscle in mice,46-48 flow cytometry analysis of whole C57BL/6J BM failed to identify cells sharing the cell surface marker profile of WAT AP (Lin−; CD29+; CD34+; Sca1+; PdgfRα+; with or without CD24) (Fretz and Horowitz, unpublished), suggesting that BM adipocytes arise from a non-white AP cell. Our group and others have therefore performed lineage tracing of BM adipocytes coupled with flow cytometry to retrospectively identify BM AP cells.
Because young (4–21 weeks) C57BL/6J BM contains few mature adipocytes, we have used several methods to induce marrow adipogenesis for lineage tracing of BM adipocytes in vivo. These techniques include: 1) feeding with a rosiglitazone-containing diet; 2) feeding with a methionine restricted diet; 3) x-irradiation (700–1000 rads) with or without BM reconstitution.
We have performed lineage tracing in vivo using the fluorescent mT/mG reporter mouse in concert with various mouse models driving cre-recombinase from lineage specific promoters. In the mT/mG model, all cells express membrane-targeted dTomato (mT). The expression of cre-recombinase induces the permanent excision of the upstream cassette encoding a membrane-targeted dTomato (mT) reporter protein to allow expression of a downstream cassette encoding a membrane targeted eGFP (mG) reporter protein. In this manner, cells expressing cre-recombinase “flip” from being dTomato+ to being eGFP+. Each daughter cell from mG+ cells will also be mG+. Importantly, in this system, expression of eGFP reflects the expression of the gene of interest at any time the cell expressed that gene. Therefore, gene expression can be indicative of progenitor as well as more mature cell expression.49
We have developed new approaches to visualize BM adipocytes in vivo using confocal microscopy. To visualize traced cells ex-vivo, the femur is dissected out, the femoral head removed and a 20 gauge needle inserted through the medullary shaft until it protrudes out the distal end of the femur. A 5cc syringe is attached to the needle and the BM plug is gently blown onto a microscope slide. The BM plug is immersed in Fluoromount-G (eBioscience), coverslipped and the cells visualized (Fig. 2A). This approach has the added advantage of being able to visualize BM adipocytes by staining their intracellular lipid with LipidTox (fluorescent dye that stains neutral lipids; Lifetechnologies). A second approach involves fixing the isolate bones in 4% paraformaldehyde overnight, followed by washing in PBS, decalcifying the bones for 20 d in 4% EDTA and then processing the bones for frozen sections. Importantly, the fluorescent mT/mG is unaffected by this processing (Fig. 2B). The advantage of this approach is BM in vertebrae and other difficult to access sites can be examined and the location of the cells in the bone, BM, or on bone surfaces can be determined.
Figure 2.

Meox1-cre:mT/mG mice were fed a rosiglitazone diet for 8 weeks. (A) BM plugs were collected from the femurs using a 20 guage needle, placed on a microscope slide and covered with Fluoromount-G. (B) The most proximal tail vertebrae were fixed in paraformaldehyde overnight, washed, decalcified in EDTA for 20 d and then processed for frozen sections. Fluorescence was observed using confocal microscopy.
Following induction of BM adipogenesis, BM adipocytes within the BM plug were visualized through fluorescent confocal microscopy. Although it has been reported that WAT can arise from hematopoietic cells,50 more recent data using the mT/mG reporter mouse does not support this conclusion.49 Because the BM is the major site of hematopoiesis, we first determined if MAT could develop from hematopoietic progenitors. Lineage tracing shows that BM adipocytes are not derived from the hematopoietic lineage as BM adipocytes were uniformly dTomato+ in Vav1-cre:mT/mG mice, which traces hematopoietic stem cells and their progeny.51,52 In contrast, BM adipocytes were uniformly eGFP+ in adiponectin-cre:mT/mG mice. Because adiponectin is an insulin-sensitizing adipokine expressed by white adipocytes,53 these data suggest that BM adipocytes may play an active role in the regulation of systemic metabolism.54
Preformed brown adipocytes, are found for the most part, in a single discrete depot in the intrascapular region of mice. These cells arise from Myf5 expressing progenitors and are traced in Myf5-cre:mT/mG mice.11 We have found that BM adipocytes induced by rosiglitazone are not lineage related to brown adipocytes as they are uniformly dTomato+ in Myf5-cre:mT/mG mice. In addition, all BM adipocytes we observed, whether constitutively present or induced, were unilocular (single large lipid droplet within the cell membrane). In contrast, brown adipocytes are multilocular (multiple small lipid droplets within the cell membrane). These data indicate that MAT does not derive from a BAT lineage.
Beige adipocyte progenitors are found interspersed among white adipocytes, predominantly in the inguinal (IWAT) depot in mice. Beige adipocytes, like brown adipocytes are multilocular and can be induced by cold exposure.55 However, it has been reported that UCP-1 mRNA is present in mouse BM fat.56 We have previously shown that feeding mice a diet deficient in cysteine and restricted (0.12%) in methionine (MR) is a potent inducer of beige adipogenesis in IWAT (Ables and Horowitz unpublished).36 To determine whether MAT was able to develop beige adipocytes, C57BL/B6J mice were fed an MR or control (CF) diet for 6–8 weeks, the tibia and femur collected and examined histologically and UCP-1 expression determined by immunohistochemistry (IHC). As expected, IWAT from CF fed mice contained a small population of multilocular UCP-1+ beige adipocytes interspersed among a much larger population of unilocular UCP-1 negative white adipocytes. In contrast, the IWAT of MR mice had significantly more multilocular adipocytes with increased UCP-1 staining than CF. Consistent with our previous report, MR mice had a striking increase in unilocular BM adipocytes as compared with CF and were unvaryingly UCP-1 negative.37 These data indicate that feeding mice an MR diet induces BM adipogenesis and unlike brown or beige adipocytes, BM adipocytes are uniformly unilocular and do not express UCP-1.37
In mice as in humans, marrow ablation, either by irradiation or by chemotherapy induces a striking marrow adipogenic response.57,58 We have also used lethal irradiation followed by BM reconstitution to induce BM adipogenesis. C57BL/6J mice received 1000 rads of whole body x-irradiation in a single does and were then injected intravenously with 106 syngeneic BM cells. The BM reconstitution rescues the mice by providing hematopoietic stem cells. Mice lethally irradiated and reconstituted with syngeneic BM cells develop large numbers of adipocytes in the medullary canal of tibias and femurs as early as 3 d post irradiation peaking between 7 and 10 d post irradiation. The appearance of MAT precedes BM repopulation by hematopoietic cells. To identify the origin of the marrow adipocyte progenitor, C57BL/6J or mT/mG (on the C57BL/6J background) mice were irradiated and reconstituted with C57BL/6J or mT/mG BM. Reconstitution of irradiated C57BL/6J mice with mT/mG BM resulted in adipocytes that were not dTomato+. In contrast, reconstitution of irradiated mT/mG mice with C57BL/6J BM resulted in dTomato+ adipocytes, indicating that the BM adipocyte progenitor resides in the irradiated host, does not arise from the transplanted cells and is radio-resistant.
WAT adipocyte progenitors have recently been shown to express Pdgf-receptor α (PdgfRα) leading to tracing all white adipocytes in PdgfRα-cre:mT/mG mice.48 However, this is not the case with BM adipocytes. A subset (∼50%) of BM adipocytes, induced by rosiglitazone feeding was traced by PdgfRα-cre. Importantly, a similar subset (∼70%) of marrow adipocytes, induced by lethal irradiation, was also traced by PdgfRα-cre. These data indicate that regardless of the induction method, BM adipocyte progenitors and WAT adipocyte progenitors appear distinct.
Osterix1 (osx1) is a transcription factor required for osteoblast differentiation that is expressed immediately downstream of Runx2. Deletion of osx1 results in an early arrest in osteoblast differentiation.59 Osx1 expression was believed to be osteoblast specific. Previous lineage tracing studies have suggested a mesenchymal-osteogenic lineage for BM adipocytes.60-62 Therefore, we performed lineage tracing of BM adipocytes in 2 reporter strains known to label mesenchymal-osteogenic cells; Prx1-Cre:mT/mG and Osx1-Cre:mT/mG.60,62 Mice were fed a rosiglitazone-containing diet for 8 weeks to induce marrow adipogenesis. Tibial and femoral derived BM adipocytes were found to be uniformly eGFP+ and traced by Cre expression in Prx1-Cre:mT/mG mice. In addition, cells on the endosteum, osteocytes embedded deep in mineralized bone and articular chondrocytes were eGFP+ and traced in Prx1-Cre:mT/mG mice following rosiglitazone feeding or x-irradiation. Prx1 is differentially expressed in WAT.63 As an example, inguinal but not visceral white adipocytes are traced in Prx1-Cre mice.63,64 Whether Prx1 traces BM adipocytes in the axial skeleton remains to be shown. However, all white and brown adipocytes in all major adipose tissue depots were found to be tdTomato+ and untraced in Osx1-Cre:mT/mG mice. Supporting this finding was the low to non-existent tracing of APs, in these same mice. In contrast, BM adipocytes were found to be uniformly eGFP+ and traced by Cre expression in Osx1-Cre:mT/mG. These lineage-tracing results indicate that BM adipocytes arise from a mesenchymal-osteogenic lineage and are therefore distinct from white and brown adipocytes. These data suggest that BM adipocytes are different from adipocytes in other depots and agree with other data showing that Osx1 is not osteoblast specific due to the tracing of adipocytes in normal, non-induced BM.60 The relationship of marrow adipocyte and osteoblast differentiation remains poorly understood as the tracing of endosteal bone lining cells, osteocytes and marrow adipocytes could be the result of a single bi-potent progenitor or of 2 distinct precursor populations both traced by expression of osx1.
To further assess the relationship of BM adipocytes to white adipocytes, we examined PdgfRα-Cre:InsulinRfl/fl mice. In these mice, the insulin receptor is deleted in all PdgfRα expressing cells, including 50–60% of BM adipocytes. These mice are not overtly diabetic. They have no glucose tolerance phenotype at weaning, but are glucose intolerant by 8-weeks of age and the phenotype worsens over time. (Holtrup and Rodeheffer personal communication). These mice had extensive BM adipogenesis in the tibia and femur, with more than a 100% increase in osmium staining just distal to the growth plate, a more than 6-fold increase in the metaphysis and a 3-fold increase in the diaphysis as compared with the wild-type littermate controls. This increase in BM adipogenesis occurred in the absence of any exogenous induction (e.g., rosiglitazone or x-irradiation). In contrast, these same mice had what appeared to be, a severe generalized lack of white adipocytes. However, more extensive analysis showed the SWAT and GWAT contained much smaller adipocytes than Cre- controls (Holtrup and Rodeheffer unpublished). In contrast, marrow adipocytes were not reduced in size, with many large cells observed histologically. These data indicate that PdgfRα expression is different in BM adipocytes than in white adipocytes and that insulin signaling is not required for lipid filling in BM adipocytes. Moreover, our results suggest that BM adipocytes arise from progenitors that are distinct from white APs.
Marrow adipose tissue – autocrine, paracrine and endocrine interactions
Although the process of BM adipogenesis is poorly understood at the cellular or molecular level, it is becoming clear that MAT may regulate the activity of other cell populations in and out of bone.
Adipocyte-rich BM from the tail vertebrae of wild-type mice contains fewer, less proliferative hematopoietic stem cells (HSCs) and hematopoietic progenitors than adipocyte-free thoracic vertebrae. Importantly, the percentage of hematopoietic stem cells cKit+ Lin− Sca1+ Flk2−, multipotent progenitors, common myeloid progenitors, granulocyte-macrophage progenitors, and megakaryocyte-erythroid progenitors are all reduced 2- to 3-fold in BM from adipocyte-enriched tail vertebrae compared with BM from thoracic vertebrae.3 Additionally, preventing BM adipogenesis following lethal irradiation and bone marrow reconstitution using genetic or pharmacologic methods results in accelerated hematopoietic recovery.3 Similarly, removal of BM adipocytes from rabbit tibias results in increased hematopoiesis.65 Using a competitive transplantation model, mice receiving adipogeneic transplants had significantly reduced hematopoietic progenitor cells.45 In contrast, transplantation of multipotent (CD45-CD31-Sca1+CD24+) cells significantly increased repopulation of donor hematopoietic progenitors.45 These data suggest that the stage of differentiation of BM adipocyte precursors dictates their ability to regulate hematopoiesis in vivo.
However, the relationship of adipocytes in the vertebrae, especially the tail vertebrae, to adipocytes in the long bones is unknown. It is certainly possible that like differences between subcutaneous and visceral WAT, differences in lineage origin and function may exist between different MAT depots (i.e., long bones and vertebrae). Moreover, mice (Prx1-cre:Pparγfl/fl) made unable to develop adipocytes in their long bones survive following x-irradiation and BM reconstitution (S. Zehentmeier and M.C. Horowitz personal communication).
Although the precise nature of this inhibition is unclear, adipocytes secrete a variety of cytokines, including adiponectin and TNFα, both of which can inhibit hematopoietic cell proliferation.66-68 Yet, C3H/HeJ mice, which have very high marrow adiposity, have intact hematopoiesis and high cortical bone density (Horowitz and Rosen unpublished). In another example, although Early B Cell Factor1 (Ebf1) knockout mice are B-cell deficient, are lipodystrophic and have high levels of BM fat, the rest of their hematopoietic system is intact.69,70 Culturing of OP9 cells or rabbit BM mononuclear cells with human or rabbit adipocyte-conditioned media results in a significant reduction in the number of CD79a+ pre-pro-B cells, indicating that adipocytes are capable of inhibiting B-lymphopoiesis through secretion of a soluble factor.71-73 Additionally, while the BM derived mesenchymal cell line BMS2 supports osteoclastogenesis in vitro, co-culture of BMS2 derived adipocytes with primary BM depleted of adherent stromal and macrophage populations has been shown to prolong this osteoclastogenic support. This results in osteoclasts remaining in culture for at least 24 d.74 Mechanistically, this could be due to the macrophage colony- stimulating factor expressed by the BMS2 derived adipocytes. Similarly, differentiation of whole bone marrow with adipogenic inducers dexamethasone and IBMX has been reported to enhance osteoclastogenesis in vitro. This study indicated a mechanism by which osteoclastogenesis is supported by RANKL expression in Pref1+ bone marrow cells undergoing adipogenic differentiation.75 Pref-1 is a member of the EGF-like family of proteins and is a trans-membrane protein highly expressed in preadipocytes, osteoblastic cell lines and hMSCs.76 Pref-1 has been shown to be an important negative regulator of adipocyte and osteoblast differentiation. However, Pref1+ bone marrow cells have yet to be demonstrated as adipogenic or directly capable of inducing osteoclastogenesis in vitro or in vivo. Prx1-cre:PTH1Rfl/fl mice were generated to delete the PTH/PTHrP receptor from Prx1+ mesenchymal progenitor cells.77 These mice had a bone phenotype characterized by increased bone resorption, low bone mass, severely deformed tibias, increased numbers of tartrate-resistant acid phosphatase positive (TRAP+) cells and increased MAT. RT-PCR analysis showed that the marrow adipocytes from the Cre+ but not the Cre- cells expressed RANKL and are likely responsible for the increased numbers of osteoclasts and bone loss. Some of the RANKL+ cells were also Pref-1+. In addition, PTH treatment reduced marrow adipocyte numbers in humans by 27% after 18 months of PTH.77 These data show that the anabolic effect of PTH on bone can be attributed, at least in part, to regulation of osteoblast-adipocyte lineage allocation.
In general, the amount of MAT is low in the long bones and vertebrae of young animals, including humans and increases with age. The reason for this age dependent increase in MAT is unknown. Young women with anorexia nervosa and mice on a calorie-restricted diet have increased MAT, which correlates with increased fracture rate.78 The trauma of bone fracture itself induces MAT.43 Interestingly, fracture repair is mediated, at least in part, by mesenchymal progenitor cells that are likely descendants of Osx+, LepR+, Nestin+ stromal progenitor cells and are traced by α smooth muscle actin.42,43 Mouse and human marrow adipocytes can induce multiple myeloma proliferation in vitro.79,80 In addition, marrow adipocyte adipokines protected multiple myeloma from chemotherapy.81 Murine models have demonstrated that increasing MAT promotes the progression of osteolytic prostate cancer growth within bone.82 Thus, it is commonly perceived that the presence of MAT results in bone loss with biomechanically compromised bones. However, little if any data is currently available demonstrating a causal relationship between MAT and low bone volume. Indirectly, states of high MAT could allocate MSCs away from the osteoblast lineage and toward the adipocyte lineage resulting in less bone. In mice, strain (genetics) has a significant effect on the amount of MAT (Farber unpublished). As previously mentioned, C3H/HeJ (C3H) mice have very high endogenous levels of MAT even in young mice. In contrast, C57BL/6J mice have very low endogenous levels of MAT. Interestingly, C3H mice have one of the highest endogenous bone mineral densities (both trabecular and cortical) of any mouse strain examined. C57BL/B6J, on the other hand, have one of the lowest bone mineral densities of inbred strains.83 These data are important because they contradict the dogma that high marrow fat correlates with low bone density. The effect of MAT on bone density in humans is also unclear. Treatment with TZDs, in particular rosiglitazone in mice, induces MAT and correlates with decreased bone mass due to high rates of bone loss from enhanced osteoclastic activity.31 Similar findings are noted in humans, although the degree of MAT is far less than in mice. Obesity is correlated with increased MAT and studies in older men, postmenopausal women and children show that obesity increases the risk of fractures.82,84,85 However, there are currently no data demonstrating a causative relationship between MAT and fractures. To better understand the relationship of diet, MAT and bone mineral density, we studied the effects of a high fat diet (HFD) on bone mass and MAT in B6 mice following long- (84 d in males) or short-term (14 d in males and females) HFD. We found that consumption of a HFD increases the volume of MAT, albeit to an extent much less than rosiglitazone, but has little or no effect on trabecular and cortical bone as measured by DXA, histomorphometry, and micro-CT.32 These data indicate that the amount of MAT does not always correlate with changes in bone. The type of induction signal (i.e., x-irradiation vs rosiglitazone) appears to be another factor in this relationship (Horowitz, unpublished). Inflammation has been linked to the deleterious effects of visceral WAT.86 Therefore, one possible explanation for the bone loss is that MAT is involved in a localized inflammatory response with the release of cytokines that induce osteoclast activation.86
MAT – Conclusion
In long bones, MAT develops in the distal tibia and tail vertebrae ahead of the MAT in the proximal tibia and femur. However, the relationship of the MAT in the distal tibia to the tail vertebrae in unknown. As in humans, mouse MAT increases with age in the long bones. In young mice, MAT can be induced by a variety of stressors including feeding with a rosiglitazone containing diet or a diet low in methionine and x-irradiation. If feeding younger mice a HFD induces and increase in MAT it is difficult to detect by either osmium staining coupled with micro-CT or histology.
We have developed methods (osmium tetroxide staining and micro-CT) to measure and identify the position of MAT in mouse bones in vivo. Fluorescent Cre-lox methods have been developed to lineage trace marrow adipocytes ex-vivo as well as the cells in the medullary canal, on bone surfaces or perivascularly.
Our data and that of others indicate that marrow adipocytes are different from white, brown and beige adipocytes and arise from a distinct progenitor. Adipocytes that are found in long bones arises from mesenchymal stem cells and there is ample evidence that MAT and osteoblasts share an early common progenitor. However, there is also evidence that multiple progenitors, with different cell surface phenotypes can give rise to adipocytes. Whether this reflects different stages of differentiation or truly different lineages; or if these cells give rise to both lineages or separate precursors that differentiate down distinct lineages remains to be shown in vivo. Moreover, the cell surface phenotype of this precursor remains to be identified as well as whether it is in the BM, on the endosteum or in association with the vasculature.
There is a developing body of evidence just as like different WAT depots (i.e., anterior vs posterior expression of Prx1) express different lineage markers, different MAT depots (distal tibia vs tail vertebrae) arise from different progenitors.62 Although not discussed here in detail, differences in rMAT between C57BL/6J and C3H/HeJ mice strongly suggest that development of MAT has a strong genetic component.
A variety of physiologic signals result in the development of MAT in young animals and the increase in MAT in older animals. This suggests an important role for MAT in local (in the BM) interactions such as repair, as a source of energy and in systemic interactions as a source of adipokines. These data raise a series of critical questions; particularly related to the role BM adipocytes play in regulating BM cell differentiation and function. One thing is clear, BM adipocytes are not “just filler.”
This work was supported by the National Institute of Diabetes, Digestive, and Kidney Disease of the National Institutes of Health under Grant R24DK092759 and the Department of Orthopaedics and Rehabilitation, Yale University School of Medicine, New Haven, CT 06510
Disclosure of potential conflicts of interest
Dr. Horowitz is a consultant for the Orentreich Foundation for the Advancement of Science.
Acknowledgments
The authors thank Ms. Rose Webb and Ms. Nancy Troiano for their help in developing the histologic techniques used to analyze MAT. The authors also thank Dr. Josh VanHouton for his help in measuring marrow fat using micro-CT.
References
- [1].Gimble JM, Robinson CE, Wu X, Kelly KA. The function of adipocytes in the bone marrow stroma: an update. Bone. 1996;19(5):421-428. doi: 10.1016/S8756-3282(96)00258-X. PMID:8922639 [DOI] [PubMed] [Google Scholar]
- [2].Rosen CJ, Ackert-Bicknell C, Rodriguez JP, Pina AM. Marrow fat and the bone micro-environment; Developmental, functional, and pathological implications. Cirt Rev Eukaryot Gen Expr. 2009;19(2):109-124. doi: 10.1615/CritRevEukarGeneExpr.v19.i2.20 [DOI] [PMC free article] [PubMed] [Google Scholar]
- [3].Naveiras O, Nardi V, Wenzel PL, Hauschka PV, Fahey F, Daley GQ. Bone-marrow adipocytes as negative regulators of the haematopoietic microenvironment. Nature. 2009;460(7252):259-263. doi: 10.1038/nature08099. PMID:19516257 [DOI] [PMC free article] [PubMed] [Google Scholar]
- [4].Kershaw EE, Flier JS. Adipose tissue as an endocrine organ. J Clin Endocrinol Metab. 2004;89(6):2548-2556. doi: 10.1210/jc.2004-0395. PMID:15181022 [DOI] [PubMed] [Google Scholar]
- [5].Pischon T, Boeing H, Hoffmann K, Bergmann N, Schulze MB, Overvad K, van der Schouw YT, Spencer E, Moons KG, Tionneland A, et al.. General and abdominal adiposity and risk of death in Europe. N Engl J Med. 2008;359(20):2105-2120. doi: 10.1056/NEJMoa0801891. PMID:19005195 [DOI] [PubMed] [Google Scholar]
- [6].Pou KM, Massaro JM, Hoffmann U, Vasan RS, Maurovich-Horvat P, Larson MG, Keaney JF Jr, Meigs JB, LIpinska I, Kathiresan S, et al.. Visceral and subcutaneous adipose tissue volumes are cross-sectionally related to markers of inflammation and oxidative stress: the Framingham Heart Study. Circulation. 2007;116(11):1234-1241. doi: 10.1161/CIRCULATIONAHA.107.710509. PMID:17709633 [DOI] [PubMed] [Google Scholar]
- [7].Nedergaard J, Bengtsson T, Cannon B. Unexpected evidence for active brown adipose tissue in adult humans. Am J Physiol Endocrinol Metab. 2007;293(2):E444-452. doi: 10.1152/ajpendo.00691.2006. PMID:17473055 [DOI] [PubMed] [Google Scholar]
- [8].Cannon B, Nedergaard J. Brown adipose tissue: function and physiological significance. Physiol Rev. 2004;84(1):277-359. doi: 10.1152/physrev.00015.2003. PMID:14715917 [DOI] [PubMed] [Google Scholar]
- [9].Atit R, Sgaier SK, Mohamed OA, Taketo MM, Dufort D, Joyner AL, Niswander L, Conlon RA. Beta-catenin activation is necessary and sufficient to specify the dorsal dermal fate in mouse. Dev Biol. 2006;296(1):164-176. doi: 10.1016/j.ydbio.2006.04.449. PMID:16730693 [DOI] [PubMed] [Google Scholar]
- [10].Lepper C, Fan CM. Inducible lineage tracing of Pax7-descendant cells reveals embryonic origin of adult satellite cells. Genesis. 2010;48(7):424-436. doi: 10.1002/dvg.20630. PMID:20641127 [DOI] [PMC free article] [PubMed] [Google Scholar]
- [11].Seale P, Bjork B, Yang W, Kajimura S, Chin S, Kuang S, Scimè A, Devarakonda S, Conroe HM, Erdjument-Bromage H, et al.. PRDM16 controls a brown fat/skeletal muscle switch. Nature. 2009;454(7207):961-967. doi: 10.1038/nature07182 [DOI] [PMC free article] [PubMed] [Google Scholar]
- [12].Wu J, Boström P, Sparks LM, Ye L, Choi JH, Giang AH, Khandekar M, Virtanen KA, Nuutila P, Schaart G, et al.. Beige adipocytes are a distinct type of thermogenic fat cell in mouse and human. Cell. 2012;150(2):366-376. doi: 10.1016/j.cell.2012.05.016. PMID:22796012 [DOI] [PMC free article] [PubMed] [Google Scholar]
- [13].Guerra C, Koza RA, Yamashita H, Walsh K, Kozak LP. Emergence of brown adipocytes in white fat in mice is under genetic control. Effects on body weight and adiposity. J Clin Invest. 1998,102(2):412-420. [DOI] [PMC free article] [PubMed] [Google Scholar]
- [14].Poissonnet CM, Burdi AR, Bookstein FL. Growth and development of human adipose tissue during early gestation. Early Hum Dev. 1983;8(1):1-11. doi: 10.1016/0378-3782(83)90028-2. PMID:6851910 [DOI] [PubMed] [Google Scholar]
- [15].Poissonnet CM, Burdi AR, Garn SM. The chronology of adipose tissue appearance and distribution in the human fetus. Early Human Dev. 1994;10:1-11. doi: 10.1016/0378-3782(84)90106-3 [DOI] [PubMed] [Google Scholar]
- [16].Berg W. The development of human fat. Z Morph Anthrop. 1911;13 [Google Scholar]
- [17].Birsoy K, Chen Z, Friedman J. Transcriptional regulation of adipogenesis by KLF4. Cell Metab. 2008;7(4):339-347. doi: 10.1016/j.cmet.2008.02.001. PMID:18396140 [DOI] [PMC free article] [PubMed] [Google Scholar]
- [18].Han J, Lee JE, Jin J, Lim JS, Oh N, Kim K, Chang SI, Shibuya M, Kim H, Koh GY. The spatiotemporal development of adipose tissue. Development, 2011:138(22):5027-5037. doi: 10.1242/dev.067686. PMID:22028034 [DOI] [PubMed] [Google Scholar]
- [19].Fox K, Peters D, Armstrong N, Sharpe P, Bell M. Abdominal fat deposition in 11-year-old children. Int J Obes Relat Metab Disord. 1993;17(1):11-16. PMID:8383635 [PubMed] [Google Scholar]
- [20].Siegel MJ, Hildebolt CF, Bae KT, Hong C, White NH. Total and intraabdominal fat distribution in preadolescents and adolescents: measurement with MR imaging. Radiology. 2007;242(3):846-856. doi: 10.1148/radiol.2423060111. PMID:17244720 [DOI] [PubMed] [Google Scholar]
- [21].Wassermann F. On the formation of appendices epiploicae in man, with consideration of the development of the fat organs therein. Ergeb Anat Anz. 1927;63 [Google Scholar]
- [22].Houstek J, Kopecky J, Rychter Z, Soukup T. Uncoupling protein in embryonic brown adipose tissue-existence of nonthermogenic and thermogenic mitochondria. Biochim Biophys Acta. 1988;935(1):19-25. doi: 10.1016/0005-2728(88)90103-X. PMID:2900653 [DOI] [PubMed] [Google Scholar]
- [23].Cypess AM, Lehman S, Williams G, Tal I, Rodman D, Goldfine AB, Kuo FC, Palmer EL, Tseng YH, Doria A, et al.. Identification and importance of brown adipose tissue in adult humans. N Engl J Med. 2009;360(15):1509-1517. doi: 10.1056/NEJMoa0810780. PMID:19357406 [DOI] [PMC free article] [PubMed] [Google Scholar]
- [24].Yoneshiro T, Aita S, Matsushita M, Kayahara T, Kameya T, Kawai Y, Iwanaga T, Saito M. Recruited brown adipose tissue as an antiobesity agent in humans. J Clin Invest. 2013;123:3404-3408. doi: 10.1172/JCI67803. PMID:23867622 [DOI] [PMC free article] [PubMed] [Google Scholar]
- [25].Moerman EJ, Teng K, Lipschitz DA, Lecka-Czernik B. Aging activates adipogenic and suppresses osteogenic programs in mesenchymal marrow stroma/stem cells: the role of PPAR-γ2 transcription factor and TGF-β/BMP signaling pathway. Aging Cell. 2004;3(6):379-389. doi: 10.1111/j.1474-9728.2004.00127.x. PMID:15569355 [DOI] [PMC free article] [PubMed] [Google Scholar]
- [26].Moore SG, Dawson KL. Red and yellow marrow in the femur: age-related changes in appearance at MR imaging. Radiology. 1990;175(1):219-223. doi: 10.1148/radiology.175.1.2315484. PMID:2315484 [DOI] [PubMed] [Google Scholar]
- [27].Scheller EL, Doucette CR, Learman BS, Cawthorn WP, Khandaker S, Schell B, Wu B, Ding SY, Bredella MA, Fazeli PK, et al.. Region-specific variation in the properties of skeletal adipocytes reveals regulated and constitutive marrow adipose tissues. Nat Commun. 2015;6:7808. doi: 10.1038/ncomms8808. PMID:26245716 [DOI] [PMC free article] [PubMed] [Google Scholar]
- [28].Berry R, Rodeheffer MS, Rosen CJ, Horowitz MC. Adipose tissue residing progenitors (adipocyte lineage progenitors and adipose derived stem cells (ADSC). Curr Mol Biol Rep. 2015;1(3):101-109. doi: 10.1007/s40610-015-0018-y. PMID:26526875 [DOI] [PMC free article] [PubMed] [Google Scholar]
- [29].Lecka-Czernik G, Moerman EJ, Grant DF, Lehmann JM, Manolagas SC, Jilka RL. Divergent effects of selective peroxisome proliferator-activated receptor-gamma 2 ligands on adipocyte versus osteoblast differentiation. Endocrinology. 2002;143(6):2376-2384. doi: 10.1210/endo.143.6.8834. PMID:12021203 [DOI] [PubMed] [Google Scholar]
- [30].Horowitz M, Berry R, Fretz J, Nelson T, Church C, Doucette C, Troiano N, VanHoutan J, MacDouglad O, Rosen C. Bone marrow adipogenesis. J Bone Miner Res. 2013;28:S17 [Google Scholar]
- [31].Ackert-Bicknell CL, Shockley KR, Horton LG, Lecka-Czernik B, Churchill GA, Rosen CJ. Strain-specific effects of rosiglitazone on bone mass, body composition, and serum insulin-like growth factor-I. Endocrinology. 2009;150(3):1330-40. doi: 10.1210/en.2008-0936. PMID:18948404 [DOI] [PMC free article] [PubMed] [Google Scholar]
- [32].Doucette CR, Horowitz MC, Berry R, MacDougald OA, Anunciado-Koza R, Koza RA, Rosen CJ. A high fat diet increases bone marrow adipose tissue (MAT) but does not alter trabecular or cortical bone mass in C57BL/6J mice. Cell Physiol. 2015;230(9):2032-2037. doi: 10.1002/jcp.24954 [DOI] [PMC free article] [PubMed] [Google Scholar]
- [33].Scheller EL, Khoury B, Moller KL, Wee NKY, Khandaker S, Kozloff KM, Abrishami SH, Zamarron BF, Singer K. Changes in skeletal integrity and marrow adiposity during high-fat diet and after weight loss. Frontiers in Endocinology. 2016;7:102. [DOI] [PMC free article] [PubMed] [Google Scholar]
- [34].Hine C, Harputlugil E, Zhang Y, Ruckenstuhl C, Lee BC, Brace L, Longchanp A, Trevino-Villarreal JH, Mejia P, Ozaki CK, et al.. Endogenous hydrogen sulfide production is essential for dietary restriction benefits. Cell. 2015;60(1-2):132-144. doi: 10.1016/j.cell.2014.11.048 [DOI] [PMC free article] [PubMed] [Google Scholar]
- [35].Plummer J, Park M, Perodine F, Horowitz MC, Hens JR. Methionine-restricted diet increases miRNAs that can target RUNX2 expression and alters bone structure in young mice. J Cell Biochem. 2017;118(1):31-42. doi: 10.1002/jcb.25604. PMID:27191548 [DOI] [PMC free article] [PubMed] [Google Scholar]
- [36].Patil YN, Dille KN, Burk DH, Cortez CC, Gettys TW. Cellular and molecular remodeling of inguinal adipose tissue mitochondria by dietary methionine restriction. J Nutr Biochem. 2015;26(11):11235-1247. doi: 10.1016/j.jnutbio.2015.05.016 [DOI] [PMC free article] [PubMed] [Google Scholar]
- [37].Berry R, Holtrup B, Hens J, Ables G, Nelson T, Webb R, Rosen C, Rodeheffer M, Horowitz M. Marrow adipose tissue is distinct from white and brown fat and does not beige. ASBMR. 2016. Annual Meeting;31(Suppl 1):S14. [Google Scholar]
- [38].Palade GE. A study of fixation for electron microscopy. J Exp Med. 1952;95(3):285-298. doi: 10.1084/jem.95.3.285. PMID:14927794 [DOI] [PMC free article] [PubMed] [Google Scholar]
- [39].Turello R, Snyder D, Hartman H, Hartman A. A modification of the osmium tetroxide post-fixation technique for the demonstration of extracellular lipid in paraffin-embedded tissue sections. J Histotechnology. 1984;7:75-77. doi: 10.1179/his.1984.7.2.75 [DOI] [Google Scholar]
- [40].Scheller EL, Troiano N, Vanhoutan JN, Bouxsein MA, Fretz JA, Xi Y, Nelson T, Katz G, Berry R, Church CD, et al.. Use of osmium tetroxide staining with microcomputerized tomography to visualize and quantify bone marrow adipose tissue in vivo. Methods Enzymol. 2014;37:123-139. doi: 10.1016/B978-0-12-411619-1.00007-0 [DOI] [PMC free article] [PubMed] [Google Scholar]
- [41].Styner M, Thompson WR, Galior K, Uzer G, Wu X, Kadari S, Case N, Xie Z, Sen B, Romaine A, et al.. Bone marrow fat accumulation accelerated by high fat diet is suppressed by exercise. Bone. 2014;64:39-46. doi: 10.1016/j.bone.2014.03.044. PMID:24709686 [DOI] [PMC free article] [PubMed] [Google Scholar]
- [42].Mizoguchi T, Pinho S, Ahmed J, Kunisaki Y, Hanoun M, Mendelson A, Ono N, Kronenberg HM, Frenette PS. Osterix marks distinct waves of primitive and definitive stromal progenitors during bone marrow development. Dev Cell. 2014;29(3):340-349. doi: 10.1016/j.devcel.2014.03.013. PMID:24823377 [DOI] [PMC free article] [PubMed] [Google Scholar]
- [43].Zhou BO, Yue R, Murphy MM, Peyer JG, Morrison SJ. Leptin-receptor-expressing mesenchymal stromal cells represent the main source of bone formed by adult bone marrow. Cell Stem Cell. 2014;15(2):154-168. doi: 10.1016/j.stem.2014.06.008. PMID:24953181 [DOI] [PMC free article] [PubMed] [Google Scholar]
- [44].Worthley DL, Churchill M, Compton JT, Tailor Y, Rao M, Si Y, Levin D, Schwartz MG, Uygur A, Hayakawa Y. Gremlin 1 identifies a skeletal stem cell with bone, cartilage, and reticular stromal potential. Cell. 2015;160(1-2):269-284. doi: 10.1016/j.cell.2014.11.042. PMID:25594183 [DOI] [PMC free article] [PubMed] [Google Scholar]
- [45].Ambrosi TH, Scialdone A, Graja A, Gohlke S, Jank A-M, Bocian C, Woelk L, Logan DW, Schurmann A, Saraiva LR, Schulz TJ. Adipocyte accumulation in the bone marrow during oberity and aging impairs stem cell-based hematopoietic and bone regeneration. Cell Stem Cell. 2017;20:201-214 [DOI] [PMC free article] [PubMed] [Google Scholar]
- [46].Joe AW, Yi L, Natarajan A, Le Grand F So L, Wang J, Rudnicki MA, Rossi FM. Muscle injury activates resident fibro/adipogenic progenitors that facilitate myogenesis. Nat Cell Biol. 2010;12:153-163. doi: 10.1038/ncb2015. PMID:20081841 [DOI] [PMC free article] [PubMed] [Google Scholar]
- [47].Uezumi A, Fukada S, Yamamoto N, Takeda S, Tsuchida K. Mesenchymal progenitors distinct from satellite cells contribute to ectopic fat cell formation in skeletal muscle. Nat Cell Biol. 2010;12(2):143-152. doi: 10.1038/ncb2014. PMID:20081842 [DOI] [PubMed] [Google Scholar]
- [48].Rodeheffer MA, Birsoy K, Friedman JM. Identification of white adipocyte progenitor cells in vivo. Cell. 2008;135(2):240-249. doi: 10.1016/j.cell.2008.09.036. PMID:18835024 [DOI] [PubMed] [Google Scholar]
- [49].Berry R, Rodeheffer MS. Characterization of the adipocyte cellular lineage in vivo. Nat Cell Biol. 2013;15:302-308. doi: 10.1038/ncb2696. PMID:23434825 [DOI] [PMC free article] [PubMed] [Google Scholar]
- [50].Majka SM, Fox KE, Psilas JC, Helm KM, Childs CR, Acosta AS, Janssen RC, Friedman JE, Woessner BT, Shade TR, et al.. De novo generation of white adipocytes from the myeloid lineage via mesenchymal intermediates is age, adipose depot, and gender specific. Proc Natl Acad Sci USA. 2010;107(33):14781-14786. doi: 10.1073/pnas.1003512107. PMID:20679227 [DOI] [PMC free article] [PubMed] [Google Scholar]
- [51].Zmuidzinas A, Fischer KD, Lira SA, Forrester L, Bryant S, Bernstein A, Barbacid M. The vav proto-oncogene is required early in embryogenesis but not for hematopoietic development in vitro. EMBO K. 1995;14(1):1-11 [DOI] [PMC free article] [PubMed] [Google Scholar]
- [52].Katzav S, Martin-Zanca D, Barbacid M. vav, a novel human oncogene derived from a locus ubiquitously expressed in hematopoietic cells. EMBO J. 1989;8(8):2283-8890. PMID:2477241 [DOI] [PMC free article] [PubMed] [Google Scholar]
- [53].Tishinsky JM, Robinson LE, Dyck DJ. Insulin-sensitizing properties of adiponectin. Biochimie. 2012;94:2131-2136. doi: 10.1016/j.biochi.2012.01.017. PMID:22314192 [DOI] [PubMed] [Google Scholar]
- [54].CawthornWP Scheller EL, Learman BS, Parlee SD, Simon BR, Mori H, Ning X, Bree AJ, Schell B, Broome DT, et al.. Bone marrow adipose tissue is an endocrine organ that contributes to increased circulating adiponectin during caloric restriction. Cell Metabolism. 2014;20(2):368-375. doi: 10.1016/j.cmet.2014.06.003. PMID:24998914 [DOI] [PMC free article] [PubMed] [Google Scholar]
- [55].Wang QA, Tao C, Gupta RK, Scherer PE. Tracking adipogenesis during white adipose tissue development, expansion and regeneration. Nat Med. 2013;19(10):1338-1344. doi: 10.1038/nm.3324. PMID:23995282 [DOI] [PMC free article] [PubMed] [Google Scholar]
- [56].Krings A, Rahman S, Huang S, Lu Y, Czernik PJ, Lecka-Czernik B. Bone marrow fat has brown adipose tissue characteristics, which are attenuated with aging and diabetes. Bone. 2012;50(2):546-552. doi: 10.1016/j.bone.2011.06.016. PMID:21723971 [DOI] [PMC free article] [PubMed] [Google Scholar]
- [57].Yagi M, Arentsen L, Shanley RM, Rosen CJ, Kidder LS, Sharkey LC, Yee D, Koizumi M, Ogawa K, Hui SK. A Dual-radioisotope hybrid whole-body micro-positron emission tomography/computed tomography system reveals functional heterogeneity and early local and systemic changes following targeted radiation to the murine caudal skeleton. Calcif Tissue Int. 2014;94(5):544-552. doi: 10.1007/s00223-014-9839-6. PMID:24562595 [DOI] [PMC free article] [PubMed] [Google Scholar]
- [58].Bolan PJ, Arentsen L, Sueblinvong T, Zhang Y, Moeller S, Carter JS, Downs LS, Ghebre R, Yee D, Froelich J, et al.. Water-Fat MRI for assessing changes in bone marrow composition due to radiation and chemotherapy in gynecologic cancer patients. J Magn Reson Imaging. 2013;38(6):1578-1584. doi: 10.1002/jmri.24071. PMID:23450703 [DOI] [PMC free article] [PubMed] [Google Scholar]
- [59].Nakashima K, Zhou X, Kunkel G, Zhang Z, Deng JM, Behringer RR, deIsh Crombrugghe B. The novel zinc finger-containing transcription factor osterix is required for osteoblast differentiation and bone formation. Cell. 2002;108(1):17-29. doi: 10.1016/S0092-8674(01)00622-5. PMID:11792318 [DOI] [PubMed] [Google Scholar]
- [60].Chen J, Shi Y, Regan J, Karuppaiah K, Ornitz DM, Long F. Osx-Cre targets multiple cell types besides osteoblast lineage in postnatal mice. PLoS ONE. 2014;9:e85161. doi: 10.1371/journal.pone.0085161. PMID:24454809 [DOI] [PMC free article] [PubMed] [Google Scholar]
- [61].Liu Y, Strecker S, Wang L, Fronenberg MS, Wang W, Rowe DW, Maye P. Osterix-cre labeled progenitor cells contribute to the formation and maintenance of the bone marrow stroma. PLoS One. 2013;8:e71918. [DOI] [PMC free article] [PubMed] [Google Scholar]
- [62].Logan M, Martin JF, Nagy A, Lobe C, Olson EN, Tabin CJ. Expression of cre recombinase in the developing mouse limb bud driven by a Prxl enhancer. Genesis. 2002;33(2):77-80. doi: 10.1002/gene.10092. PMID:12112875 [DOI] [PubMed] [Google Scholar]
- [63].Sanchez-Gurmaches J, Hsiao W-Y, Guertin DA. Highly selective in vivo labeling of subcutaneous white adipocyte precursors with Prx1-Cre. Stem Cell Reports. 2015;4(4):541-550. doi: 10.1016/j.stemcr.2015.02.008. PMID:25801508 [DOI] [PMC free article] [PubMed] [Google Scholar]
- [64].Krueger KC, Costa MJ, Du H, Feldman BJ. Characterization of cre recombinase activity for in vivo targeting of adipocyte precursor cells. Stem Cell Reports. 2014;3(6):1147-1158. doi: 10.1016/j.stemcr.2014.10.009. PMID:25458893 [DOI] [PMC free article] [PubMed] [Google Scholar]
- [65].Tavassoli M, Maniatis A, Crosby WH. Induction of sustained hemopoiesis in fatty marrow. Blood. 1974;43(1):33-38. PMID:4809095 [PubMed] [Google Scholar]
- [66].Yokota T, Oritani K, Takahashi I, Ishikawa J, Matsuyama A, Ouchi N, Kihara S, Funahashi T, Tenner AJ, Tomiyama Y, et al.. Adiponectin, a new member of the family of soluble defense collagens, negatively regulates the growth of myelomonocytic progenitors and the functions of macrophages. Blood. 2000;96(5):1723-1732. PMID:10961870 [PubMed] [Google Scholar]
- [67].Zhang Y, Harada A, Bluethmann H, Wang JB, Nakao S, Mukaida N, Matsushima K. Tumor necrosis factor (TNF) is a physiologic regulator of hematopoietic progenitor cells: increase of early hematopoietic progenitor cells in TNF receptor p55-deficient mice in vivo and potent inhibition of progenitor cell proliferation by TNFa in vitro. Blood. 1995;86(8):2930-2937. PMID:7579385 [PubMed] [Google Scholar]
- [68].Hotamisligil GS, Shargill NS, Spiegelman BM. Adipose expression of tumor necrosis factor-a: direct role in obesity-linked insulin resistance. Science. 1993;259(5091):87-91. doi: 10.1126/science.7678183. PMID:7678183 [DOI] [PubMed] [Google Scholar]
- [69].Lin H, Grosschedl R. Failure of B-cell differentiation in mice lacking the transcription factor EBF. Nature. 1995;376:263-267. doi: 10.1038/376263a0. PMID:7542362 [DOI] [PubMed] [Google Scholar]
- [70].Hesslein DG, Fretz JA, Xi Y, Nelson T, Zhou S, Lorenzo JA, Schatz DG Horowitz MC. Ebf1-dependent control of the osteoblast and adipocyte lineages. Bone. 2009;44(4):537-546. doi: 10.1016/j.bone.2008.11.021. PMID:19130908 [DOI] [PMC free article] [PubMed] [Google Scholar]
- [71].Bilwani FA, Knight KL. Adipocyte-derived soluble factor(s) inhibits early stages of B lymphopoiesis. J Immunol. 2012;189(9):4379-4386. doi: 10.4049/jimmunol.1201176. PMID:23002443 [DOI] [PMC free article] [PubMed] [Google Scholar]
- [72].Yokota T, Meka CS, Medina KL, Igarashi H, Comp PC, Takahashi M, Nishida M, Oritani K, Miyagawa J, Funahashi T, et al.. Paracrine regulation of fat cell formation in bone marrow cultures via adiponectin and prostaglandins. J Clin Invest. 2002;109(10):1303-1310. doi: 10.1172/JCI0214506. PMID:12021245 [DOI] [PMC free article] [PubMed] [Google Scholar]
- [73].Yokota T, Meka CS, Kouro T, Medina KL, Igarashi H, Takahashi M, Oritani K, Funahashi T, Tomiyama Y, Matsuzawa Y, et al (2003) Adiponectin, a fat cell product, influences the earliest lymphocyte precursors in bone marrow cultures by activation of the cyclooxygenase–prostaglandin pathway in stromal cells. J Immunol. 2003;171(10):5091-5099. doi: 10.4049/jimmunol.171.10.5091 [DOI] [PubMed] [Google Scholar]
- [74].Kelly KA, Tanaka S, Baron R, Gimble JM. Murine bone marrow stromally derived BMS2 adipocytes support differentiation and function of osteoclast-like cells in vitro. Endocrinology. 1998;139(4):2092-2101. doi: 10.1210/endo.139.4.5915. PMID:9528998 [DOI] [PubMed] [Google Scholar]
- [75].Takeshita S, Fumoto T, Naoe Y, Ikeda K. Age-related marrow adipogenesis is linked to increased expression of RANKL. J Bio Chem. 2014;289(24):16699-16710. doi: 10.1074/jbc.M114.547919 [DOI] [PMC free article] [PubMed] [Google Scholar]
- [76].Abdallah BM, Jensen CH, Gutierrez G, Leslie RG, Jensen TG, Kassem M. Regulation of human skeletal stem cells differentiation by Dik1/Pref-1. J Bone Miner Res. 2004;19(5):841-852. doi: 10.1359/jbmr.040118. PMID:15068508 [DOI] [PubMed] [Google Scholar]
- [77].Fan Y, Hanai J-I, Le PT Bi R, Maridas D, DeMambro V, Figueroa CA, Kir S, Zhou X, Mannstadt M, et al.. Parathyroid hormone directs bone marrow mesenchymal cell fate. Cell Metabolism. 2017;25:1-12. doi: 10.1016/j.cmet.2017.01.001. PMID:28076760 [DOI] [PMC free article] [PubMed] [Google Scholar]
- [78].Fazeli PK, Horowitz MC, MacDouglad OA, El Scheller, Rodeheffer MS, Rosen CJ, Klibanski A. Marrow fat and bone—new perspectives. J Clin Endocrinal Metab. 2013;98(3):935-945. doi: 10.1210/jc.2012-3634 [DOI] [PMC free article] [PubMed] [Google Scholar]
- [79].Reagan MR, Liaw L, Rosen CJ, Ghobrial IR. Dynamic interplay between bone and multiple myeloma: emerging roles of the osteoblast. Bone. 2015;75:161-169. doi: 10.1016/j.bone.2015.02.021. PMID:25725265 [DOI] [PMC free article] [PubMed] [Google Scholar]
- [80].Caers J, Deleu S, Belaid Z, De Raeve H, Van Valckenborgh E, De Bruyne E, Defresne MP, Van Riet I, Van Camp B, Vanderkerken K. Neighboring adipocytes participate in the bone marrow microenvironment of multiple myeloma cells. Leukemia. 2007;21:1580-1584. doi: 10.1038/sj.leu.2404658. PMID:17377589 [DOI] [PubMed] [Google Scholar]
- [81].Liu Z, Xu J, He J, Liu H, Lin P, Wan X, Navone NM, Tong Q, Kwak LW, Orlowski RZ, et al.. Mature adipocytes in bone marrow protect myeloma cells against chemotherapy through autophagy activation. Oncotarget. 2015;6:34329-34341. PMID:26455377 [DOI] [PMC free article] [PubMed] [Google Scholar]
- [82].Vander Eerden B, van Wijnen A. Meeting report of the 2016 bone marrow adiposity meeting. Adipocyte. 2017:1-10. doi: 10.1080/21623945.2017.1313374 [DOI] [PMC free article] [PubMed] [Google Scholar]
- [83].Beamer WG, Donahue LR, Rosen CJ, Baylink DJ. Genetic variability in adult bone density among inbred strains of mice. Bone. 1996;18(5):397-403. doi: 10.1016/8756-3282(96)00047-6. PMID:8739896 [DOI] [PubMed] [Google Scholar]
- [84].Gilsanz V, Chalfant J, Mo AO, Lee DC, Dorey FJ, Mittelman SD. Reciprocal relations of subcutaneous and visceral fat to bone structure and strength. J Clin Endocrinol Metab. 2009;94(9):3387-3393 [DOI] [PMC free article] [PubMed] [Google Scholar]
- [85].von Muhlen D, Safii S, Jassal SK, Svartberg J, Barrett-Connor E.. Associations between the metabolic syndrome and bone health in older men and women: the Rancho Bernardo Study. Osteoporos Int. 2007;18(10):1337-1344. doi: 10.1007/s00198-007-0385-1. PMID:17492393 [DOI] [PubMed] [Google Scholar]
- [86].Tilg H, Moschen AR.. Adipocytokines mediators linking adipose tissue, inflammation and immunity. Nat Rev Immunol. 2006;6(10):772-778. doi: 10.1038/nri1937. PMID:16998510 [DOI] [PubMed] [Google Scholar]