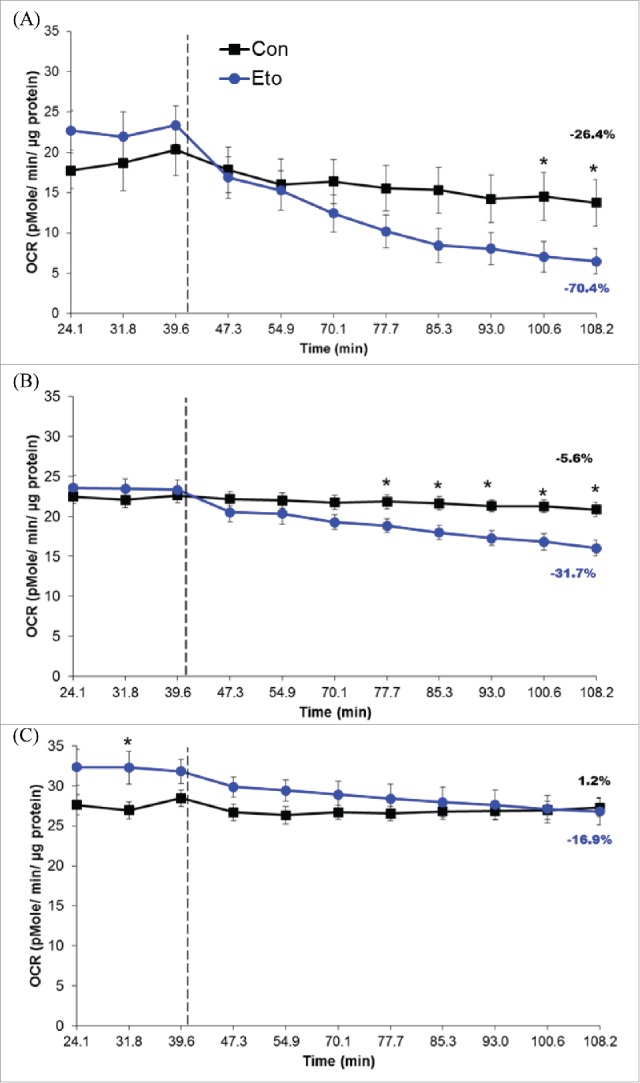
Figure 4.

Oxygen consumption rates (OCR) from bone marrow stromal cells (BMSCs) cultured under osteogenic conditions for 0 (A), 2 (B), or 7 (C) days. Hashed lines represent time at which XF Base medium (control, Con) or 50 µM etomoxir (Eto) were injected. Percent change in OCR, from baseline to final reading, is also represented on graphs. Data shown is presented as mean ± standard error. Symbol, *, denotes statistically significant differences (P < 0.05) between groups at a given time point.
