Abstract
Natural killer (NK) cells may play an important role in the pathogenesis of SLE. Interleukin(IL)-15, an NK-enhancing cytokine, is over-expressed in SLE patients. In the present study, we examined the effect of IL-15 on NK cytotoxicity of SLE patients, and the expression of various activating and inhibitory NK receptors on NK cells from SLE patients in relation to disease activity. We also sought to determine how IL-15 would affect the NK receptor expression on NK cells from SLE patients. PBMCs were collected from 88 SLE patients with inactive disease activity (SLEDAI score<6) and active disease activity (SLEDAI score≥6), 26 age-matched healthy adults were used as controls. PBMC were incubated in the presence or absence of IL-15 (10ng/ml) for eighteen hours. CD3-CD56+ lymphoctes were gated using flow cytometry and further divided into CD56dim and CD56bright subsets according to the MFI of CD56. We observed that 1. Serum IL-15 was elevated in SLE patients, and higher in active disease than in inactive disease; 2. NK cytotoxicity of SLE patients was deficient compared to controls and showed an impaired response to IL-15 compared to controls; 3.CD69, CD94, NKG2A, NKp30, and CD158b on NK cells from SLE patients were higher than controls, and could be further enhanced by IL-15; 4. NKp46 expression from SLE patients was higher than controls, but down-regulated by IL-15; 5.Deficient NKG2D and NKAT-2 expression were found on NK cells from SLE patients, which were enhanced by IL-15; 6. A unique NKp46- subset and CD158b+ subsets were observed in NK cells from SLE patients but not controls. 7. Unlike controls, CD158k on NK cells from SLE patients failed to respond to IL-15. Taken together, we demonstrated the aberrant NCR and iNKR expression on NK cells and their distinct response to IL-15 in SLE patients. As IL-15 predominantly aggravates the aberrant NKR expression found in SLE, IL-15 antagonist may have therapeutic benefits in SLE patients.
Introduction
Systemic lupus erythematosus (SLE) is a chronic systemic inflammatory autoimmune disease with a wide array of clinical manifestations characterized by the presence of high titers of autoantibodies, elevated circulating immune complexes, and complement deficiency [1, 2]. The etiology and pathogenesis of SLE remained to be elucidated.
Natural killer (NK) cells are CD3-CD56+ large granular lymphocytes, serve as a first-line defense against viral infection and tumors [3, 4]. According to the CD56 molecule density on NK cell surface, NK cells can be divided into two subsets. CD56dim NK cells express CD16 and are responsible for cytotoxic function. CD56bright NK cells have the capacity to produce abundant cytokines and serve as immunoregulators [5, 6]. Previous studies a have found a decrease in NK cell numbers, impaired NK cytotoxicity and defects of NK differentiation in SLE patients [7–9]. NK cells can serve as a double-edge sword as it may promote the inflammation in SLE by producing interferon-gamma (IFN-γ) which may promote B cell activation and aut0-antibody production [10]. On the other hand, NK cells may ameliorate the inflammation by their ability to kill activated T cells and macrophages. IFN- γ produced by NK cells may also suppress Th17 differentiation [11]. The relationship between NK cell abnormalities and SLE activity was not clearly established and the role of NK cells in the pathogenesis of SLE remains controversial. We have demonstrated the dysfunctional NK and NKT-like cells in SLE patient with regard to CD11b and CD62L expression [12].
NK cell activation is mediated by a series of surface receptors and co-receptors. CD69, a typeII C-lectin membrane receptor which is rapidly induced upon activation, is considered pro-inflammatory as CD69+ NK cells were able to induce the TNF-alpha release by monocytes [13]. NKp46 and NKp30 are natural cytotoxicity receptors that constitutively expressed on NK cells and may initiate the immuneattack mediated by NK cells [14, 15]. NKG2D which recognizes several stress-induced ligands expressed by cancerous and virally infected cells were essential for enhancing NK cytotoxicity. [16]
On the other hand, NK cells also expressed several inhibitory receptors that upon activation may suppress their cytotoxic function. CD94, like CD69, a type II membrane protein related to the C-type lectin superfamily. It is covalently associated with the NKG2 family and regulating NK cell function by inhibiting cytotoxicity and promote survival [17]. NKAT-2, with two immunoglobulin domains and a long cytoplasmic tail, belongs to KIR2DL3, and is specific to HLA-C molecule [18]. NKG2A, a highly homologous lectin-like NK cell receptor that form heterodimers with the CD94 molecule, contains immunoreceptor tyrosine-based inhibition motif, is generally consider inhibitory [19]. CD158a (KIR2DL1), a specific receptor for the HLA-C group1 (HLA-Cw2,4,5,and 6) and CD158b (KIR2DL2/L3, KIR2DS2) for the HLA-C group 2 (HLA-Cw1,3,7,and 8), also inhibit target cell lysis by NK cells [20]. CD94, CD158a and CD158b expression were increased on endometrial NK cells from infertile women [21]. CD158k (KIR3DL2), belonging to the family of killer cell immunoglobulin-like receptors (KIR), binds specifically to the HLA-A3 and HLA-A11. CD158k ligation on NK cells inhibits IFNγ and cytotoxic function [22].
Interleukin(IL)-15 is a common gamma-chain signaling cytokine that plays an important role in NK differentiation and survival [23, 24]. Patients with SLE have increased serum levels of IL-15, regardless of disease state [25, 26]. Under the influence of IL-15, the circulating NK cells may be in an activated state in SLE patients.
In the present study, we examined the NK cytotoxic function of SLE patients and explored the expression of various NK receptors on NK cells from SLE patients with different disease activity and their response to IL-15. We also sought to examine the effect of IL-15 on the expression of these NK receptors on CD56dim and CD56bright NK cells from peripheral blood of SLE patients and healthy controls.
Materials and methods
Study subject
This study protocols were reviewed and approved by the institutional review board of the institutional of review board of Chang Gung Memory Hospital (Institutional of Review Board No. 102-3935A3 and 102-5508A3).The patient characteristics are summarized in Table 1. We recruited 88 SLE patients with written inform consent from the Out-Patient Clinic of the Division of Rheumatology and Immunology, Department of Internal Medicine, and from Division of Asthma,Allergy and Rheumatology, Department of Pediatrics, Chang Gung Memorial Hospital between January 2014 and June 2016. We also obtained written informed consent from the parents or guardians of the participants under 18 years of age. The diagnosis of SLE fulfills the 1997 American College of Rheumatology classification criteria [27].
Table 1. Characteristics of controls and patients with SLE.
| Characteristics | Normal (N = 26) | SLE patients | |
|---|---|---|---|
| Inactive (N = 39) | Active (N = 49) | ||
| Sex (Male/Female) | 0/26 | 4/35 | 4/45 |
| Age | 29.7±0.8 | 34.6±2.2 | 30.3±1.7 |
| SLEDAI (Median and Range) | NA | 2 (0–5) | 8 (6–25) |
| C3, Median (Range, mg/dL) | NA | 67.4 (34.8–106) | 61.2 (19.3–97.3) |
| C4, Median (Range, mg/dL) | NA | 8.1 (0–32.9) | 8.6 (1.72–21.1) |
| Anti-dsDNA+ (Mean±SEM, WHOunit/ml) | NA | 300.5±32.7 | 354.1±26.1† |
| Nephritis | NA | 17.9% | 41.7% |
| Taking regular corticosteroids | NA | 90.9% | 88.9% |
| Drug (Mean±SEM, mg/day) | NA | 10.4±1.2 mg/day | 14.3±1.4 mg/day |
| CD56+CD3- NK cells (%) | 8.5±0.8% | 7.0±1.1%* | 5.9±0.6%** |
* p<0.05
** p<0.01, SLE patients (Inactive or Active) compare with normal.
†p<0.05, Inactive SLE patients compare with Active SLE patient.
Disease activity was assessed using the SLE Disease Activity Index (SLEDAI) [28], and a score ≥6 defined active disease. According to the cutoff value, 39 patients had inactive SLE while 49 patients had active SLE. Their medication history was carefully recorded and all patients were provided informed consent after approval of the Hospital Ethics Committees. There were no symptoms and signs suggesting infection at the time of blood drawing.
PBMC incubation
Mononuclear cells (MNCs) were obtained from SLE patients and healthy adult volunteers according to the guidelines of the Human Subjects Protection Committee of the Chang Gung Memorial Hospital and the informed consents obtained from all of the donors. Peripheral blood is collected in sterile tubes containing heparin (20 units/ml of blood) and was processed within 24 hours of collection. MNCs are then separated from heparinized blood using Ficoll-Hypaque density gradient centrifugation. PBMCs were then incubated in RPMI-1640, 10% fetal calf serum in the presence or absence of IL-15 (10ng/ml, Peprotech, Rocky Hill, USA) for eighteen hours.
NK cytotoxicity assays
Flow cytometric NK cytotoxicity assays were performed as previously described [29]. Briefly, unstimulated or IL-15 treated MNCs (Effectors) and K562 cells (targets, an erythromyelocytic leukemia cell line) were added in duplicate to 12x75 mm round bottom polystyrene tubes at E:T ratios of 12.5:1 and 25:1. Control tubes including only target or effector cells assayed to determine the spontaneous cell death. Tubes were mixed by gently tapping, centrifuged at 200x g for 1 min and incubated at 37°C in 5% CO2 for 4 hours. After the incubation, 10μl of CD45-FITC (fluorescein isothiocyanate) (BD Bioscience) were added to each tube. The tubes were then mixed gently and incubated for 20 min on ice. Twenty μls of propidium iodide (PI, Sigma Chemical CO., St. Louis, MO, USA) at 1μg/ml were added to each tube 10–15 min before acquisition. After 4 hours of incubation, percentages of dead K562 cells are calculated from histograms showing fluorescent intensity of PI uptake of K562 cells after subtraction of background cell death.
Flow cytometric analysis of NK markers
PBMCs were washed in cold PBS with 2% FCS and 0.1% sodium azide and then stained with fluorescein isothiocyanate (FITC)-, R-phycoerythrin (PE) or Allophycocyanin (APC)-conjugated mouse anti-human monoclonal antibodies including anti-CD3/CD16+CD56 (FITC/APC), CD69, CD94, NKAT-2, NKG2D, NKp46, NKp30, NKG2A,CD158a, CD158b, and CD158k (PE) (BD Biosciences) from Becton-Dickinson (Worldwide Inc., Taiwan Branch, Taiwan) for flow cytometric analysis.
The fluorescent staining was analyzed on a FACS Calibur (BD Biosciences) flow cytometer. Electronic gates were set to enable analysis of the fluorescence of the viable cell population according to FSC/SSC histograms following anti-CD3/ CD16+CD56 staining. The percentage of cells stained with each monoclonal antibody was determined by comparing each histogram with one from control cells stained with FITC-, PE or APC-labeled isotype control monoclonal antibodies. The lymphocyte population was gated first to identify CD3-positive and CD3-negative lymphocyte populations for the subsequent analysis of the expression patterns of CD56. According to the mean fluorescence intensity of CD56, CD56+CD3+ NK cells were further divided by fluorescent intensity of CD56 staining in to 2 groups: CD56dim (more than 80%) NK cells and CD56bright NK cells.
Cytokine assays
Serum levels of IL-15 were quantified by enzyme-linked immunosorbent assay (ELISA) (Quantikine, R & D Systems, Minneapolis, MN, USA) according to the manufacturer's instructions. The lower limit of detection of this assay was 3.9 pg/ml.
Statistical analysis
The Wilcoxon signed rank test was applied for analysis of the difference of responses before and after IL-15 treatment. SLE patient and healthy control data were compared between groups using the non-parametrical Mann–Whitney U-test. (calculated by SPSS 17.0 software). The data are presented as means ± standard error of mean (SEM). Groups being compared were considered significantly different if p value was less than 0.05.
Results
Patient characteristics and percentages of NK cells in active and inactive disease
The characteristics of the SLE patient population are shown in Table 1. Patients were predominantly female, age between 15–68 years old and had an average disease duration of 7.8±0.6 years. SLE patient with active disease tend to have more renal involvement, lower C3, C4, and high ds-DNA. SLE patient had decreased percentages of CD56+CD3− NK cells (p = 0.007), more so when disease activity is high.(patients with active disease vs. patients with inactive disease, p = 0.045)
Serum IL-15 is elevated in SLE patients
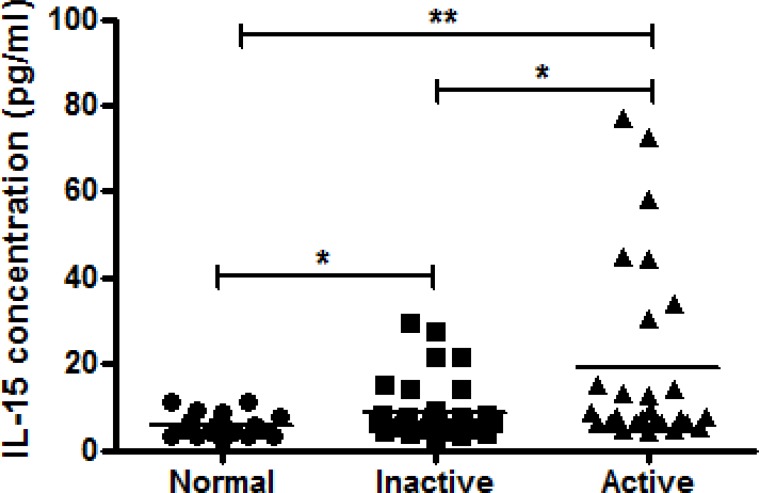
An increased level of IL-15 was detected in sera from active and inactive patients compared with healthy controls (Fig 1). Although no significant correlation was found between disease activity and IL-15 serum levels (r = 0.004, P = 0.649). SLE patients with active disease show higher IL-15 serum levels compared to inactive patients (19.4±4.1 pg/ml vs. 8.6±1.0 pg/ml, p = 0.019)
Fig 1. Comparison of serum levels of IL-15 determined by ELISA in samples from healthy controls (n = 18) and inactive (n = 41) and active (n = 27) SLE patients using scattergram (transverse lines indicate means).
* p<0.05/**p<0.01, by Mann–Whitney U-test. (calculated by SPSS 17.0 software).
Effect of IL-15 on NK cytotoxicity against K562 cells
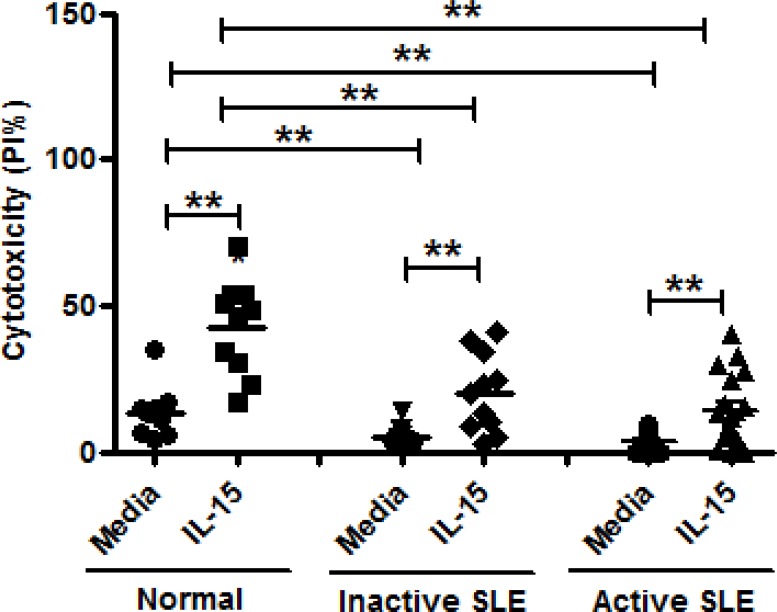
Fig 2 shows the NK cytotoxicity of MNCs from SLE and healthy controls against K562 cells under the influence of IL-15. NK cytotoxicity of SLE patients with inactive disease and SLE patients with active disease was deficient compared to controls at E:T = 25:1 (inactive SLE, 5.1±1.2% vs. 13.6±2.7%, p = 0.005, and active SLE 3.8±0.8% vs. 13.6±2.7%, p = <0.001). IL-15 increased NK cytotoxicity of active SLE patients and inactive SLE, but to a lesser extent compared to IL-15-treated controls (inactive SLE, 20.1±4.0% vs. 5.1±1.2%, p = 0.003, and active SLE 13.8±2.9% vs. 3.8±0.8%, p<0.001). NK cell cytotoxicity in patients with active SLE was not different from those in patients with inactive SLE (P = 0.416)
Fig 2. Effect of interleukin (IL)-15 on NK cytotoxicity of mononuclear cells from inactive SLE patients (n = 11), active SLE patients (n = 18) and healthy controls (n = 10).
Cytotoxicity was measured by percentage of dead K562 cells expressing PI using effector: target(E:T) ratio of 25:1 **p<0.01, The Wilcoxon signed rank test was applied for analysis of the difference of responses before and after IL-15 treatment. SLE patient and healthy control data were compared between groups using the Mann–Whitney U-test. (calculated by SPSS 17.0 software).
Effect of IL-15 on CD69 expression on NK cells
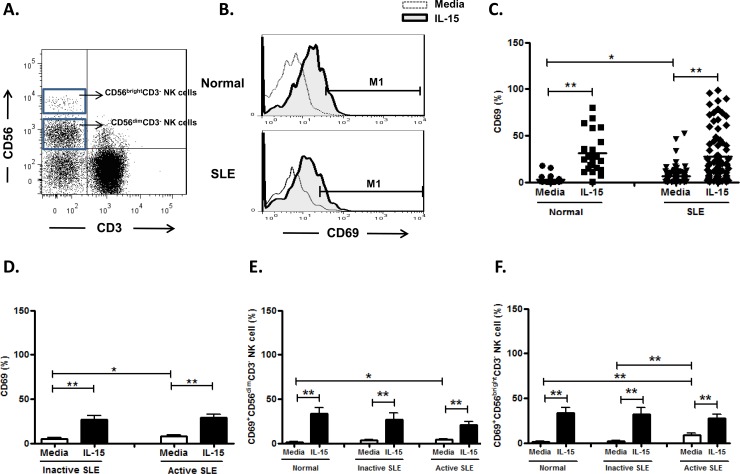
NK cells from SLE patients expressed higher CD69 compared to controls (6.5±1.0%vs. 3.0±0.9%, p = 0.031). (Fig 3B and Fig 3C) We observed a higher frequency of CD69 expressing NK cells in active disease compared to those with inactive disease (7.8±1.6% vs. 5.0±1.1%, p = 0.049) (Fig 3D). IL-15 enhanced CD69 expression on NK cells of patients with inactive disease (26.5±4.7% vs. 5.0±1.1%, p<0.001), as well as patients in active SLE disease (28.7±4.4% vs. 7.8±1.6%, p<0.001). SLE with active disease had higher CD69 expression on CD56bright NK cells compared to those with inactive disease (8.7±2.4% vs. 2.2±0.8, p = 0.004). However, their response to IL-15 did not differ (Fig 3E and 3F).
Fig 3. Effect of interleukin (IL)-15 on CD69 expression of CD56+CD3- NK cells from SLE patients and healthy controls.
A. Gating of CD56birght and CD56dim CD3- NK cells by flow cytometry. B representative profile of Representative histograms of SLE patients (SLE) and controls (Normal); C. Comparison between SLE patients as a whole and normal controls (Normal) using scattergram (transverse lines indicate means); D. Comparison between SLE patients with active disease and inactive disease; E. Comparison of CD69 expression on CD56dim NK subsets in SLE patients with different severity as well as normal controls; F. Comparison of CD69 expression on CD56bright NK subsets in SLE patients with different severity as well as normal controls. PBMC were stimulated with or without IL-15 (10ng/ml) for 18hrs For D,E,F, data was expressed as mean percent expression (%) ± S.E.M. (Normal, n = 25; SLE, total n = 84, SLE with active disease, n = 44, SLE with inactive disease, n = 40) * p<0.05, ** p<0.01, The Wilcoxon signed rank test was applied for analysis of the difference of responses before and after IL-15 treatment. SLE patient and healthy control data were compared between groups using the Mann–Whitney U-test. (calculated by SPSS 17.0 software).
Effect of IL-15 on CD94 expression on NK cells
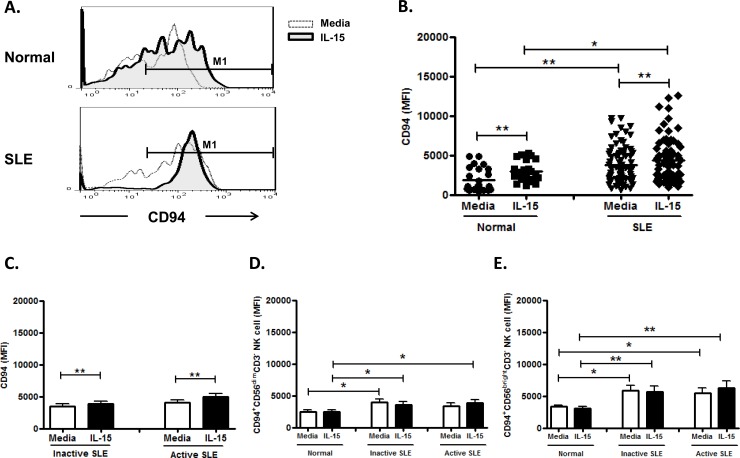
As nearly all NK cells expressed CD94, we use the mean fluorescence intensity (MFI) to measure CD94 expression. As shown in Fig 4A and Fig 4B, the CD94 expression on NK cells from SLE disease was higher than controls (3808.6±258.5 vs. 1860.8±304.5, p<0.001). However, there was no significant difference in CD94 MFI between SLE with active and inactive disease (4110.1±386.3 vs. 3507.1±341.8, p = 0.224) (Fig 4C). IL-15 enhanced CD94 expression on NK cells from controls (2949.9±269.7 vs. 1860.8±304.5, p = 0.001), inactive SLE disease (3882.0±413.6 vs. 3507.1±341.8, p = 0.003), and active SLE disease (4921.1±513.3 vs. 4110.1±386.3, p = 0.001), respectively. CD94 expression was higher in CD56bright NK cells than in CD56dim NK cells (controls, 3341.3±244.4 vs. 2505.2±235.7, p = 0.005; inactive SLE, 5866.0±764.4 vs. 4006.5±463.2, p = 0.099; cctive SLE, 5481.3±795.2 vs. 3327.9±499.4, p = 0.033) (Fig 4D and Fig 4E).
Fig 4. Effect of interleukin (IL)-15 on CD94 expression of CD56+CD3- NK cells from SLE patients and healthy controls.
A. Representative histograms of SLE patients (SLE) and controls (Normal) B.Comparison between SLE patients as a whole and normal controls (Normal) using scattergrams (transverse lines indicate means) C. Comparison between SLE patients with active disease and inactive disease; D. Comparison of CD94 expression on CD56dim NK subsets in SLE patients with different severity as well as normal controls; E. Comparison of CD94 expression on CD56bright NK subsets in SLE patients with different severity as well as normal controls. PBMC were stimulated with or without IL-15 (10ng/ml) for 18hrs. For C,D,E, data was expressed as mean percent expression (%) ± S.E.M. (Normal, n = 25; SLE, total n = 80, SLE with active disease, n = 40, SLE with inactive disease, n = 40) * p<0.05, ** p<0.01, The Wilcoxon signed rank test was applied for analysis of the difference of responses before and after IL-15 treatment. SLE patient and healthy control data were compared between groups using the Mann–Whitney U-test. (calculated by SPSS 17.0 software).
Effect of IL-15 on NKG2A expression on NK cells
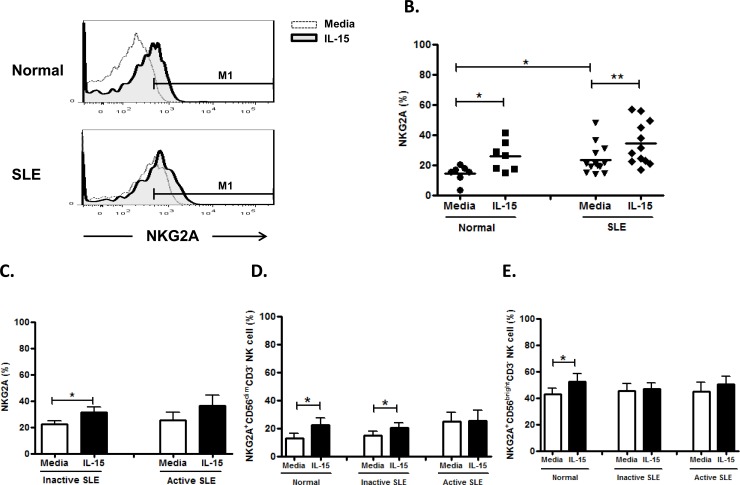
As shown in Fig 5A and Fig 5B, the NKG2A expression on NK cells from SLE patients was higher than controls. (23.5±2.7% vs. 14.5±2.1%, p = 0.029). However, there was no significant difference in the NKG2A expression between SLE patients with active and inactive disease (25.5±6.0% vs. 22.2±2.7%, p = 0.942) (Fig 5C). IL-15 enhanced NKG2A expression on NK cells from controls (25.8±3.7% vs. 14.5±2.1%, p = 0.028), inactive SLE disease (31.2±4.1% vs. 22.2±2.7%, p = 0.025), but not active SLE disease (36.1±8.3% vs. 25.5±6.0%, p = 0.225). NKG2A expression was higher in CD56bright NK cells than in CD56dim NK cells (controls, 42.7±4.6% vs. 12.9±3.5%, p = 0.001; inactive SLE, 45.1±5.6% vs. 14.9±2.8%, p = 0.001; active SLE, 45.0±6.9% vs. 24.6±6.5%, p = 0.048) (Fig 5D and Fig 5E).
Fig 5. Effect of interleukin(IL)-15 on NKG2A expression of CD56+CD3- NK cells from SLE patients and healthy controls.
A. Representative histograms of SLE patients (SLE) and controls (Normal) B.Comparison between SLE patients as a whole and normal controls (Normal) using scattergrams (transverse lines indicate means); C. Comparison between SLE patients with active disease and inactive disease; D. Comparison of NKG2A expression on CD56dim NK subsets in SLE patients with different severity as well as normal controls; E. Comparison of NKG2A expression on CD56bright NK subsets in SLE patients with different severity as well as normal controls. PBMC were stimulated with or without IL-15 (10ng/ml) for 18hrs. For C,D,E, data was expressed as mean percent expression (%) ± S.E.M. (Normal, n = 7; SLE, total n = 13, SLE with active disease, n = 5, SLE with inactive disease, n = 8) * p<0.05, ** p<0.01, The Wilcoxon signed rank test was applied for analysis of the difference of responses before and after IL-15 treatment. SLE patient and healthy control data were compared between groups using the Mann–Whitney U-test. (calculated by SPSS 17.0 software).
Effect of IL-15 on NKp30 expression on NK cells
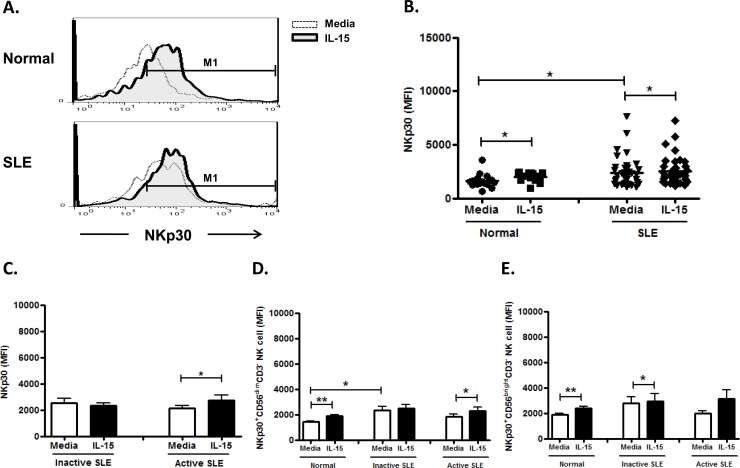
As the majority of NK cells expressed NKp30, we use the mean fluorescence intensity (MFI) to measure the level of marker expression. NKp30 expression on NK cells from SLE patient was higher than controls (2358.5±226.0 vs. 1618.3±163.1, p = 0.041) (Fig 6A and Fig 6B), but seemed unrelated to disease activity (Fig 6C). IL-15 enhance the NKp30 expression on control NK cells (2009.1±104.8 MFI vs. 1618.3±163.1 MFI, p = 0.030) and NK cell from active SLE disease (2734.8±379.2 MFI vs. 2151.0±202.4 MFI, p = 0.030), but failed to enhance that NK cells from inactive SLE diseases (2339.9±211.2 vs. 2509.5±362.8, p = 0.212). There was no significant difference with regards to NKp30 expression between CD56 bright NK cells and CD56dim subsets. (Fig 6D and Fig 6E)
Fig 6. Effect of interleukin(IL)-15 on NKp30 expression of CD56+CD3- NK cells from SLE patients and healthy control.
A. Representative histograms of SLE patients (SLE) and controls(Normal); B. Comparison between SLE patients as a whole and controls (Normal) using scattergrams (transverse lines indicate means); C. Comparison between SLE patients with active disease and inactive disease; D. Comparison of NKp30 expression on CD56dim NK subsets in SLE patients with different severity as well as normal controls; E. Comparison of NKp30 expression on CD56bright NK subsets in SLE patients with different severity as well as normal controls. PBMC were stimulated with or without IL-15 (10ng/ml) for 18hrs For C,D,E, data was expressed as mean percent expression (%) ± S.E.M. (Normal, n = 16; SLE, total n = 41, SLE with active disease, n = 18, SLE with inactive disease, n = 23) * p<0.05, ** p<0.01, The Wilcoxon signed rank test was applied for analysis of the difference of responses before and after IL-15 treatment. SLE patient and healthy control data were compared between groups using the Mann–Whitney U-test. (calculated by SPSS 17.0 software).
Effect of IL-15 on NKp46 expression on NK cells
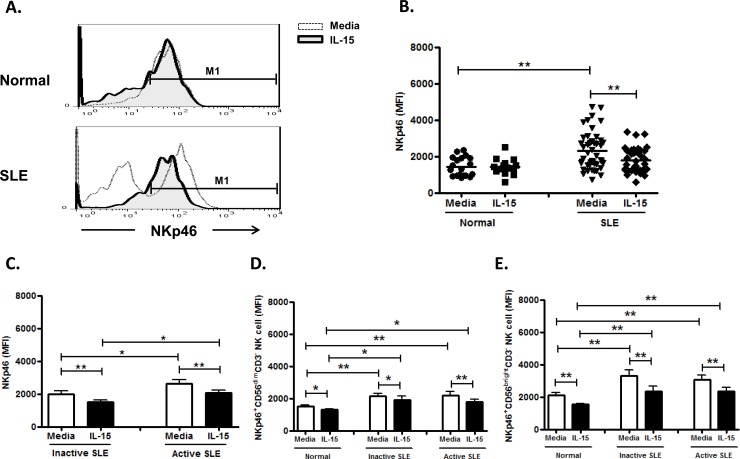
As shown in Fig 7A, In contrast to single peak expression of NKp46 on control NK cells, the majority of SLE patients (n = 46) had a bimodal distribution of NKp46 expression on their NK cells, namely, NKp46+ and NKp46- subsets. Only 9 patients with inactive SLE disease showed single peak NKp46 expression as observed in controls.
Fig 7. Effect of interleukin (IL)-15 on NKp46 expression of CD56+CD3- NK cells from SLE patients and healthy control.
A. Representative histograms of SLE patients (SLE) and controls(Normal); B. Comparison between SLE patients as a whole and controls (Normal) using scattergrams (transverse lines indicate means); C. Comparison between SLE patients with active disease and inactive disease; D. Comparison of NKp46 expression on CD56dim NK subsets in SLE patients with different severity as well as normal controls; E. Comparison of NKp46 expression on CD56bright NK subsets in SLE patients with different severity as well as normal controls. PBMC were stimulated with or without IL-15 (10ng/ml) for 18hrs For C,D,E, data was expressed as mean percent expression (%) ± S.E.M. (Normal, n = 19; SLE, total n = 47, SLE with active disease, n = 23, SLE with inactive disease, n = 24) * p<0.05, ** p<0.01, The Wilcoxon signed rank test was applied for analysis of the difference of responses before and after IL-15 treatment. SLE patient and healthy control data were compared between groups using the Mann–Whitney U-test. (calculated by SPSS 17.0 software).
Using MFI gating on NKp46+ population, NK cells from SLE patients expressed higher NKp46 compared to healthy controls (2309.0±149.7 vs. 1440.0±119.4, p = 0.001) (Fig 7B). The SLE patients with active disease have higher NKp46 expression on their NK cells compared to those with inactive disease (2639.3±212.6 MFI vs. 2006.3±194.8 MFI, p = 0.045) (Fig 7C). IL-15, in contrast to NKp30, down-regulate the NKp46 expression in SLE patients (1785.3±105.1 MFI vs. 2309.0±149.7 MFI, p<0.001) as well as controls (1426.8±106.9 MFI vs. 1440.0±119.4 MFI, p = 0.717). As shown in Fig 7D and 7E, NKp46 expression were much higher on CD56 bright NK subsets, compared to that on CD56dim subsets, in controls and SLE patient s alike (controls: 2124.1±142.8 vs. 1517.3±65.0, p = 0.001; inactive SLE: 3290.9±362.7 vs. 2154.1±170.9, p = 0.024; active SLE: 3058.0±270.9 vs. 2190.4±217.2, p = 0.039).
Effect of IL-15 on NKG2D expression on NK cells
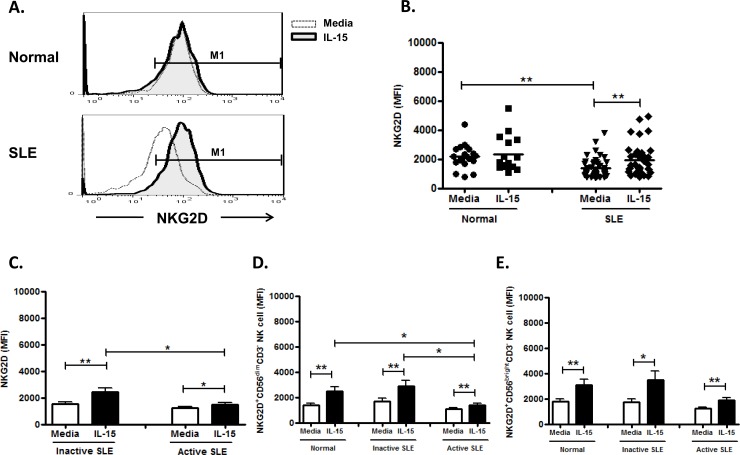
NK cells from SLE patients expressed decreased NKG2D compared to healthy controls (1361.8±98.1 vs. 2192.0±180.5, p<0.001) (Fig 8A and Fig 7B). No difference of NKG2D expression on NK cells were found between active and inactive SLE diseases (1237.7±111.1 vs. 1509.5±166.7 MFI, p = 0.275) (Fig 8C). IL-15 enhanced the NKG2D expression of NK cell in SLE patients (1921.9±178.9 MFI vs. 1361.8±98.1 MFI, p<0.001), but not controls (2317.1±305.4 MFI vs. 2192.0±180.5 MFI, p = 0.959). As shown in Fig 8D and Fig 8E, NKG2D were comparably expressed on CD56 bright and CD56dim populations.
Fig 8. Effect of interleukin (IL)-15 on NKG2D expression of CD56+CD3- NK cells from SLE patients and healthy control.
A. Representative histograms of SLE patients (SLE) and controls(Normal);B Comparison between SLE patients as a whole and controls (Normal) using scattergrams (transverse lines indicate means); C. Comparison between SLE patients with active disease and inactive disease; D. Comparison of NKG2D expression on CD56dim NK subsets in SLE patients with different severity as well as normal controls; E. Comparison of NKG2D expression on CD56bright NK subsets in SLE patients with different severity as well as normal controls. PBMC were stimulated with or without IL-15 (10ng/ml) for 18hrs For C,D,E, data was expressed as mean percent expression (%) ± S.E.M. (Normal, n = 20; SLE, total n = 46, SLE with active disease, n = 25, SLE with inactive disease, n = 21) * p<0.05, ** p<0.01. The Wilcoxon signed rank test was applied for analysis of the difference of responses before and after IL-15 treatment. SLE patient and healthy control data were compared between groups using the Mann–Whitney U-test. (calculated by SPSS 17.0 software).
Effect of IL-15 on NKAT-2, CD158a, CD158b, CD158k expression on NK cells
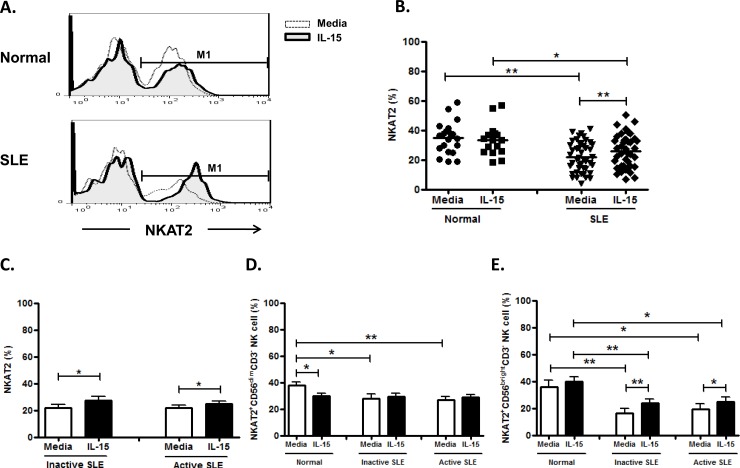
As shown in Fig 9A, NK cells can be separated into NKAT-2+ and NKAT-2- population in both SLE and controls. Overall speaking, NK cells from SLE patients expressed decreased NKAT-2 compared to healthy controls (22.0±1.5% vs. 34.1±2.5%, p<0.001). IL-15 enhanced NKAT-2 expression on NK cells from SLE patients (25.8±1.8% vs. 22.0±1.5%, p = 0.001) but had no effect on NKAT-2 expression on control NK cells (33.5±2.7% vs. 34.1±2.5%, p = 0.155) (Fig 9A and 9B). NKAT-2 did not differ between active and inactive diseases of SLE (22.0±1.8% vs. 22.0±2.6%, p = 0.982) (Fig 9C). NKAT-2 on CD56bright NK subsets seemed to be more responsive to IL-15 stimulation compared to CD56dim NK subsets.(Fig 9D and Fig 9E)
Fig 9. Effect of interleukin(IL)-15 on NKAT2 expression of CD56+CD3- NK cells from SLE and healthy control.
A. Representative histograms of SLE patients (SLE) and controls(Normal) B.Comparison between SLE patients as a whole and controls (Normal) using scattergrams (transverse lines indicate means); C. Comparison between SLE patients with active disease and inactive disease; D. Comparison of NKAT2 expression on CD56dim NK subsets in SLE patients with different severity as well as normal controls; E. Comparison of NKAT2 expression on CD56bright NK subsets in SLE patients with different severity as well as normal controls. PBMC were stimulated with or without IL-15 (10ng/ml) for 18hrs. For C,D,E, data was expressed as mean percent expression (%) ± S.E.M. (Normal, n = 19; SLE, total n = 46, SLE with active disease, n = 27, SLE with inactive disease, n = 18) * p<0.05, ** p<0.01. The Wilcoxon signed rank test was applied for analysis of the difference of responses before and after IL-15 treatment. SLE patient and healthy control data were compared between groups using the Mann–Whitney U-test. (calculated by SPSS 17.0 software).
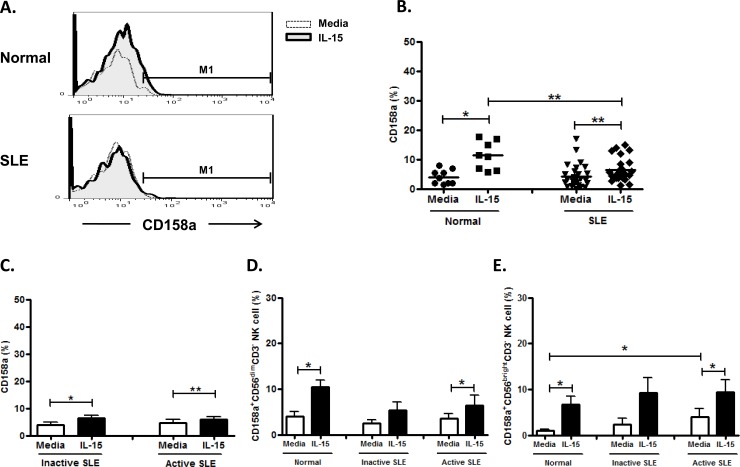
CD158a expression was comparable in SLE patient and controls (4.3±0.7% vs. 4.0±1.0%, p = 0.804) (Fig 10A and Fig 10B). IL-15 enhanced CD158a expression in SLE patient (6.5±0.8% vs. 4.3±0.7%, p<0.001) as well as controls (11.3±1.7% vs. 4.0±0.8%, p = 0.012). However, CD158a did not differ between active and inactive diseases of SLE (4.6±1.2% vs. 3.7±1.0%, p = 0.352) (Fig 10C). Comparable expression of CD158a was expressed on CD56dim and CD56bright NK subsets. (Fig 10D and Fig 10E)
Fig 10. Effect of interleukin(IL)-15 on CD158a expression of CD56+CD3- NK cells from SLE patients and healthy control.
A. Representative histograms of SLE patients (SLE) and controls(Normal);B Comparison between SLE patients as a whole and controls (Normal) using scattergrams (transverse lines indicate means); C. Comparison between SLE patients with active disease and inactive disease; D. Comparison of CD158a expression on CD56dim NK subsets in SLE patients with different severity as well as normal controls; E. Comparison of CD158a expression on CD56bright NK subsets in SLE patients with different severity as well as normal controls. PBMC were stimulated with or without IL-15 (10ng/ml) for 18hrs. For C,D,E, data was expressed as mean percent expression (%) ± S.E.M. (Normal, n = 9; SLE, total n = 28, SLE with active disease, n = 11, SLE with inactive disease, n = 17) * p<0.05, ** p<0.01.The Wilcoxon signed rank test was applied for analysis of the difference of responses before and after IL-15 treatment. SLE patient and healthy control data were compared between groups using the Mann–Whitney U-test. (calculated by SPSS 17.0 software).
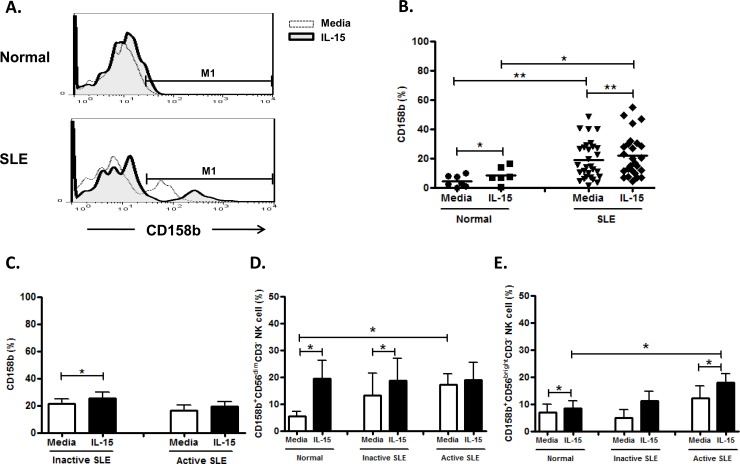
Distinct from controls, NK cells from SLE can be separated into CD158b+ and CD158b- subsets (Fig 11A). NK cells from SLE patients expressed increased CD158b compared to controls (19.2±2.4% vs. 4.4±1.6%, p = 0.002). (Fig 11A and Fig 11B) CD158b on NK cells from SLE and controls was enhanced with IL-15 (SLE, 22.5±2.9% vs. 19.2±2.4%, p = 0.003; Controls, 8.5±2.4% vs. 4.4±1.5%, p = 0.028) (Fig 11A). However, CD158b expression was unrelated to SLE disease activity (Fig 11C). CD158b expression was much higher on CD56dim NK subsets, compared to that on CD56brigh subsets in SLE patients (Fig 11D and Fig 11E).
Fig 11. Effect of interleukin(IL)-15 on CD158b expression of CD56+CD3- NK cells from SLE patients and healthy control.
A. Representative histograms of SLE patients (SLE) and controls(Normal); B. Comparison between SLE patients as a whole and controls (Normal) using scattergrams (transverse lines indicate means); C. Comparison between SLE patients with active disease and inactive disease; D. Comparison of CD158b expression on CD56dim NK subsets in SLE patients with different severity as well as normal controls; E. Comparison of CD158b expression on CD56bright NK subsets in SLE patients with different severity as well as normal controls. PBMC were stimulated with or without IL-15 (10ng/ml) for 18hrs For C,D,E, data was expressed as mean percent expression (%) ± S.E.M. (Normal, n = 7; SLE, total n = 28, SLE with active disease, n = 13, SLE with inactive disease, n = 15) * p<0.05, ** p<0.01, The Wilcoxon signed rank test was applied for analysis of the difference of responses before and after IL-15 treatment. SLE patient and healthy control data were compared between groups using the Mann–Whitney U-test. (calculated by SPSS 17.0 software).
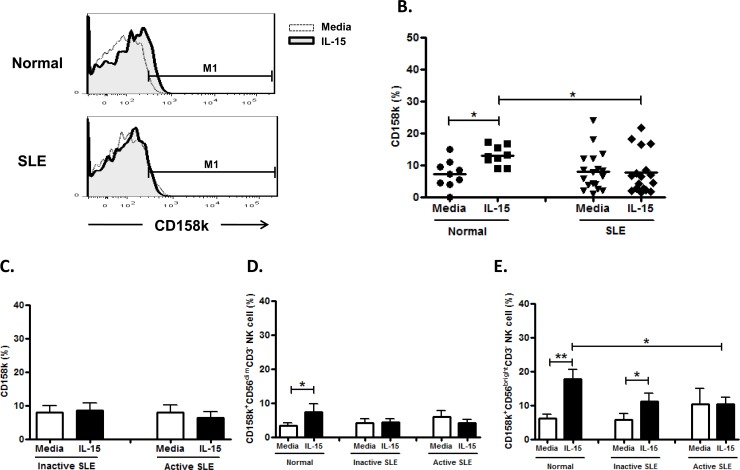
NK cells from SLE patients expressed CD158k comparably to healthy controls (7.9±1.4% vs. 7.2±1.5%, p = 0.979). (Fig 12A and Fig 12B). CD158k on NK cells from healthy controls was enhanced with IL-15 (13.0±1.0% vs. 7.2±1.5%, p = 0.021), but not in SLE patients (7.6±1.6% vs. 7.9±1.4%, p = 0.723). However, CD158k was unrelated to disease activity (Fig 12C). CD158k expression on CD56 bright NK subsets were higher than that on CD56dim subsets in SLE patients (Fig 12D and Fig 12E).
Fig 12. Effect of interleukin(IL)-15 on CD158k expression of CD56+CD3- NK cells from SLE patients and healthy control.
A. Representative histograms of SLE patients (SLE) and controls(Normal); B. Comparison between SLE patients as a whole and controls (Normal) using scattergrams (transverse lines indicate means); C. Comparison between SLE patients with active disease and inactive disease; D. Comparison of CD158k expression on CD56dim NK subsets in SLE patients with different severity as well as normal controls; E. Comparison of CD158k expression on CD56bright NK subsets in SLE patients with different severity as well as normal controls. PBMC were stimulated with or without IL-15 (10ng/ml) for 18hrs For C,D,E, data was expressed as mean percent expression (%) ± S.E.M. (Normal, n = 9; SLE, total n = 18, SLE with active disease, n = 7, SLE with inactive disease, n = 11)* p<0.05, ** p<0.01, The Wilcoxon signed rank test was applied for analysis of the difference of responses before and after IL-15 treatment. SLE patient and healthy control data were compared between groups using the Mann–Whitney U-test. (calculated by SPSS 17.0 software).
Discussion
The role of NK cells in the development of human SLE remained poorly understood. In the present study, we sought to examine the NK cytotoxicity, expression of activating NCR and inhibitory NKR on NK cells from SLE patients and determine their response to exogenous IL-15.
We observed higher serum IL-15 levels in SLE patients compared to controls. Patients with active SLE disease have higher IL-15 levels than those with inactive disease. Our finding is consistent with Zhu et al who recently showed that the serum level of IL-15 was significantly elevated in SLE patients and correlated with their mRNA expression [30]. The upregulation of IL-15 may be regulated by hypomethylated CpG in the promoter region of the gene. Overexpression of IL-15 correlated with the development of murine lupus [31]. Circulating NK cells in SLE may be preactivated by IL-15. However, the percentages of NK cells are decreased in PBMC from SLE patients compared to controls.
We found that NK cytotoxicity of SLE patients was decreased compared to controls, consistent with previous studies.[7,8,10] NK cytotoxicity of SLE patients was enhanced by IL-15 to a lesser degree compared to controls. NK cell cytotoxicity against K562 cells, mediated by NK cells, is a complex and dynamic process requiring several different signals, including adhesion, activation, and degranulation. A IL-15 signaling defect may exist in SLE NK cells.
We found that NK cells, especially the CD56bright subsets, from SLE patients expressed greater CD69, which correlated with disease activity. We found that IL-15 enhanced CD69 expression on NK cells from SLE patients regardless of disease activity, in discrepancy with Baranda et al who reported diminished CD69 response of NK cells to IL-15 [27]. Thus, CD69 expression on NK cells may serve as a disease activity indicator. IL-15 is considered disease-promoting it further enhanced CD69 expression in SLE patients.
CD94 is a C-type lectin required for the dimerization of the CD94/NKG2 family of receptors, which are expressed on NK cells and T cell subsets. We found CD94 expression is increased in SLE NK cells, in contrast to Schepis et al who reported no difference [9]. IL-15 enhanced CD94 expression of NK cells from both SLE and controls, consistent with Bo et al [31]. We found a higher CD94 expression on CD56bright subsets compared to CD56dim NK cells, suggesting their regulatory role. IL-15 may aggravate SLE activity due to its CD94 enhancing effect.
In agreement with previous studies [10,32], we found that NKG2A was over-expressed in NK cells from SLE patients compared to controls. We demonstrated that IL-15 could further enhanced NKG2A expression on SLE NK cells. We also showed that NKG2A expression is higher in CD56brigth NK subsets than CD56dim NK subsets. Again, it seemed that IL-15 is detrimental in SLE patients, as it aggravate the aberrant NKG2A expression.
NKp30 is considered a surrogate marker of NK cell functions in humans [33] that regulates the DC/NK cell cross-talk, and mediates the release of Th1 cytokines [34]. NK cells may promote an NKp30-dependent inflammatory state in salivary glands of patients with primary Sjogren’s syndrome [35]. We observed that NK cells from SLE patient expressed higher NKp30 compared to controls, in contrast to Puxeddu at et al who reported no difference of NK p30 expression between SLE patients and controls [36]. IL-15 enhanced NKp30 expression on NK cells from SLE as well as controls, consistent with previous studies [37,38].
NKp46 activates NK cells by interaction with an, as yet, unknown structure on target cells resulting in increased cytokine production and release of cytolytic granules [39]. NKp46 can also confer tumor cell recognition by NK cells and can specifically bind viral hemagglutinins, suggesting its role in antitumor and antiviral immunity [40, 41]. Interestingly, we found that NK cells from the majority of SLE patient have unique NKp46- subsets not found in controls. (Fig 5A) NK cells from SLE patient expressed higher NKp46 compared to controls, consistent with Schepis etal [9]. Distinct from the response of controls, IL-15 down-regulated NKp46 expression of NK cells from SLE patients, probably due to the prior activation by high serum IL-15 in SLE patients. We did not find any difference of expression of NKp30 and NKp46 between SLE patients with inactive disease and active disease.
Dai et al showed that increased frequencies of NKG2D+CD4+ T cells are inversely correlated with disease activity in juvenile-onset SLE [42]. We found that NKG2D, another NK-activating receptors in SLE activated by NKG2D ligands, was under-expressed on circulating NK cells from SLE, consistent with previous reports [30,32]. We further found that NKG2D on CD56dim NK cells is lower in SLE with active disease compared to inactive disease. Spada et al reported that NKG2D ligands overexpression in lupus nephritis kidney but not in the periphery [43], suggesting that NKG2D+NK cells may migrate to the kidney or other target organs. IL-15 enhanced NKG2D expression of NK cells may facilitate migration of NK cells to target organs in SLE.
Hervier et al showed that KIRs under-expression correlated with disease activity in SLE [10]. NKAT2 has been shown to be a inhibitory KIR that is important in early pregnancy to prevent the attack of trophoblastic cells by NK cells [44]. We found a decreased numbers of NKAT-2+ NK cells in SLE patient compared to controls, especially the CD56 bright NK subsets. IL-15 enhanced NKAT-2 expression of CD56 bright NK subsets in SLE patients.
Bai et al showed increased CD158a expression on NK cells from SLE patients [45]. We also observed an increased CD158a expression in CD56brigtht population in SLE compared to controls. A distinct CD158b high NK subset was found in SLE patients, but not in controls.(Fig 10A), which may contribute to the suppressed NK cytotoxicity observed in SLE patients. IL-15 enhances both CD158a and CD158b expression on NK cells from both SLE patients and controls.
NKAT-2 and CD158b seem to recognize the same group of KIR. However, NKAT-2 was deficient and CD158b was enhanced on NK cells from SLE patients compared to controls. According to the manufacturer’s description, NKAT2 (mAb DX27) recognizes KIR2DL3; while CD158b (mAb CHL) recognizes KIR2DL2, KIR2DL3 and KIR2DS2. Thus, The discrepancy of NKAT2 staining results may be due to their narrower KIR epitope. Some point changes affecting mAb epitopes due to KIR polymorphisms may also influence the results.
CD158k is expressed on a minor population of circulating NK cells [46]. It has not been studied in SLE patients. Unlike NK cells from controls, CD158k on NK cells SLE patients failed to be enhanced by IL-15. Our finding again suggest an IL-15 signaling defect in SLE NK cells.
Taken together, SLE patient showed a distinct NCR and iNKR pattern compared to controls. IL-15 had a heterogeneous effect on NK receptor expression. CD69, CD94, NKG2A, NKp30, and CD158b expression on NK cells from SLE patients were higher than corresponding controls, and could be further enhanced by IL-15. On the other hand, IL-15 enhanced NK cytotoxicity, down-regulated NKP46 expression (which was higher in SLE patients), and enhanced NKG2D and NKAT-2 (which were lower in SLE patients) on NK cells from SLE patients. Therefore, IL-15 could have both disease-promoting and ameliorating effect on SLE. In view of the fact that serum IL-15 was elevated in SLE patient and that IL-15 predominantly aggravates the aberrant NKR expression found in SLE, IL-15 antagonist may have therapeutic benefits in SLE patients. Antagonist to IL-15 may provide a therapeutic option for stopping the progression of SLE.
Supporting information
Headings are depicted in 20170920 Support information.xls.
(XLS)
Acknowledgments
This study was supported partially by grants from Ministry of Science and Technology, R.O.C.: MOST103-2314-B-182A-023-MY3 to SJL. It was also supported by Division of Asthma, Allergy, and Rheumatology, Department of Pediatrics, Chang Gung Memory Hospital: CMRPG4D0052, CMRPG3D1933 to SJL. The funders had no role in study design, data collection and analysis, decision to publish, or preparation of the manuscript.
Data Availability
All relevant data are within the paper and its Supporting Information files.
Funding Statement
This study was supported partially by grants from Ministry of Science and Technology, R.O.C.: MOST103-2314-B-182A-023-MY3 to SJL. It was also supported by Division of Asthma, Allergy, and Rheumatology, Department of Pediatrics, Chang Gung Memory Hospital: CMRPG4D0052, CMRPG3D1933 to SJL. The funders had no role in study design, data collection and analysis, decision to publish, or preparation of the manuscript.
References
- 1.Renaudineau Y, Pers JO, Bendaoud B, Jamin C, Youinou P. Dysfunctional B cells in systemic lupus erythematosus. Autoimmun Rev. 2004; 3:516–523. doi: 10.1016/j.autrev.2004.07.035 [DOI] [PubMed] [Google Scholar]
- 2.Miyara M, Amoura Z, Parizot C, Badoual C, Dorgham K, Trad S, et al. Global natural regulatory T cell depletion in active systemic lupus erythematosus. J Immunol 2005; 175:8392–8400. [DOI] [PubMed] [Google Scholar]
- 3.Cooper MA, Fehniger TA, Caligiuri MA. The biology of human natural killer-cell subsets. Trends Immunol 2001; 22:633–640. [DOI] [PubMed] [Google Scholar]
- 4.Cooper MA, Fehniger TA, Turner SC, Chen KS, Ghaheri BA, Ghayur T, et al. Human natural killer cells: a unique innate immunoregulatory role for the CD56 (bright) subset. Blood 2001; 97:3146–3151. [DOI] [PubMed] [Google Scholar]
- 5.Poli A, Michel T, Thérésine M, Andrès E, Hentges F, Zimmer J, et al. CD56 bright natural killer (NK) cells: an important NK cell subset. Immunology 2009; 126:458–465. doi: 10.1111/j.1365-2567.2008.03027.x [DOI] [PMC free article] [PubMed] [Google Scholar]
- 6.Farag SS, Caligiuri MA. Human natural killer cell development and biology. Blood Rev 2006; 20:123–137. doi: 10.1016/j.blre.2005.10.001 [DOI] [PubMed] [Google Scholar]
- 7.Green MR, Kennell AS, Larche MJ, Seifert MH, Isenberg DA, Salaman MR. Natural killer cell activity in families of patients with systemic lupus erythematosus: demonstration of a killing defect in patients. Clin Exp Immunol 2005; 141:165–173. doi: 10.1111/j.1365-2249.2005.02822.x [DOI] [PMC free article] [PubMed] [Google Scholar]
- 8.Yabuhara A, Yang FC, Nakazawa T, Iwasaki Y, Mori T, Koike K, et al. A killing defect of natural killer cells as an underlying immunologic abnormality in childhood systemic lupus erythematosus. J Rheumatol 1996; 23:171–177. [PubMed] [Google Scholar]
- 9.Schepis D, Gunnarsson I, Eloranta ML, Lampa J, Jacobson SH, Kärre K, et al. Increased proportion of CD56bright natural killer cells in active and inactive systemic lupus erythematosus. Immunology 2009; 126:140–146. doi: 10.1111/j.1365-2567.2008.02887.x [DOI] [PMC free article] [PubMed] [Google Scholar]
- 10.Hervier B, Beziat V, Haroche J, Mathian A, Lebon P, Ghillani-Dalbin P, et al. Phenotype and function of natural killer cells in systemic lupus erythematosus: excess interferon-γ production in patients with active disease. Arthritis Rheum 2011; 63:1698–1706. doi: 10.1002/art.30313 [DOI] [PubMed] [Google Scholar]
- 11.Popko K, Górska E. The role of natural killer cells in pathogenesis of autoimmune diseases. Cent Eur J Immunol 2015; 40:470–476. doi: 10.5114/ceji.2015.56971 [DOI] [PMC free article] [PubMed] [Google Scholar]
- 12.Lin SJ, Chen JI, Kuo ML, Hsiao HS, Lee PT, Huang JL. Effect of interleukin-15 on CD11b, CD54, and CD62L expression on natural killer cell and natural killer T-like cells in systemic lupus erythematosis. Mediators of Inflammation 2016; 2016: 9675861 doi: 10.1155/2016/9675861 [DOI] [PMC free article] [PubMed] [Google Scholar]
- 13.González-Amaro R, Cortés JR, Sánchez-Madrid F, Martín P. Is CD69 an effective brake to control inflammatory diseases? Trends Mol Med 2013; 19:625–632. doi: 10.1016/j.molmed.2013.07.006 [DOI] [PMC free article] [PubMed] [Google Scholar]
- 14.Lanier LL. Up on the tightrope: Natural killer cell activation and inhibition. Nat Immunol 2008; 9:495–502. doi: 10.1038/ni1581 [DOI] [PMC free article] [PubMed] [Google Scholar]
- 15.Sivori S, Pende D, Bottino C, Marcenaro E, Pessino A, Biassoni R, et al. NKp46 is the major triggering receptor involved in the natural cytotoxicity of fresh or cultured human NK cells. Correlation between surface density of NKp46 and natural cytotoxicity against autologous, allogeneic or xenogeneic target cells. Eur J Immunol 1999; 29:1656–1666. doi: 10.1002/(SICI)1521-4141(199905)29:05<1656::AID-IMMU1656>3.0.CO;2-1 [DOI] [PubMed] [Google Scholar]
- 16.Boerman GH, van Ostaijen-ten Dam MM, Kraal KC, Santos SJ, Ball LM, Lankester AC, et al. Role of NKG2D, DNAM-1 and natural cytotoxicity receptors in cytotoxicity toward rhabdomyosarcoma cell lines mediated by resting and IL-15-activated human natural killer cells. Cancer Immunol Immunother 2015; 64:573–583. doi: 10.1007/s00262-015-1657-9 [DOI] [PMC free article] [PubMed] [Google Scholar]
- 17.Cheent KS, Jamil KM, Cassidy S, Liu M, Mbiribindi B, Mulder A, et al. Synergistic inhibition of natural killer cells by the nonsignaling molecule CD94. Proc Natl Acad Sci U S A. 2013; 110:16981–16986. doi: 10.1073/pnas.1304366110 [DOI] [PMC free article] [PubMed] [Google Scholar]
- 18.Wagtmann N, Biassoni R, Cantoni C, Verdiani S, Malnati MS, Vitale M, et al. Molecular clones of the p58NK cell receptor reveal immunoglobulin–related molecules with diversity in both the extra- and intracellular domains. Immunity 1995; 2:439–449. [DOI] [PubMed] [Google Scholar]
- 19.Li WX, Pan HF, Hu JL, Wang CZ, Zhang N, et al. Assay of T- and NK-cell subsets and the expression of NKG2A and NKG2D in patients with new-onset systemic lupus erythematosus. Clin Rheumatol. 2010; 29:315–323. doi: 10.1007/s10067-009-1322-9 [DOI] [PubMed] [Google Scholar]
- 20.Naumova E, Mihaylova A, Ivanova M, Mihailova S. Impact of KIR/HLA ligand combinations on immune responses in malignant melanoma. Cancer Immunol Immunother 2007; 56:95–100. doi: 10.1007/s00262-006-0151-9 [DOI] [PMC free article] [PubMed] [Google Scholar]
- 21.McGrath E, Ryan EJ, Lynch L, Golden-Mason L, Mooney E, Eogan M, et al. Changes in endometrial natural killer cell expression of CD94, CD158a and CD158b are associated with infertility. Am J Reprod Immunol 2009; 61:265–276. doi: 10.1111/j.1600-0897.2009.00688.x [DOI] [PubMed] [Google Scholar]
- 22.Shaw J, Kollnberger S. New perspectives on the ligands and function of the killer cell immunoglobulin-like receptor KIR3DL2 in health and disease. Front Immunol. 2012; 16:3:339 doi: 10.3389/fimmu.2012.00339 [DOI] [PMC free article] [PubMed] [Google Scholar]
- 23.Grabstein KH, Eisenman J, Shanebeck K, Rauch C, Srinivasan S, Fung V et al. Cloning of a T cell growth factor that interacts with the beta chain of the interleukin-2 receptor. Science. 1994; 264:965–968. doi: 10.1126/science.8178155 [DOI] [PubMed] [Google Scholar]
- 24.Giri JG, Anderson DM, Kumaki S, Park LS, Grabstein KH, Cosman D. IL-15, a novel T cell growth factor that shares activities and receptor components with IL-2. J Leukoc Biol. 1995;57:763–766. [DOI] [PubMed] [Google Scholar]
- 25.Baranda L, de la Fuente H, Layseca-Espinosa E, Niño-Moreno P, Valencia-Pacheco G, et al. IL-15 and IL-15R in leucocytes from patients with systemic lupus erythematosus. Rheumatology 2005; 44:1507–1513. doi: 10.1093/rheumatology/kei083 [DOI] [PubMed] [Google Scholar]
- 26.Aringer M, Stummvoll GH, Steiner G, Köller M, Steiner CW, Höfler E, et al. Serum interleukin-15 is elevated in systemic lupus erythematosus. Rheumatology 2001; 40:876–881. doi: 10.1093/rheumatology/40.8.876 [DOI] [PubMed] [Google Scholar]
- 27.Bombardier C, Gladman DD, Urowitz MB, Caron D, Chang CH. Derivation of the SLEDAI. A disease activity index for lupus patients. The Committee on Prognosis Studies in SLE. Arthritis Rheum 1992; 35:630–640. doi: 10.1002/art.1780350606 [DOI] [PubMed] [Google Scholar]
- 28.Petri M. Review of classification criteria for systemic lupus erythematosus. Rheum Dis Clin North Am 2005; 31:245–254. doi: 10.1016/j.rdc.2005.01.009 [DOI] [PubMed] [Google Scholar]
- 29.Lin SJ, Cheng PJ, Huang YJ, Kuo ML. Evaluation of cytotoxic function and apoptosis in interleukin (IL)-12/IL-15-treated umbilical cord or adult peripheral blood natural killer cells by a propidium-iodide based flow cytometry. Pediatr Allergy Immunol. 2004; 15:79–85. doi: 10.1046/j.0905-6157.2003.00103.x [DOI] [PubMed] [Google Scholar]
- 30.Zhu H, Mi W, Luo H, Chen T, Liu S, Raman I, et al. Whole-genome transcription and DNA methylation analysis of peripheral blood mononuclear cells identified aberrant gene regulation pathways in systemic lupus erythematosus. Arthritis Res Ther 2016; 18:162 doi: 10.1186/s13075-016-1050-x [DOI] [PMC free article] [PubMed] [Google Scholar]
- 31.Bo H, Wei XQ, Dong H, Zhang Y, Lv P, Liu W, et al. Elevated expression of transmembrane IL-15 in immune cells correlates with the development of murine lupus: a potential target for immunotherapy against SLE. Scand J Immunol 2009; 69:119–129. doi: 10.1111/j.1365-3083.2008.02197.x [DOI] [PubMed] [Google Scholar]
- 32.Li WX, Pan HF, Hu JL, Wang CZ, Zhang N, Li J, et al. Assay of T- and NK-cell subsets and the expression of NKG2A and NKG2D in patients with new-onset systemic lupus erythematosus. Clin Rheumatol. 2010; 29:315–323. doi: 10.1007/s10067-009-1322-9 [DOI] [PubMed] [Google Scholar]
- 33.Pende D, Parolini S, Pessino A, Sivori S, Augugliaro R, Morelli L, et al. Identification molecular characterization of NKp30, a novel triggering receptor involved in natural cytotoxicity mediated by human natural killer cells. J Exp Med. 1999; 190:1505–151. [DOI] [PMC free article] [PubMed] [Google Scholar]
- 34.Ferlazzo G, Tsang ML, Moretta L, Melioli G, Steinman RM, Munz C. Human dendritic cells activate resting natural killer (NK) cells and are recognized via the NKp30 receptor by activated NK cells. J Exp Med. 2002; 195:343–351. doi: 10.1084/jem.20011149 [DOI] [PMC free article] [PubMed] [Google Scholar]
- 35.Rusakiewicz S, Nocturne G, Lazure T, Semeraro M, Flament C, Caillat-Zucman S, et al. NCR3/NKp30 contributes to pathogenesis in primary Sjogren's syndrome. Sci Transl Med 2013; 5:195ra96 doi: 10.1126/scitranslmed.3005727 [DOI] [PMC free article] [PubMed] [Google Scholar]
- 36.Puxeddu I, Bongiorni F, Chimenti D, Bombardieri S, Moretta A, Bottino C, et al. Cell surface expression of activating receptors and co-receptors on peripheral blood NK cells in systemic autoimmune diseases. Scand J Rheumatol 2012; 41:298–304. doi: 10.3109/03009742.2011.648657 [DOI] [PubMed] [Google Scholar]
- 37.Hromadnikova I, Pirkova P, Sedlackova L. Influence of in vitro IL-2 or IL-15 alone or in combination with Hsp-70-derived 14-mer peptide (TKD) on the expression of NK cell activatory and inhibitory receptors. Plos one 2016; 11: e0151535, doi: 10.1371/journal.pone.0151535 [DOI] [PMC free article] [PubMed] [Google Scholar]
- 38.Boyiadzis M, Memon S, Carson J, Allen K, Szczepanski MJ, Vance BA, et al. Up-regulation of NK cell activating receptors following allogeneic hematopoietic stem cell transplantation under a lymphodepleting reduced intensity regimen is associated with elevated IL-15 levels. Biol Blood Marrow Transplant 2008; 14:290–300. doi: 10.1016/j.bbmt.2007.12.490 [DOI] [PubMed] [Google Scholar]
- 39.Sivori S, Pende D, Bottino C, Marcenaro E, Pessino A, Biassoni R, et al. NKp46 is the major triggering receptor involved in the natural cytotoxicity of fresh or cultured human NK cells: correlation between surface density of NKp46 and natural cytotoxicity against autologous, allogeneic or xenogeneic target cells. Eur J Immunol 1999; 29: 1656–1666. doi: 10.1002/(SICI)1521-4141(199905)29:05<1656::AID-IMMU1656>3.0.CO;2-1 [DOI] [PubMed] [Google Scholar]
- 40.Halfteck GG, Elboim M, Gur C, Achdout H, Ghadially H, Mandelboim O, et al. Enhanced in vivo growth of lymphoma tumors in the absence of the NK-activating receptor NKp46/NCR1. J Immunol 2009; 182:2221–2230. doi: 10.4049/jimmunol.0801878 [DOI] [PubMed] [Google Scholar]
- 41.Mandelboim O, Lieberman N, Lev M, Paul L, Arnon TI, Bushkin Y, et al. Recognition of haemagglutinins on virus-infected cells by NKp46 activates lysis by human NK cells. Nature 2001; 409:1055–1060. doi: 10.1038/35059110 [DOI] [PubMed] [Google Scholar]
- 42.Dai Z, Turtle CJ, Booth GC, Riddell SR, Gooley TA, Stevens AM, et al. Normally occurring NKG2D+CD4+ T cells are immunosuppressive and inversely correlated with disease activity in juvenile-onset lupus. J Exp Med 2009; 206:793–805. doi: 10.1084/jem.20081648 [DOI] [PMC free article] [PubMed] [Google Scholar]
- 43.Spada R, Rojas JM, Pérez-Yagüe S, Mulens V, Cannata-Ortiz P, Bragado R, et al. NKG2D ligand overexpression in lupus nephritis correlates with increased NK cell activity and differentiation in kidneys but not in the periphery. J Leukoc Biol 2015; 97:583–98. doi: 10.1189/jlb.4A0714-326R [DOI] [PMC free article] [PubMed] [Google Scholar]
- 44.Eidukaite A, Siaurys A, Tamosiunas V. Differential expression of KIR/NKAT2 and CD94 molecules on decidual and peripheral blood CD56bright and CD56dim natural killer cell subsets. Fertil Steril 2004; 81:863–868. doi: 10.1016/j.fertnstert.2003.10.019 [DOI] [PubMed] [Google Scholar]
- 45.Bai Y, Zhang Y, Yang Q, Hou Y, Hu N, Wang D, et al. The aberrant expression of stimulatory and inhibitory killer immunoglobulin-like receptors in NK- and NKT-cells contributes to lupus. Clin Lab 2014; 60:717–727. [DOI] [PubMed] [Google Scholar]
- 46.Poszepczynska-Guigné E, Schiavon V, D'Incan M, Echchakir H, Musette P, Ortonne N, et al. CD158k/KIR3DL2 is a new phenotypic marker of Sezary cells: relevance for the diagnosis and follow-up of Sezary syndrome. J Invest Dermatol. 2004; 122:820–823. doi: 10.1111/j.0022-202X.2004.22326.x [DOI] [PubMed] [Google Scholar]
Associated Data
This section collects any data citations, data availability statements, or supplementary materials included in this article.
Supplementary Materials
Headings are depicted in 20170920 Support information.xls.
(XLS)
Data Availability Statement
All relevant data are within the paper and its Supporting Information files.


