

ABSTRACT
Purpose
Both moderate-to-vigorous physical activity (MVPA) and sedentary behavior can be associated with adult adiposity. Much of the relevant evidence is from cross-sectional studies or from prospective studies with relevant exposure measures at a single time point before weight gain or incident obesity. This study examined whether changes in MVPA and television (TV) viewing time are associated with subsequent changes in waist circumference, using data from three separate observation points in a large population-based prospective study of Australian adults.
Methods
Data were obtained from the Australian Diabetes, Obesity, and Lifestyle study collected in 1999–2000 (baseline), 2004–2005 (wave 2), and 2011–2012 (wave 3). The study sample consisted of adults age 25 to 74 yr at baseline who also attended site measurement at three time points (n = 3261). Multilevel linear regression analysis examined associations of initial 5-yr changes in MVPA and TV viewing time (from baseline to wave 2) with 12-yr change in waist circumference (from baseline to wave 3), adjusting for well-known confounders.
Results
As categorical predictors, increases in MVPA significantly attenuated increases in waist circumference (P for trend < 0.001). TV viewing time change was not significantly associated with changes in waist circumference (P for trend = 0.06). Combined categories of MVPA and TV viewing time changes were predictive of waist circumference increases; compared with those who increased MVPA and reduced TV viewing time, those who reduced MVPA and increased TV viewing time had a 2-cm greater increase in waist circumference (P = 0.001).
Conclusion
Decreasing MVPA emerged as a significant predictor of increases in waist circumference. Increasing TV viewing time was also influential, but its impact was much weaker than MVPA.
Key Words: EXERCISE, SEDENTARY LIFESTYLE, OBESITY, CENTRAL ADIPOSITY, PROSPECTIVE STUDIES
Increasing prevalences of overweight and obesity are a major global public health challenge (16). For example, in 2011–2012, some 69% of Americans age 20 yr or older and 63% of Australians age 18 yr or older were overweight or obese (3,27). With obesity related to increased risk of premature mortality and to a plethora of adverse health outcomes (9,10,41), there is an urgent need for effective public health interventions to prevent weight gain.
Population strategies for weight-gain prevention include increasing energy expenditure through physical activity. Moderate-to-vigorous physical activity (MVPA) can attenuate increases in body weight, body mass index (BMI), and waist circumference and reduce the risk of obesity (7,14). More recently, sedentary behaviors—put simply, too much sitting as distinct from too little exercise—have been implicated in the weight gain equation. Television (TV) viewing time, a common sedentary behavior that occupies a large proportion of leisure time, is now understood to be a health risk in its own right (28,34). Evidence from prospective studies suggests that TV viewing time can be associated with the increase in adiposity after accounting for the role of leisure time MVPA, although the relevant findings are mixed (37).
There is a body of evidence from cross-sectional studies showing independent and joint associations of MVPA and sedentary behavior with adiposity (11,13,23,25,30,35). However, only a small number of prospective studies to date have assessed simultaneously the associations of MVPA and sedentary behavior with adiposity outcomes (5,18,29,35). Findings from the Nurses’ Health Study have shown both low volumes of brisk walking and high TV viewing time to be independently associated with increased incidence of obesity (≥30 kg·m−2) over 6 yr (18). The Cancer Prevention Study II also found that both low levels of recreational leisure time physical activity and higher nonoccupational sedentary time to be associated with a higher odds of a 5- to 9-lb weight gain over 7 yr among postmenopausal women, but only among those who initially were not overweight (5). A 1-yr prospective study examining the maintenance of weight loss among 1422 adults found that the combination of an increase in TV viewing time and a decrease in MVPA was a significant independent predictor of weight regain (29). Two prospective studies have reported that a combination of low or decreased MVPA and high or increased TV viewing time can increase the risk of obesity and weight gain (18,29). Furthermore, engaging in high levels of physical activity or increasing physical activity level was found not to fully mitigate the adverse effects of TV viewing time on obesity risk (18,29), which is consistent with evidence from cross-sectional studies (25).
Prospective studies have typically examined relationships of physical activity and/or sedentary behavior at baseline or a single point in time with subsequent weight change or incident obesity (5,18). However, assessment of the relevant exposure variables at more than 2 timepoints provides the advantage of examining how preceding changes in behaviors might predict the subsequent changes in adiposity—providing more robust evidence on the potential causal roles of physical activity and sedentary behaviors in weight gain.
In understanding physical activity and sedentary behavior as determinants of adiposity, a limitation to the evidence is that a high proportion of the studies have used BMI or body weight (5,13,18,23,25,29,30,35). Waist circumference is, however, a more robust anthropometric marker of total body fat (6). Also, anthropometric measures of abdominal obesity are more strongly associated with cardiometabolic risk than is BMI (10) and are argued to be more reflective of the physiological effect of behaviors on body composition (11,33). Adult weight gain tends to be reflected through increases in central adiposity rather than overall body adiposity (15,39).
We examined prospective changes in adults’ waist circumference in relation to changes in MVPA and TV viewing time, using data from three observation points over 12 yr (baseline, 5-yr, and 12-yr follow-ups). Initial 5-yr changes in MVPA and TV viewing time (from baseline to 5 yr) were examined as potential predictors of 12-yr changes in waist circumference (from baseline to 12 yr).
METHODS AND PROCEDURES
Study Sample
The Australian Diabetes, Obesity, and Lifestyle Study (AusDiab) initially assessed 11,247 Australian adults age 25 yr or older to examine the national prevalence of diabetes and related risk factors. The baseline measurement was undertaken in 1999–2000 (wave 1) with two follow-up measures in 2004–2005 (wave 2) and 2011–2012 (wave 3). The study methods and attributes of participants in wave 1 (12) and wave 2 (24,36) have been previously reported.
The study sample consisted of adults age 25 to 74 yr at baseline who also attended an on-site measurement in both waves 2 and 3 (n = 3918; 37.9% of baseline sample). Those who were clinically diagnosed with diabetes (n = 203), reported history of cardiovascular diseases (angina: n = 105; myocardial infarction: n = 70; stroke: n = 30), pregnant at any of three measurement periods (n = 31), or had missing data for relevant variables (n = 349) were excluded. Exclusion criteria were not mutually exclusive. The final study sample was 3261 (43.5% men).
A comparison of baseline values between the final study sample and those only attending the baseline 1999–2000 study (n = 4960) showed that the final sample was comparable for distribution in gender and lipid-lowering medication use and for MVPA, total energy intake, and total alcohol intake. However, they were more likely to be highly educated (P < 0.001), employed (P < 0.001), and earning a higher income (P < 0.001), and less likely to be taking antihypertensive medication (P < 0.001) than those who took part only in the baseline study. Also, the final sample were younger (P = 0.004), had lower waist circumference (P < 0.001), watched less TV (P < 0.001), and had higher physical functioning (P < 0.001) compared with those who participated in the baseline study phase only. The study was approved by the Ethics Committee of International Diabetes Institute, and written informed consent was obtained from all participants.
Measures and Instruments
Waist circumference change
Waist circumference (cm) measures at baseline and wave 3 were used. On each occasion, trained field staff measured the participants’ waist circumference halfway between the lower border of the ribs and the iliac crest on a horizontal plane. Two measurements to the nearest 0.5 cm were recorded, and the mean was calculated; if the variation between the two measures was greater than 2 cm, a third measure was taken, and the mean of the two closest measures was calculated. Twelve-year changes in waist circumference were calculated as the measure at wave 3 minus the measure at baseline.
BMI change
The change in BMI (kg·m−2) from baseline to wave 3 was also used as an outcome. Height and weight were measured with participants wearing light clothing and no shoes at each wave. Twelve-year changes in BMI were calculated as the measure at wave 3 minus the measure at baseline.
MVPA change
MVPA at both baseline and wave 2 was assessed using the Active Australia Survey, a questionnaire that measures participation in predominantly leisure time physical (but also includes walking for transport) during the previous week (4). The Active Australia instrument has been shown to have acceptable levels of reliability (intraclass correlation = 0.59; 95% confidence interval = 0.52–0.65) and validity (criterion validity = 0.3) among adults (8,38). Participants reported the amount of time (min·wk−1) they spent in the past week in 1) walking for transport and recreation, 2) moderate-intensity physical activity, and 3) vigorous-intensity physical activity. Total MVPA (h·wk−1) was calculated as the sum of the time spent walking (if continuous and for 10 min or more), performing moderate-intensity physical activity, plus double the time spent in vigorous-intensity physical activity (1). Data for those who reported more than 28 h·wk−1 (4 h·d−1) of MVPA were truncated to 28 h·wk−1. Five-year changes in MVPA were calculated as the duration at wave 2 minus the duration at baseline. Change in MVPA was examined both as a continuous and categorical predictor. Based on the distribution, three change categories were created: decreased (>−1.0 h·wk−1), no change (0 ± 1.0 h·wk−1), and increase (>1.0 h·wk−1).
TV viewing time change
At both baseline and wave 2, participants reported time spent watching TV or video/DVD on weekdays (that is, their total time over the five weekdays) and weekends (that is, their total time over the two weekend days), for the past week. This measure has been shown to have acceptable level of test–retest reliability (intraclass correlation = 0.82) and criterion validity (Spearman rank-order correlation with a 3-d log = 0.3) among adults (31). Average daily TV viewing time was calculated by summing the time for weekdays and for weekend days and dividing this by seven (h·wk−1). Data for those who reported more than 112 h·wk−1 (16 h·d−1) of TV viewing time were truncated to 112 h·wk−1. Five-year changes in TV viewing time (h·wk−1) were calculated as the duration at wave 2 minus the duration at baseline. Change in TV viewing time was examined both as continuous and categorical predictors. Based on the distribution, three change categories were created: decreased (>−3.5 h·wk−1), no change (0 ± 3.5 h·wk−1), and increased (>3.5 h·wk−1).
Potential confounding variables
At baseline, the following sociodemographic, dietary, and health-related measures were assessed with an interviewer-administered questionnaire (12): gender, age, marital status (currently married or de facto; yes/no), educational attainment (high school or further education; yes/no), household income (≥ US $32,200 per annum; yes/no), and working status (working full time or part time; yes/no), total energy intake (kJ·d−1) (20), alcohol intake (g·d−1) (20), and medications for hypertension and dyslipidemia. Self-rated physical function was assessed at baseline using the physical functioning domain from the version 1 of the SF-36 Health Survey (40).
Statistical Analyses
Multilevel analysis was used because the AusDiab study had a multistage cluster sampling design with 42 data collection areas (six areas from each of seven Australian states and territories), as there was a small level of within-area clustering (intraclass correlation coefficient = 0.044). The structure of the analysis was that individuals (level 1) were nested within collection districts (level 2). A series of linear regression models were used to examine both independent and joint associations of initial 5-yr changes in MVPA and TV viewing time with 12-yr changes in waist circumference. The same set of analyses was conducted for 12-yr BMI changes as a sensitivity analysis. Results provided are unstandardized b coefficients for continuous exposure measures. For categorical exposures, adjusted mean changes in waist circumference were additionally calculated. Analyses were conducted using STATA 12.0. Statistical significance was set at P < 0.05.
Independent associations MVPA and TV viewing time changes with waist-circumference change
Linear regression models were performed for the two behavioral exposure variables (changes in MVPA and TV viewing time). To test whether potential covariates influence the associations of initial 5-yr changes in MVPA and TV viewing time with 12-yr changes in waist circumference, a four-step analysis was performed. Change in waist circumference over 12 yr was regressed against: change and baseline behavior variable (MVPA or TV viewing time), baseline waist circumference, gender, age, education, employment status, income, antihypertensive medication and lipid-lowering medication (model A). Model B additionally adjusted for baseline alcohol consumption and total energy intake. Model C further adjusted for baseline physical functioning. To examine the independent associations of either MVPA or TV viewing time, model D further adjusted for one or the other behavior variable.
In separate linear regression models including changes in MVPA or TV viewing time as categorical variables (increased, no change, decreased), pairwise comparisons were performed to examine the difference in adjusted mean waist circumference change across the three prospective categories for the behavior. In addition to pairwise comparisons of the adjusted means, linear trends of changes in waist circumference across the three categories of the behaviors were also examined.
Joint associations of MVPA and TV viewing time changes with waist-circumference change
Each participant was allocated to one of the nine categories of MVPA change and TV viewing time change. Adjusted mean waist circumference changes were determined for each category, adjusting for all potential confounding variables. Also, interactions between MVPA and TV viewing time in their association with waist circumference were examined. Analyses were adjusted for baseline MVPA, TV viewing time, waist circumference, and also gender, age, education, employment status, income, antihypertensive medication and lipid-lowering medication, alcohol consumption, total energy intake, and physical functioning.
RESULTS
Descriptive Characteristics of the Sample
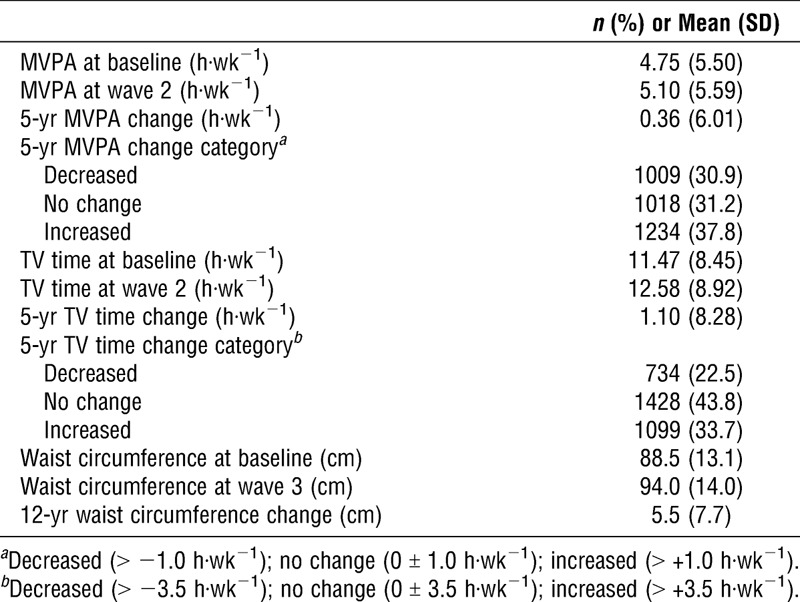
Table 1 presents the study sample characteristics. Mean MVPA and TV viewing time increased from 4.75 to 5.10 h·wk−1 and from 11.47 to 12.58 h·wk−1 (from 1.64 to 1.80 h d−1), respectively, over the initial 5 yr. Waist circumference increased from 88.5 to 94.0 cm over the 12-yr study period (Table 2).
TABLE 1.
Sample characteristics at baseline (n = 3261).
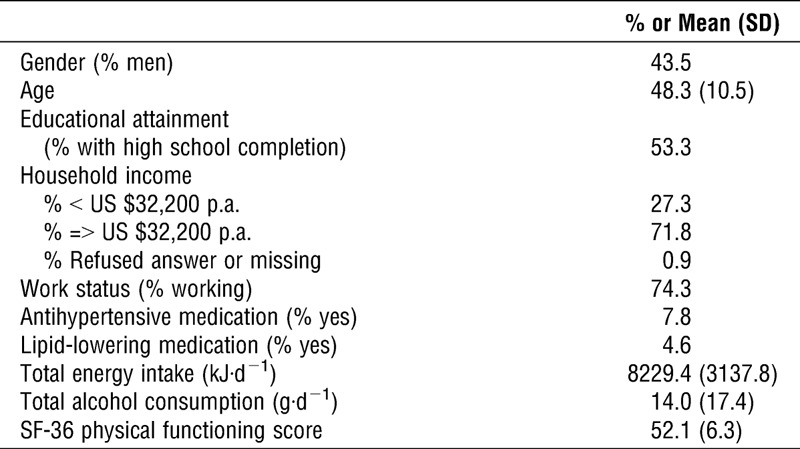
TABLE 2.
Descriptive information on MVPA, TV viewing time, and waist circumference.
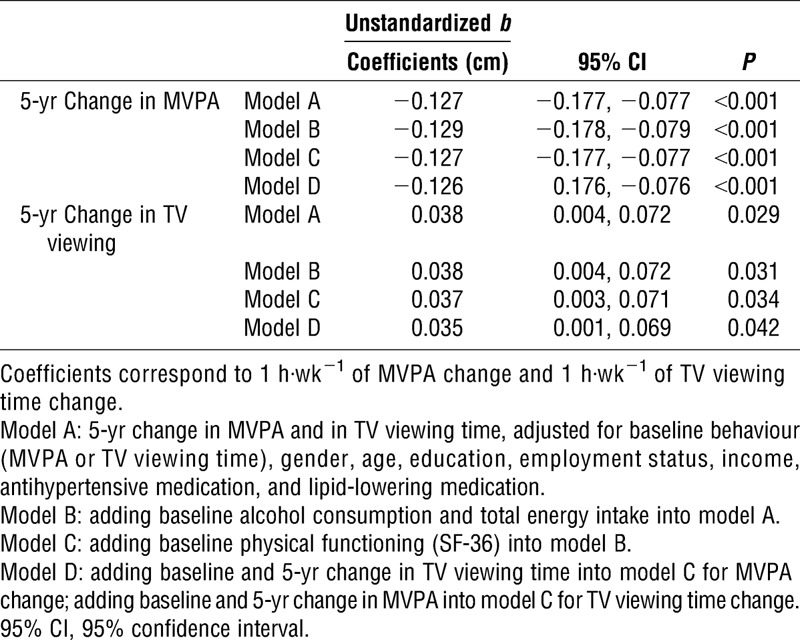
Individual Associations MVPA and TV Viewing Time Changes (Continuous) with Waist Circumference Change
Results for the associations of continuous change in MVPA and TV viewing time over the initial 5 yr with 12-yr change in waist circumference are presented in Table 3. An increase in MVPA (1 h·wk−1) attenuated the increase in waist circumference observed over the 12-yr period. This association was unchanged after additional adjustment for total energy intake, physical functioning, and TV viewing time (Table 3, models B, C, D; P < 0.001). Every 1-h increase in MVPA per week for the initial 5 yr was associated with an average 0.13 cm decrease in waist circumference over 12 yr. An increase in TV viewing time (1 h·wk−1) was significantly associated with an increase in waist circumference over the 12-yr period. This association remained statistically significant after adjustment for dietary behavior, physical functioning, and MVPA, although these variables slightly attenuated the effects of TV viewing time on waist circumference (Table 3, models B, C, D; P = <0.05). Every 1-h increase in TV viewing time per week for the initial 5 yr was associated with a 0.035-cm increase in waist circumference over 12 yr.
TABLE 3.
Associations of 5-yr change in MVPA (1 h·wk−1) and TV viewing time (1 h·wk−1; continuous) with 12-yr change in waist circumference (n = 3261).
Associations of MVPA and TV Viewing Time Changes (Categorical) with Waist Circumference Change
Figures 1 and 2 show 12-yr changes in waist circumference in relation to categories of change in MVPA and TV viewing time in the initial 5 yr. Results are shown after adjustment for potential confounders and for the counterpart behavior (MVPA in the case of TV viewing time; TV viewing time in the case of MVPA—model D). Those who did not change MVPA and those who increased MVPA increased their waist circumference significantly less than those whose MVPA decreased (P < 0.05). Change in waist circumference among those who did not change MVPA was also significantly lower compared with those whose MVPA decreased (P < 0.05). A dose–response relationship was observed across the three MVPA categories (P for trend < 0.001). Compared with those who decreased their TV viewing time, those who increased their TV viewing time did not have statistically significant increases in waist circumference (P = 0.054). The trend across the three TV viewing time categories was also nonsignificant (P for trend = 0.06).
FIGURE 1.
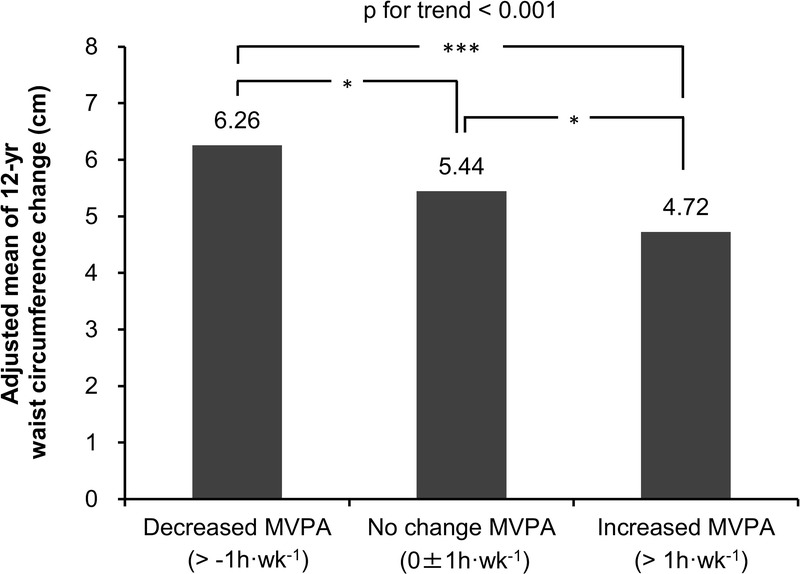
Associations of categories of 5-yr MVPA change with waist circumference change Analysis adjusted for baseline waist circumference; baseline MVPA; gender, age, education, employment status, income, antihypertensive medication, lipid-lowering medication, alcohol consumption, total energy intake, physical functioning at baseline; and for baseline and 5-yr change in TV viewing time (model D). Data are adjusted means. *P < 0.05, ***P < 0.001.
FIGURE 2.
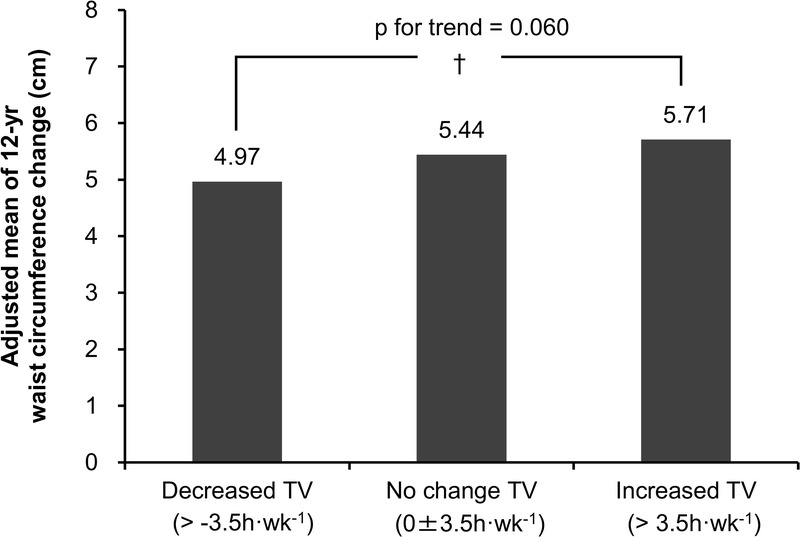
Associations of categories of 5-yr TV viewing time change with waist circumference change Analysis adjusted for baseline waist circumference; baseline TV viewing time; gender, age, education, employment status, income, antihypertensive medication, lipid-lowering medication, alcohol consumption, total energy intake, physical functioning at baseline; and for baseline and 5-yr change in MVPA (model D). Data are adjusted means. †P < 0.1.
Joint Associations MVPA and TV Viewing Time Changes with Waist Circumference Change
Figure 3 shows adjusted mean changes in waist circumference for the joint categories of MVPA and TV viewing time changes. Although the influences of MVPA on waist circumference change were apparently stronger than those of TV viewing time, the combination of decreased MVPA and increased TV viewing time were strongest with respect to increases in waist circumference over the 12-yr period. For example, those who decreased MVPA and increased TV viewing time increased their waist circumference about 2.1 cm more than those who increased MVPA and decreased TV viewing time (the reference group; P = 0.001). There was no statistically significant interaction between change in MVPA and TV viewing time on 12-yr changes with waist circumference.
FIGURE 3.
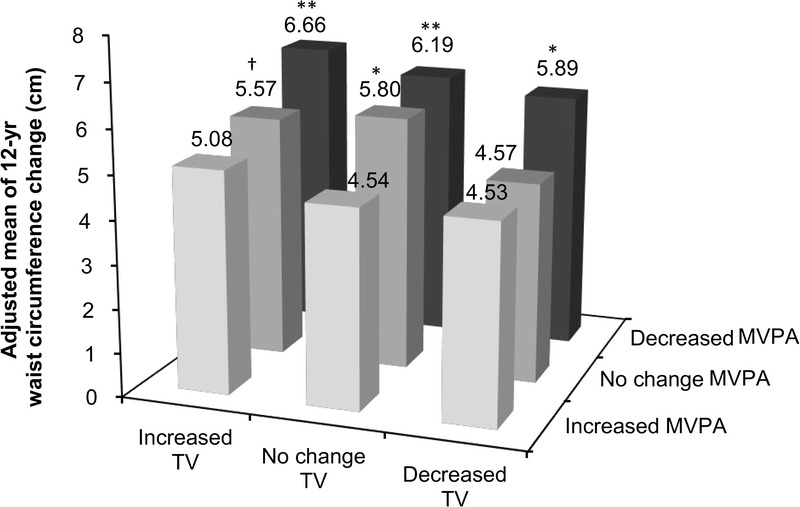
Associations of joint categories of MVPA and TV viewing time changes with waist circumference change. Analysis adjusted for baseline waist circumference; baseline MVPA and TV viewing time; gender, age, education, employment status, income, antihypertensive medication, lipid-lowering medication, alcohol consumption, total energy intake and physical functioning at baseline. Data are adjusted means. Significant differences from the reference category (increased MVPA and decreased TV viewing time) are shown. †P < 0.1, *P < 0.05, **P < 0.01.
Findings on the independent and joint associations of continuous change in MVPA and TV viewing time over the initial 5 yr with 12-yr change in BMI. Similar to the findings for waist circumference change, significant associations of BMI changes with the exposure measures were observed. However, the associations were slightly weaker than were those found for waist circumference change.
DISCUSSION
These findings help to confirm and extend previous prospective and cross-sectional studies examining the combined association of TV viewing time and MVPA with obesity outcomes, suggesting that there is evidence accumulative effects from declines in MVPA and increases in sedentary behavior on obesity markers (18,25,29) and also suggesting potentially limited mitigating capacity of MVPA on the adverse effects of TV viewing time (18,25,29). The relationships that we identified were largely independent of potential confounding factors, including medication use, diet, and physical functioning. MVPA emerged as an apparently more significant influence on waist circumference increase than did TV viewing time.
A small number of prospective studies have previously examined simultaneously the associations of MVPA and sedentary behaviors with adiposity outcomes (5,18,29,33). However, these studies used a behavior measured at a single point in time or a concurrent measure of behavior, which is not able to directly assess the effect of continued exposure of behaviors or the potential direction of causality. The present study extended upon these findings by using multiple timepoint measures of relevant behaviors and found that preceding changes in MVPA and TV viewing time can impact on the subsequent changes in central adiposity.
It is important to note that previous prospective studies have shown that baseline adiposity status or adiposity increases can predict future sedentary behavior or physical activity levels (17,21). It is plausible that physical activity, sedentary behavior, and adiposity could have bidirectional relationships. These relationships are complex, because preexisting adiposity may also reflect the outcomes of previous long-term physical activity and sedentary behavior patterns. Further evidence from prospective studies with repeated measures of the exposure and outcome variables would help to more definitively characterize the direction of such associations.
Distinct associations of MVPA and sedentary behavior with regional fat deposition may be one of the possible reasons that might account for the stronger associations we have observed with MVPA than TV viewing time. Previous studies have shown MVPA or leisure time physical activity to be negatively associated with visceral and subcutaneous fat, whereas total sedentary time was not associated with these types of fat regions but rather pericardial fat (22,26). A Canadian prospective study found that increases in sedentary behavior from baseline to follow-up were associated with increases in waist circumference but not visceral adiposity (32), implying that other factors that can influence waist circumference, such as overall adiposity, may be more closely related to sedentary behavior. Thus, further research is needed to further explore these mechanisms.
Our findings may have some relevant implications from a public health perspective. Regardless of initial levels of MVPA and TV viewing time, the risk of long-term waist circumference increases could partly be controlled by relatively small, gradual changes in these two health behaviors (increasing about 10 or more minutes of MVPA or decreasing 60 min of TV viewing per day within a long timespan of 5 yr). Considering the consistent observations of progressive increases in average waist circumference in Australia (2), there is likely to be obesity prevention benefit from population-based strategies to increase MVPA and to reduce sedentary behaviors.
Strengths of our study included a large sample size, wide age range of the cohort, prospective design, multiple follow-ups, and the objective measurement of waist circumference. Taking account of a number of potential confounders, notably medication use, total energy intake, alcohol consumption, and physical functioning is a further strength. Limitations include TV viewing time and physical activity exposure measures being based on self-report, which could be subject to recall error and social desirability bias. This could potentially reduce the association between exposure and outcome variables due to regression dilution bias (19). In the assessment of physical activity level, domestic and occupational physical activities were not included. Furthermore, this study only measured TV viewing, not other types of sedentary behaviour, such as workplace sitting, car driving, and computer uses. Though TV viewing time may be reflective of a broader sedentary lifestyle, it is not a measure of total sedentary behavior. Thus, caution is needed in generalizing these findings to what may be the case if all types of sedentary behavior were to be included (34). As we document, 61% of the baseline sample did not return for the wave 2 and wave 3 visits. This loss to follow-up was not completely at random, which may have biased aspects of the findings that we have reported. Compared with the original baseline sample, those followed up were more likely to be highly educated, employed, and earning higher income, less likely to be taking antihypertensive medication, were younger, had a lower waist circumference, watched less TV, and had higher physical functioning.
In conclusion, within the background of an average 5.5-cm increase in waist circumference over 12 yr in this sample of Australian adults, initial 5-yr decreases in MVPA and increases in TV viewing time were associated with greater waist circumference increases at 12 yr regardless of the initial levels of MVPA and TV viewing time. Specifically, a stronger association was observed for MVPA changes. The combination of reductions in MVPA and increases in TV viewing time during the initial 5-yr observation period was predictive of waist circumference increases; compared with those who increased MVPA and reduced TV viewing time, those who reduced MVPA by 1 h·wk−1 or more and increased TV viewing time by 3.5 h·wk−1 (0.5 h·d−1) or more had a 2-cm greater increase in waist circumference. For understanding and influencing age-related increases in waist circumference—a marker of central adiposity and associated cardio-metabolic health risk—there is a need to consider both physical activity and sedentary behaviors, such as TV viewing time.
Acknowledgments
The AusDiab study co-coordinated by the Baker IDI Heart and Diabetes Institute, gratefully acknowledges the support and assistance given by: K. Anstey, B. Atkins, B. Balkau, E. Barr, A. Cameron, S. Chadban, M. de Courten, D. Dunstan, A. Kavanagh, D. Magliano, S. Murray, N. Owen, K. Polkinghorne, J. Shaw, T. Welborn, P. Zimmet and all the study participants.
Also, for funding or logistical support, we are grateful to: National Health and Medical Research Council (NHMRC grants 233200 and 1007544), Australian Government Department of Health and Ageing, Abbott Australasia Pty Ltd, Alphapharm Pty Ltd, Amgen Australia, AstraZeneca, Bristol-Myers Squibb, City Health Centre-Diabetes Service-Canberra, Department of Health and Community Services - Northern Territory, Department of Health and Human Services, Tasmania; Department of Health, New South Wales; Department of Health, Western Australia; Department of Health, South Australia; Department of Human Services, Victoria; Diabetes Australia, Diabetes Australia Northern Territory, Eli Lilly Australia, Estate of the Late Edward Wilson, GlaxoSmithKline, Jack Brockhoff Foundation, Janssen-Cilag, Kidney Health Australia, Marian & FH Flack Trust, Menzies Research Institute, Merck Sharp & Dohme, Novartis Pharmaceuticals, Novo Nordisk Pharmaceuticals, Pfizer Pty Ltd, Pratt Foundation, Queensland Health, Roche Diagnostics Australia, Royal Prince Alfred Hospital, Sydney, Sanofi Aventis, sanofi-synthelabo, the Victorian Government’s OIS Program, and 2015–2019 MEXT-Supported Program for the Strategic Research Foundation at Private Universities (S1511017).
N. Owen is supported by NHMRC Program Grant (NHMRC 569940), a Senior Principal Research Fellowship (NHMRC 1003960) and by the Victorian Government’s Operational Infrastructure Support Program. J. Salmon is supported by a NHMRC Principal Research Fellowship (APP1026216). D. W. Dunstan is supported by an Australian Research Council Future Fellowship (FT100100918) and the Victorian Government’s Operational Infrastructure Support Program. The results of the present study do not constitute endorsement by ACSM.
The authors would like to acknowledge Parneet Sethi for useful discussions on this work.
Conflicts of Interest Statement: The authors have no conflicts of interest to disclose.
Funding sources: The study was supported by funding from the National Health and Medical Research Council of Australia. Please refer to the acknowledgments section for further information.
REFERENCES
- 1. Armstrong T, Bauman A, Davies J. Physical Activity Patterns of Australian adults. Results of the 1999 National Physical Activity Survey. Canberra: Australian Institute of Health and Welfare; 2000. [cited 2015 March 31]. Available from: http://aihw.gov.au/WorkArea/DownloadAsset.aspx?id=6442454841. [Google Scholar]
- 2.Australian Bureau of Statistics. Austrlaian Health Survey: First Results, 2011–12 [Internet]. Canberra: Australian Bureau of Statistics; [cited 2012 Oct 29]. Available from: http://www.abs.gov.au/ausstats/abs@.nsf/Lookup/6A2304311987758FCA257AA30014C0C6?opendocument. [Google Scholar]
- 3.Australian Bureau of Statistics. Austrlaian Health Survey: Updated Results, 2011–12 [Internet]. Canberra: Australian Bureau of Statistics; [cited 2013 June 7]. Available from: http://www.abs.gov.au/ausstats/abs@.nsf/mf/4364.0.55.003. [Google Scholar]
- 4.Australian Institute of Health and Welfare. The Active Australia Survey. A Guide and Manual for Implementation, Analysis and Reporting. Canberr: Australian Institute of Health and Welfare; 2003. [cited 2015 March 31]. Available from: http://www.aihw.gov.au/WorkArea/DownloadAsset.aspx?id=6442454895. [Google Scholar]
- 5. Blanck HM, McCullough ML, Patel AV, et al. Sedentary behavior, recreational physical activity, and 7-year weight gain among postmenopausal U.S. women. Obesity (Silver Spring). 2007; 15(6): 1578– 88. [DOI] [PubMed] [Google Scholar]
- 6. Bouchard C. BMI, fat mass, abdominal adiposity and visceral fat: where is the ‘beef’? Int. J. Obes. (Lond). 2007; 31(10): 1552– 3. [DOI] [PubMed] [Google Scholar]
- 7. Britton KA, Lee IM, Wang L, et al. Physical activity and the risk of becoming overweight or obese in middle-aged and older women. Obesity (Silver Spring). 2012; 20(5): 1096– 103. [DOI] [PMC free article] [PubMed] [Google Scholar]
- 8. Brown WJ, Trost SG, Bauman A, Mummery K, Owen N. Test–retest reliability of four physical activity measures used in population surveys. J Sci Med Sport. 2004; 7(2): 205– 15. [DOI] [PubMed] [Google Scholar]
- 9. Calle EE, Rodriguez C, Walker-Thurmond K, Thun MJ. Overweight, obesity, and mortality from cancer in a prospectively studied cohort of U.S. adults. N Engl J Med. 2003; 348(17): 1625– 38. [DOI] [PubMed] [Google Scholar]
- 10. Dalton M, Cameron AJ, Zimmet PZ, et al. Waist circumference, waist–hip ratio and body mass index and their correlation with cardiovascular disease risk factors in Australian adults. J Intern Med. 2003; 254(6): 555– 63. [DOI] [PubMed] [Google Scholar]
- 11. Dunstan DW, Salmon J, Owen N, et al. Associations of TV viewing and physical activity with the metabolic syndrome in Australian adults. Diabetologia. 2005; 48(11): 2254– 61. [DOI] [PubMed] [Google Scholar]
- 12. Dunstan DW, Zimmet PZ, Welborn TA, et al. The Australian Diabetes, Obesity and Lifestyle Study (AusDiab)—methods and response rates. Diabetes Res Clin Pract. 2002; 57(2): 119– 29. [DOI] [PubMed] [Google Scholar]
- 13. Dunton GF, Berrigan D, Ballard-Barbash R, Graubard B, Atienza AA. Joint associations of physical activity and sedentary behaviors with body mass index: results from a time use survey of US adults. Int J Obes (Lond). 2009; 33(12): 1427– 36. [DOI] [PubMed] [Google Scholar]
- 14. Ekelund U, Besson H, Luan J, et al. Physical activity and gain in abdominal adiposity and body weight: prospective cohort study in 288,498 men and women. Am J Clin Nutr. 2011; 93(4): 826– 35. [DOI] [PubMed] [Google Scholar]
- 15. Elobeid MA, Desmond RA, Thomas O, Keith SW, Allison DB. Waist circumference values are increasing beyond those expected from BMI increases. Obesity (Silver Spring). 2007; 15(10): 2380– 3. [DOI] [PubMed] [Google Scholar]
- 16. Finucane MM, Stevens GA, Cowan MJ, et al. National, regional, and global trends in body-mass index since 1980: systematic analysis of health examination surveys and epidemiological studies with 960 country-years and 9·1 million participants. Lancet. 2011; 377(9765): 557– 67. [DOI] [PMC free article] [PubMed] [Google Scholar]
- 17. Golubic R, Ekelund U, Wijndaele K, et al. Rate of weight gain predicts change in physical activity levels: a longitudinal analysis of the EPIC-Norfolk cohort. Int J Obes (Lond). 2013; 37(3): 404– 9. [DOI] [PMC free article] [PubMed] [Google Scholar]
- 18. Hu FB, Li TY, Colditz GA, Willett WC, Manson JE. Television watching and other sedentary behaviors in relation to risk of obesity and type 2 diabetes mellitus in women. JAMA. 2003; 289(14): 1785– 91. [DOI] [PubMed] [Google Scholar]
- 19. Hutcheon JA, Chiolero A, Hanley JA. Random measurement error and regression dilution bias. BMJ. 2010; 340: c2289. [DOI] [PubMed] [Google Scholar]
- 20. Ireland P, Jolley D, Giles G, et al. Development of the Melbourne FFQ: a food frequency questionnaire for use in an Australian prospective study involving an ethnically diverse cohort. Asia Pac J Clin Nutr. 1994; 3: 19– 31. [PubMed] [Google Scholar]
- 21. Lakerveld J, Dunstan D, Bot S, et al. Abdominal obesity, TV-viewing time and prospective declines in physical activity. Prev Med. 2011; 53(4–5): 299– 302. [DOI] [PubMed] [Google Scholar]
- 22. Larsen BA, Allison MA, Kang E, et al. Associations of physical activity and sedentary behavior with regional fat deposition. Med Sci Sports Exerc. 2013; 46(3): 520– 8. [DOI] [PMC free article] [PubMed] [Google Scholar]
- 23. Liao Y, Harada K, Shibata A, et al. Joint associations of physical activity and screen time with overweight among japanese adults. Int J Behav Nutr Phys Act. 2011: 8– 131. [DOI] [PMC free article] [PubMed] [Google Scholar]
- 24. Magliano DJ, Barr EL, Zimmet PZ, et al. Glucose indices, health behaviors, and incidence of diabetes in Australia: the Australian Diabetes, Obesity and Lifestyle Study. Diabetes Care. 2008; 31(2): 267– 72. [DOI] [PubMed] [Google Scholar]
- 25. Maher CA, Mire E, Harrington DM, Staiano AE, Katzmarzyk PT. The independent and combined associations of physical activity and sedentary behavior with obesity in adults: NHANES 2003–06. Obesity (Silver Spring). 2013; 21(12): E730– 7. [DOI] [PMC free article] [PubMed] [Google Scholar]
- 26. McGuire KA, Ross R. Incidental physical activity and sedentary behavior are not associated with abdominal adipose tissue in inactive adults. Obesity (Silver Spring). 2012; 20(3): 576– 82. [DOI] [PubMed] [Google Scholar]
- 27. Ogden CL, Carroll MD, Kit BK, Flegal KM. Prevalence of childhood and adult obesity in the United States, 2011–2012. JAMA. 2014; 311(8): 806– 14. [DOI] [PMC free article] [PubMed] [Google Scholar]
- 28. Owen N. Sedentary behavior: understanding and influencing adults’ prolonged sitting time. Prev Med. 2012; 55(6): 535– 9. [DOI] [PubMed] [Google Scholar]
- 29. Raynor DA, Phelan S, Hill JO, Wing RR. Television viewing and long-term weight maintenance: results from the National Weight Control Registry. Obesity (Silver Spring). 2006; 14(10): 1816– 24. [DOI] [PubMed] [Google Scholar]
- 30. Salmon J, Bauman A, Crawford D, Timperio A, Owen N. The association between television viewing and overweight among Australian adults participating in varying levels of leisure-time physical activity. Int J Obes Relat Metab Disord. 2000; 24(5): 600– 6. [DOI] [PubMed] [Google Scholar]
- 31. Salmon J, Owen N, Crawford D, Bauman A, Sallis JF. Physical activity and sedentary behavior: a population-based study of barriers, enjoyment, and preference. Health Psychol. 2003; 22(2): 178– 88. [DOI] [PubMed] [Google Scholar]
- 32. Saunders TJ, Tremblay MS, Després JP, Bouchard C, Tremblay A, Chaput JP. Sedentary behaviour, visceral fat accumulation and cardiometabolic risk in adults: a 6-year longitudinal study from the Quebec Family Study. PLoS One. 2013; 8(1): e54225. [DOI] [PMC free article] [PubMed] [Google Scholar]
- 33. Sternfeld B, Wang H, Quesenberry CP, Jr, et al. Physical activity and changes in weight and waist circumference in midlife women: findings from the Study of Women’s Health Across the Nation. Am J Epidemiol. 2004; 160(9): 912– 22. [DOI] [PubMed] [Google Scholar]
- 34. Sugiyama T, Healy GN, Dunstan DW, Salmon J, Owen N. Is television viewing time a marker of a broader pattern of sedentary behavior? Ann Behav Med. 2008; 35(2): 245– 50. [DOI] [PubMed] [Google Scholar]
- 35. Sugiyama T, Healy GN, Dunstan DW, Salmon J, Owen N. Joint associations of multiple leisure-time sedentary behaviours and physical activity with obesity in Australian adults. Int J Behav Nutr Phys Act. 2008; 5: 35. [DOI] [PMC free article] [PubMed] [Google Scholar]
- 36. Thorp AA, Healy GN, Owen N, et al. Deleterious associations of sitting time and television viewing time with cardiometabolic risk biomarkers: Australian Diabetes, Obesity and Lifestyle (AusDiab) study 2004–2005. Diabetes Care. 2010; 33(2): 327– 34. [DOI] [PMC free article] [PubMed] [Google Scholar]
- 37. Thorp AA, Owen N, Neuhaus M, Dunstan DW. Sedentary behaviors and subsequent health outcomes in adults a systematic review of longitudinal studies, 1996–2011. Am J Prev Med. 2011; 41(2): 207– 15. [DOI] [PubMed] [Google Scholar]
- 38. Timperio A, Salmon J, Bull F, Rosenberg M. Validation of Physical Activity Questions for Use in Australian Population Surverys. Canberra: Commonwealth Department of Aging; 2002. pp. 25– 7. [Google Scholar]
- 39. Walls HL, Stevenson CE, Mannan HR, et al. Comparing trends in BMI and waist circumference. Obesity (Silver Spring). 2011; 19(1): 216– 9. [DOI] [PubMed] [Google Scholar]
- 40. Ware JE, Jr, Sherbourne CD. The MOS 36-item short-form health survey (SF-36). I. Conceptual framework and item selection. Med Care. 1992; 30(6): 473– 83. [PubMed] [Google Scholar]
- 41. Whitlock G, Lewington S, Sherliker P, et al. Body-mass index and cause-specific mortality in 900 000 adults: collaborative analyses of 57 prospective studies. Lancet. 2009; 373(9669): 1083– 96. [DOI] [PMC free article] [PubMed] [Google Scholar]