

Abstract
Objectives:
To test whether change in fear-avoidance beliefs was a mediator of the effect of treatment on disability outcome, and to test an analytical approach, latent growth modeling, not often applied to mediation analysis.
Methods:
Secondary analysis was carried out on a randomized controlled trial designed to compare an intervention addressing fear-avoidance beliefs (n=119) with treatment as usual (n=121) for patients with low back pain, which found the intervention to be effective. Latent growth modelling was used to perform a mediation analysis on the trial data to assess the role of change in fear-avoidance beliefs on disability outcome. The product of coefficients with bias-corrected bootstrapped confidence intervals was used to calculate the mediating effect.
Results:
A statistically significant mediating effect of fear-avoidance beliefs on the effect of treatment on disability outcome was found (standardized indirect effect −0.35; bias-corrected 95% CI, −0.47 to −0.24). Poor fit of the model to the data suggested that other factors not accounted for in this model are likely to be part of the same mediating pathway.
Discussion:
Fear-avoidance beliefs were found to mediate the effect of treatment on disability outcome. Measurement of all potential mediator variables in future studies would help to more strongly identify which factors explain observed treatment effects. Latent growth modelling was found to be a useful technique to apply to studies of treatment mediation, suggesting that future studies could use this approach.
Key Words: mediation analysis, latent growth modeling, low back pain
Worldwide, the prevalence of low back pain (LBP) has been estimated to be 9.4% (95% confidence interval [CI], 9.0-9.8),1 with lifetime prevalence estimates of between 51% and 84%.2 In the UK, LBP has been found to affect between 49% and 80% of the population at some point in their lifetime, leading to high costs in terms of health care, workplace absence,3 and impact on individual quality of life.4 In the UK, musculoskeletal (MSK) conditions are predominantly managed in primary care, with back pain being the most common reason for patient health care visits.5 Although the prognosis of patients with an acute episode of LBP is often good,6,7 prognosis varies substantially for individual patients8 and persisting symptoms are reported by many patients up to a year after their initial consultation.6,8
Psychological factors (eg, fear-avoidance behaviors and beliefs,9–17 catastrophizing thoughts,9,18 self-efficacy,9,19 and depression9,11,14,20) have been found to be strong predictors of LBP outcomes and evidence suggests that they are potentially important in influencing the effect of treatment. Guidelines on the management of LBP also recommend screening for and management of psychological factors.21,22 However, it remains unclear how interventions addressing psychological factors improve patient outcomes,23 with mixed results being found in primary care populations in particular.24
To improve the effectiveness of future interventions, key factors explaining improved patient outcomes must be identified to guide interventions.25,26 These factors, known as treatment mediators, help explain how a treatment led to an effect on the outcome of interest27 by looking at which factors change as a result of treatment, which are then related to a change in the outcome.28,29
It has been acknowledged that just because a factor is prognostic (has been found to be related to outcome) does not mean it is necessarily causally related to outcome.24 Temporality (change over time) has been identified as fundamental characteristic used to determine whether a hypothesized treatment mediator is on a causal pathway.29,30,31 For example, we may hypothesize that a treatment designed to effect fear avoidance caused a reduction in fear-avoidance beliefs (FABs), which in turn led to an improvement in patient function. However, the improvement in function could have occurred first, which led to the reduction in FABs. Without serial measurement of both the proposed mediator and outcome, it is not possible to know the order in which the change occurred. To establish how changes in factors are related over time, at least 3 measurements should be taken over different time points.29 Typically in intervention studies, measures are only taken preintervention and postintervention, which only gives information on whether a change takes place or not, providing limited information about how a factor changes over time as a result of the intervention.
The Back In Action study32 compared a psychological intervention with treatment as usual in 240 patients with LBP. The intervention centered on addressing patient’s FABs and helping to improve their functioning. Measures of psychological factors and function were taken at baseline and at 4 follow-up points (2-, 6-, 12-, and 24-mo follow-up). The intervention was successful in reducing disability across all time points compared with the control group, with statistically significant differences observed between the 2 groups.32 The authors of the original study hypothesized that the proposed intervention led to a reduction in FABs and disability compared with usual care, but acknowledged that the results were not able to identify which part(s) of the intervention were most effective.
A mediation analysis therefore provides an ideal opportunity to test this potential treatment mechanism and determine whether reductions in fear had a significant influence within the pathway leading to improved disability outcomes in this trial. Latent growth modeling is a technique that allows the inclusion of multiple time points, thereby providing a more accurate estimate of change.33 The aim of the analyses reported in this paper was to test whether change in patients’ FABs mediated the relationship between their allocation to the active intervention and the change seen in disability in comparison with controls.
MATERIALS AND METHODS
Back In Action Intervention: Conceptual Model
The intervention used in the study was based on approaches described by Balderson et al,34 which includes assessing and addressing patients’ FABs, anxiety, and activity limitations, performing a clinical assessment to rule out red flags indicating the need for prompt medical intervention, and providing treatment recommendations in line with goals set by the patient. The intervention included 4 visits with a physiotherapist or psychologist to identify and address fears about pain, discuss activity and exercise goals, and develop an action plan to try and resume normal activities. Exercises provided were relevant to the patient’s action plan and progress was reviewed at the end of treatment. In addition to these visits, patients also received a book on back pain self-management (Moore et al 1999, cited in Von Korff et al32) and a 40-minute video on back pain (Patient Education Media Inc. 1996, cited in Von Korff et al32). The control group received treatment as usual, which was heterogenous including medications, physiotherapy, and a wide variety of other interventions. Full details of the original trial are provided elsewhere.32
Outcome Measure
LBP-specific disability was measured by the 23-item Roland-Morris Disability Questionnaire (RMDQ).35 A higher score is suggestive of increased disability. This tool has been found to have good test-retest reliability and internal consistency in a primary care LBP population.36,37 In the present study, Cronbach α showed that the 23-item RMDQ had good internal consistency (0.88).
Potential Mediator
FABs were measured using a modified version of the Tampa Scale for Kinesiophobia (TSK) that contained 10 of the original 17 items.38 The trial authors multiplied the mean item score by 17 (the number of items in the original tool) so that the scores from the shortened version could be compared with the original version. A higher score suggests increased FABs. This version of the TSK has not been widely tested in terms of its psychometric properties, and in the present study was found to have a Cronbach α value of 0.66, suggesting questionable internal consistency and also potentially weakened associations between this measure and measures of other variables in the analysis.
Statistical Analysis
Latent Growth Modelling
Latent growth modelling allows the examination of variables across time, both within and between participants.39–41 LGMs consist of an intercept latent factor and a slope latent factor.42 The intercept factor represents the starting point for the trajectory of a factor (its baseline status), whereas the slope represents the change in the trajectory of that factor over time. The use of the term “trajectory” in this context refers to the path each individual’s FABs and disability scores take over the measured time points. To correctly specify a LGM, factor loadings must be given to represent the intercept (usually all a value of 1, as this is the point at which each individual starts) and the slope factors (see below). LGMs can incorporate models where change is not linear and where assessment intervals are not equally spaced, provided that all participants have been assessed at the same time points.39,43 It is also possible to allow the model to estimate certain factor loadings when the trajectory of a measure is not clear.39 It should be noted that the factor loadings chosen are arbitrary and not reflective of actual score change on the measures included in the model.
Although in the present analysis it is the slope that is the factor of interest, the intercept is also important as where a person starts in an intervention will have an impact on their scores at subsequent points. Therefore, in this LGM, covariance between the intercept and slope factors was also included, as this gives an indication of whether people who start at a lower or higher score for the mediator or outcome change at lower or higher rates. To perform the analysis, 3 steps were carried out, which are outlined below.
Step 1: Investigate the Shape of the Observed Growth Trajectory (Change) for the Mediator and Outcome Variables
Change over time in both the mediator and outcome variables were estimated from the observed data, to ensure that the factor scores for the slope factor represented the observed trajectory and provided adequate fit to the data. This also allowed examination of differences in trajectories between the treatment and control groups, which was expected as the intervention had been shown to be effective.
Step 2: Combine the Trajectories of the Mediator and Outcome Variables
The LGMs of the mediator and outcome were combined into a single model so that the relationships with intervention allocation could be investigated.39 This is described as a parallel process model, where the observed trajectories of the 2 measured variables are viewed as 2 separate processes that occur over the same period of time.39 Including treatment group allocation as a covariate (control=0, intervention=1) enabled examination of the differences between scores in the intervention and control groups.
Step 3: Full Mediation Model and Estimates of Mediated Effect (With Bootstrapped CIs)
The parallel process model was then used to estimate the mediating effect of FABs on the association between treatment allocation and disability outcome using the product of coefficients approach, which is the analytical approach recommended for carrying out mediation analysis.39,44,45 The statistical interpretation of mediation analysis is made through separate effects (Fig. 3). The c path is the direct effect of treatment on outcome, before taking into account the effects of any specific mediating variables. Paths a and b make up the mediating pathway, with the mediating effect usually being described in the literature as the product of coefficients (a×b or ab).46 The ć path denotes the total effect of the whole model (ab+c). Bias-corrected bootstrapped CIs were estimated to account for the often non-normal distribution of the mediated effect and to provide an estimate of the precision of the mediated effect rather than just the statistical significance.46 In the present analysis, 1000 bias-corrected bootstrapped samples were used to estimate 95% CIs.
FIGURE 3.
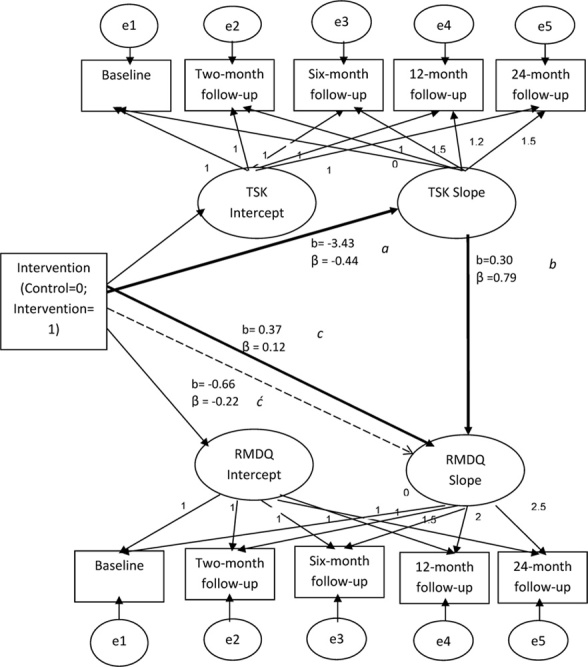
Full mediation model: change in fear-avoidance beliefs (10-item TSK) as a mediator between treatment allocation and change in disability outcome (23-item RMDQ). Total effects are taken from Table 5. β is standardized estimate; b, unstandardized estimate. RMDQ indicates Roland-Morris Disability Questionnaire; TSK, Tampa Scale for Kinesiophobia.
Model Fit
Model fit indices show how well the hypothesized model fits the observed data.47 In the present analysis, χ2, χ2 divided by degrees of freedom (χ2/df), Comparative Fit Index (CFI), Root Mean Square Error of Approximation (RMSEA), and Standardized Root Mean-square Residual (SRMR) were examined. Good or adequate fit is indicated by a nonsignificant χ2 value, a χ2/df of between 2 and 5, CFI of ≥0.96, and a RMSEA and SRMR of ≤0.08.43,48 No one fit index is seen as superior, and the exact cut-off values are subject to debate.44 It has therefore been recommended that overall judgment is made on the basis of several fit indices.33 If the goodness-of-fit indices did not indicate good fit, modification indices were examined to check whether the hypothesized model could be improved by adding or removing factor loadings on specified paths.43 Changes to the original model were only made if the modification made theoretical sense and substantially improved the model.43
Missing Data
Overall, follow-up rates in the original study were good with <30 participants lost to follow-up by 24 months in each group. Missing data were imputed using Expectation Maximization, a single imputation method suitable for use with small amounts of missing data.49 This method assumes data are missing at random, which was checked using Little’s MCAR (Missing Completely At Random) test,50 which will be nonsignificant if the data are MCAR. In addition to this test, baseline characteristics of responders and nonresponders (split to show treatment and control groups separately) were examined for baseline differences between participants who responded or did not respond at each time point (data not shown).
All analyses were carried out using Microsoft Excel, SPSS PASW Version 18 and AMOS Version 19.
RESULTS
Study Sample Descriptive Data
The Back In Action trial recruited 240 adult participants (119 in the treatment group and 121 in the control group) aged between 25 and 64 years, with chronic LBP, from primary care settings in Seattle, WA. Nonresponse bias analysis indicated that there were differences in baseline levels of pain intensity, FABs, disability, and pain duration between responders and nonresponders in the 2 treatment groups. FABs and disability scores in the treatment group were higher at baseline for those responding to earlier follow-up points and lower at baseline for those responding to later follow-up points. Pain duration in the treatment group was shorter at baseline for responders to follow-up compared with nonresponders.
The baseline characteristics of the study sample are provided in Table 1, and indicate that a slightly higher percentage of those in the treatment arm were female (65% compared with 60%) and also had a slightly longer duration of pain (110 d compared with 97 d). However, these differences were negligible and no other differences were seen between treatment and control for the other variables investigated. The mean (SD) scores for the potential mediator (TSK) and outcome variable (RMDQ) in the 2 intervention groups are given in Table 2. The observed trajectories of mean FABs and disability scores for the treatment and control groups based on all measured time points are presented in Figures 1 and 2. As expected, the biggest mean change in the intervention group was between baseline and the first follow-up point of 2 months for both the potential mediator (FABs) and the outcome variable (disability).
TABLE 1.
Baseline Characteristics of Study Population (n=240)
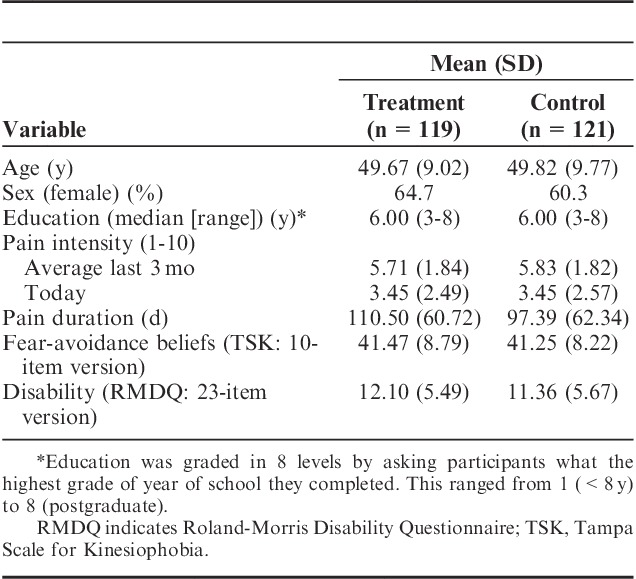
TABLE 2.
Changes Over Time (Means and SDs) for Potential Mediator and Outcome Variables in the Back In Action Trial
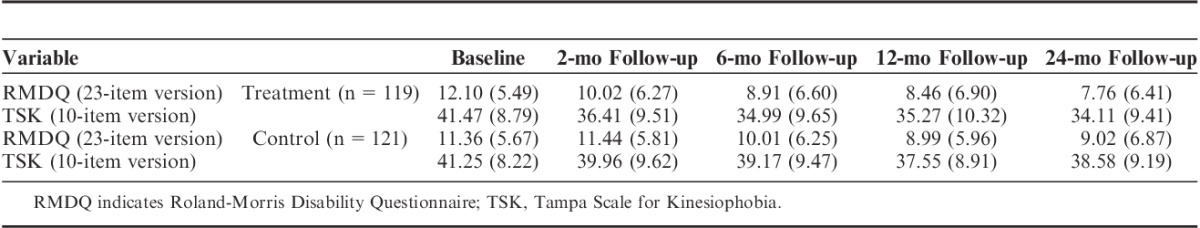
FIGURE 1.
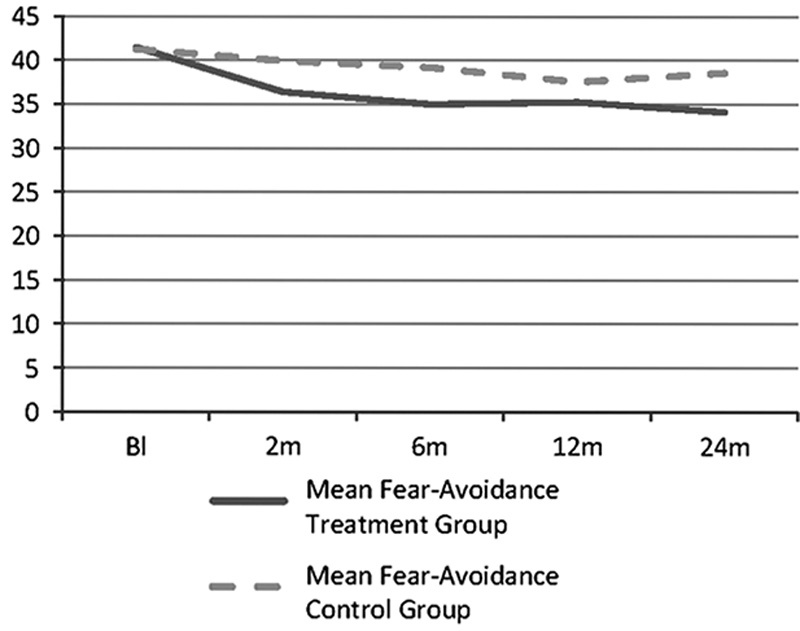
Course of 10-item TSK scores (mediator variable) for intervention and control groups over 2 years follow-up. TSK indicates Tampa Scale for Kinesiophobia.
FIGURE 2.
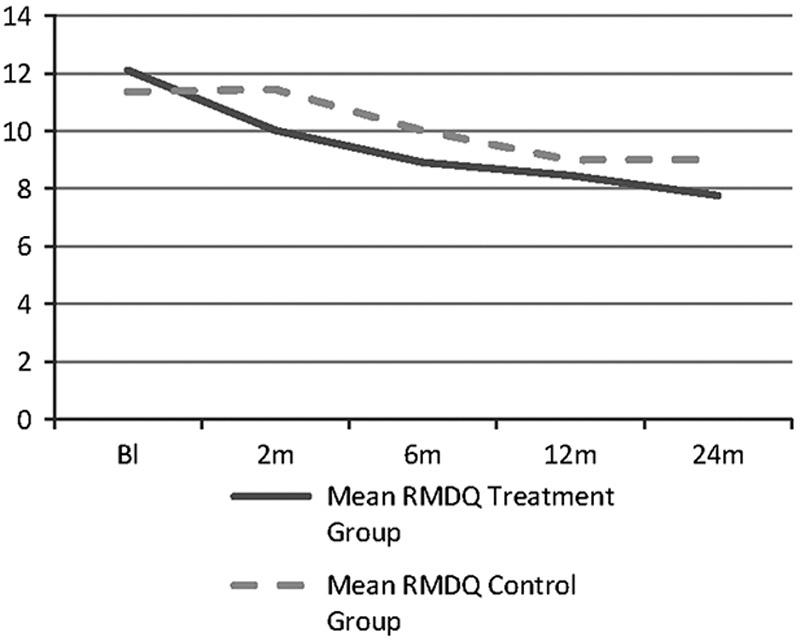
Course of 23-item RMDQ scores (outcome variable) for intervention and control groups over 2 years follow-up. RMDQ indicates Roland-Morris Disability Questionnaire.
The reduction in FABs and disability over the 2-month intervention period was smaller for the control group receiving usual care compared with the intervention group. The intervention group showed a linear decrease in disability scores compared with the control group, which showed no change in disability over the first 2 months and also no change between 12- and 24-month follow-up. The mean RMDQ scores at baseline showed a small difference (0.7 point) despite randomization.
Step 1
The nonlinear trajectories needed to be accounted for in the full LGM. The factor scores were therefore estimated based on the observed trajectories, taking into account the unequal measurement points. The factor scores were based on the observed trajectory for both the treatment and control groups combined, as the groups were compared using the covariate of treatment group allocation in the full mediation model. The factor scores for both the mediator and outcome trajectories provided adequate fit overall to the data, as indicated by the goodness-of-fit statistics (Fear-avoidance: χ142=62.53, P<0.05, χ2/df=4.47, CFI=0.95, RMSEA=0.12 [95% CI, 0.09-0.15], SRMR=0.05; Disability: χ142=49.95, P<0.05, χ2/df=3.57, CFI=0.96, RMSEA=0.10 [95% CI, 0.07-0.14], SRMR=0.04) and were therefore used in the subsequent analyses (Fig. 3). Although not every index suggested good fit, the judgment is based on the results of all the different indices taken together, so as the majority of indices suggested good or adequate fit, the trajectories were judged to be acceptable.
Step 2
The 2 separate models were then combined to test for covariances between each of the intercept and slope factors and explore how the potential mediator and outcome variables related to each other, before adding the intervention variable to complete the model. We assessed whether change in the potential mediator was related to change in the outcome variable. The model fit statistics indicated that the model provided fair fit to the data overall. Modification indices showed that allowing covariation between the error terms for the TSK and RMDQ 12-month follow-up scores and between the error terms for the TSK and RMDQ 2-month follow-up scores slightly improved model fit (χ492=154.88, P<0.05, χ2/df=3.16, CFI=0.94, RMSEA=0.10 [95% CI, 0.08-0.11], SRMR=0.05). As it is likely that each of the measurement points are related to each other, and that this may be reflected in related error variance,51 we decided that allowing these covariances made theoretical sense. Further modifications did not seem to be theoretically plausible and therefore no further changes to the model were made.
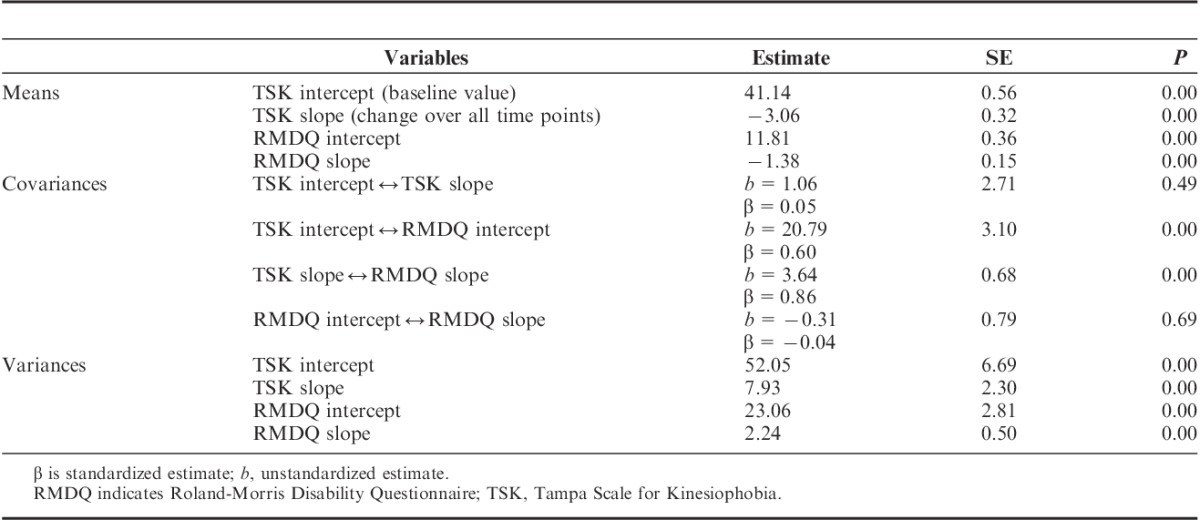
Table 3 gives the results of the means, covariances, and variances between the intercept and slope of each variable. The mean change in both TSK and RMDQ indicated a small, statistically significant decrease over time in both variables. The within-domain covariance, relating to the intercept and slope of the same construct,43 showed a positive estimate between TSK intercept and slope and a negative estimate between RMDQ intercept and slope. This suggested that people who scored highly on the TSK at baseline had a higher rate of decrease in scores than those who scored lower, whereas for the RMDQ, people who scored higher at baseline had a lower rate of decrease in scores. However, both of these estimates were very small and did not reach statistical significance. The between-domain covariances gave much higher, statistically significant values. The high value between the TSK and RMDQ slope factors suggested that as TSK scores change the RMDQ scores also change (an important prerequisite for mediation). The high value between the 2 intercepts suggested that people who scored highly on the TSK are likely to also score highly on the RMDQ. Finally, the variances for each latent factor indicated strong individual variation among participants, especially in the initial scores.
TABLE 3.
Means, Covariances, Correlations, and Variances Between Mediator and Outcome Variables
Treatment allocation was then added to the model as a covariate. The model provided a very similar fit to the data as the model without the treatment group allocation variable. Modification indices indicated that allowing covariation between the error terms for TSK and RMDQ scores at 12-month follow-up, TSK score at 12-month follow-up and RMDQ score at 2-month follow-up, and TSK and RMDQ scores at 2-month follow-up would result in a better fitting model (χ542=172.17, P<0.05, χ2/df=3.19, CFI=0.94, RMSEA=0.10 [95% CI, 0.08-0.11], SRMR=0.04). The covariation between TSK score at 12-month follow-up and RMDQ score at 2-month follow-up is less intuitive than covariances between the variables at the same time points, but could reflect a relationship between early change in disability and later change in FABs.
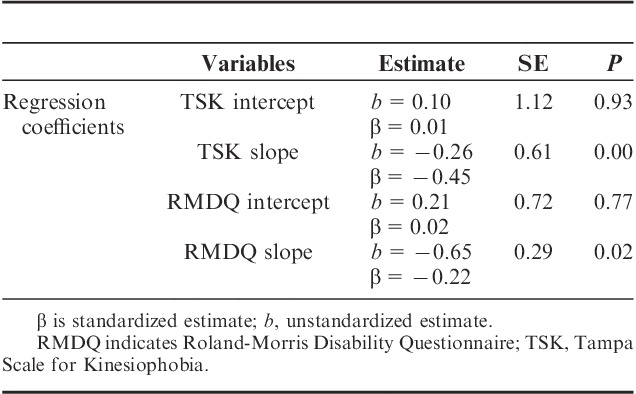
In the present analysis, the values of interest are the regression coefficients between treatment allocation and the slopes for the mediator and outcome.43 Allocation to the intervention group significantly predicted the rate of change for both the TSK and RMDQ measures (Table 4). The slope values for TSK and RMDQ suggest that change in the TSK and RMDQ measures was substantially higher in the intervention group, particularly for the change in TSK (−0.26 and −0.65 for TSK and RMDQ scores, respectively).
TABLE 4.
Mean Values for Mediator and Outcome, Related to Treatment Group Allocation
Step 3
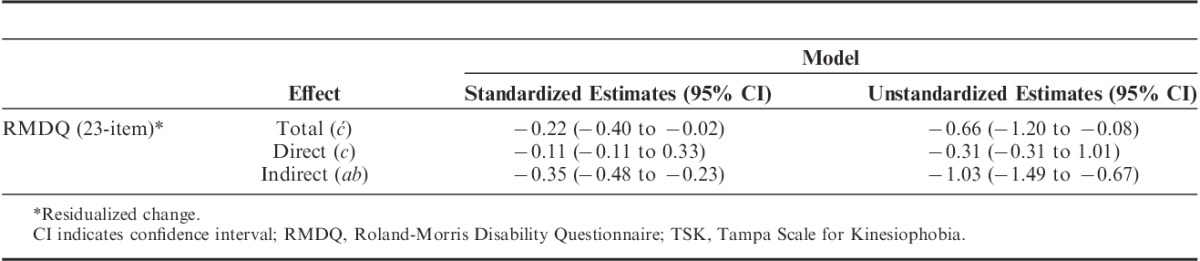
Finally, the full mediation model was tested by adding a path between the mediator and outcome variables. The bold lines in Figure 3 highlight the mediating pathway. Each of the β coefficients shown in this figure represent the direct effect of each variable on the other, as indicated by the direction of the arrow. The standardized coefficients show that the intervention is associated with a decrease in the TSK slope (−0.44) and that this decrease is associated with a decrease in the RMDQ slope (−0.79). Table 5 shows that the mediated effect (product of coefficients; in this case, −0.44×−0.79=−0.35 [95% CI, −0.47 to −0.24]) was statistically significant, indicating that differences between intervention and control in change in the observed trajectory of the FABs variable mediated some of the change in the observed trajectory of the outcome measure. However, none of the model fit statistics for this final model suggest that it provided a good fit to the data (χ632=1095.17, P<0.05, χ2/df=17.38, CFI=0.46, RMSEA=0.26 [95% CI, 0.25-0.28], SRMR=0.36) and modifying the model did not help to improve fit.
TABLE 5.
Mediating Effect of Change in Fear-Avoidance Beliefs (10-Item TSK) on the Relationship Between Treatment Allocation and Change in Disability (23-Item RMDQ)
DISCUSSION
The aim of this study was to use a more novel analytical approach to assessing mediation in an RCT dataset. We sought to test the study’s hypothesis that change in FABs explained the reduction in disability scores seen in the intervention arm of the trial (ie, that change in FABs was a mediator of the relationship between treatment allocation and disability improvement). The results of the analyses showed that there were associations between the intervention and change in FABs, and between change in FABs and change in disability. There was a significant mediating effect of change in FABs on the relationship between allocation to the active treatment and change in disability. This suggested that targeting FABs in an intervention for chronic LBP patients would be beneficial. However, the final mediation model provided a poor fit to the data. This means that the model as currently hypothesized does not fully explain how the treatment worked for this particular patient population, as there is key information missing. The study hypothesis, that allocation to the activation intervention arm was associated with a reduction in FABs and that this reduction was associated with a reduction in disability outcome, was therefore partially supported, but suggests that other mediating factors must be considered.
The Back In Action trial was a complex intervention, involving several sessions with a multidisciplinary team and several different components. Although several of these sessions did focus on reducing FABs, much of the intervention actually focused on goal setting and on plans to achieve those goals. These are likely to be highly variable depending on the individual patient, and could depend on factors such as self-efficacy or internal control, or the patient’s relationship with their therapist. A systematic review also found pain catastrophizing to be a potential mediator of treatment effect in interventions with a psychological component in noninflammatory MSK pain,52 although there has been some recent debate around this with robust mediation analysis finding contradictory results.53 Clearly further investigation of this factor is warranted. Both pain catastrophizing and FABs are key components of the Fear-Avoidance Model,54 which has been used extensively to explain the development of pain and disability in patients with MSK pain. However, although strong evidence exists for the predictive value of each of these model components,55,56 studies investigating the causal nature of these relationships have suggested that the model does not work in the hypothesized order.57,58 This model was not tested in full as part of the present study, but the results add to the evidence base for FABs being potential mediators of treatment outcome, even though the exact pathways through which this factor contributes has not been fully clarified as yet.
It could also be that the population included in the intervention did not score particularly highly on the FABs measure used, which would have limited the intervention’s ability to impact on patient scores. However, little information is available on an acceptable cut-off for a “high” TSK score. Previous studies using the Swedish and Dutch versions of the 17-item TSK have recommended a cut-off of 37 for “high” fear.54,59,60 In this study, the trial authors scored the 10-item TSK in a way that made it comparable with the 17-item version. If these cut-offs are applied to the present study, it would appear that both the treatment and control groups have high fear at baseline (mean score over 37), and whereas in the treatment group this score decreases (below 37 at each follow-up point), in the control group the scores at each follow-up point remain above this cut-off.
Comparison With Previous Literature
This analysis adds to a currently small evidence base for treatment mediators of LBP interventions, and is the first study, to the authors’ knowledge, that has used latent growth modelling for analyzing mediators in a LBP intervention study. Guidelines from previous LGM studies in other areas of health psychology were followed.39,61 A recent study also claimed to use Cheong and colleagues’ technique to carry out their mediation analysis on a RCT data from an intervention to prevent child behavioral problems,62 but although this study utilized LGMs they obtained their mediating effect using the Baron and Kenny63 approach rather than using the product of coefficients approach used in the present study. The latter approach is recommended in the wider mediation literature46 suggesting that it might represent stronger evidence of a mediated effect.
Potential Limitations
The technique of latent growth modelling used to carry out this analysis proved a useful, if complex, technique for mediation analysis. It offers the potential to address a key problem within current mediation studies, temporal sequencing, which is not currently adequately addressed.30–32 However, it must be acknowledged that latent growth modelling is a correlational technique and therefore it cannot be established whether the effect is in the hypothesized direction. The use of LGMs alone, as this study shows, cannot address temporal sequencing without including an adequate number of time points that will capture change when it occurs. In the present study, even though the Back In Action study collected data across 5 time points, it did not collect any data while the intervention was taking place. This limits the assessment of treatment-mediated effects as it is likely that the follow-up scores show a more diluted effect of the intervention than at the time of participants receiving it. The analyses presented here showed that change in both FABs and disability happens early on, but it is still not possible to see when these variables changed and crucially, which changed first. One way of potentially addressing this issue would have been to look at the intercept of the mediating variable and the slope of the outcome, rather than the slopes of both variables (to see whether baseline levels of FABs predict change in disability),64 but that would have been illogical in this analysis as the hypothesis was around change in the mediator and the outcome. Looking at change in the mediator at an earlier stage than change in the outcome is another option, but again not possible in this analysis as the first follow-up point was 2 months posttreatment, at which any change that was expected to happen in both the mediator and outcome variables would have already occurred. However, such analysis is possible using LGMs provided that there are enough time points to allow examination of early and later change. This again stresses the need for assessment points during treatment. This would of course need to be balanced with the consideration of response burden for participants and the potential for increased dropout this additional burden may cause.
The final mediation model was also found to be a poor fit to the data, suggesting other factors might be responsible for the treatment effect. We acknowledge that only testing a single potential mediator is limiting, and that other factors measured in the original study such as depression and anxiety could also be important potential mediators. However, these factors (and others, such as those mentioned earlier) were not considered as mediating factors in the original study, so they were not tested. It could be that the addition of other factors would have improved the fit of the model.
Implications for Clinical Practice and Research
Clinically, the findings from this study suggest that FABs play a role in the explanation of treatment outcome when a treatment specifically targets this factor. Future treatments should perhaps include only patients who are found to be highly fear avoidant, or tailor treatment to focus FAB reduction on patients who are most severe. However, this analysis represents only 1 study and more research is needed to support these findings, preferably research that accounts for the limitations discussed above. Few additional variables that could have played a key role in the success of this intervention (such as self-efficacy) were measured, and the role of other factors in this intervention are therefore unclear. Another concern is that the measure of FABs available in this dataset has not been validated previously, and its internal consistency in this dataset was questionable. A stronger measure of FABs, to ensure more confidence that this construct is indeed a mediator of outcome, is required in future studies.
To improve the delivery of future interventions, it would also be helpful to see which aspect of the intervention led to a change in FABs. For example, if this was after the first session, when fear of pain was explicitly discussed, it could be that this session was the one that was important in changing FABs. Measurements taken during the treatment period would give much more information on key variables that the intervention aimed to change, so that future interventions can be tailored to only include sessions found to impact on factors of importance.
CONCLUSIONS
The reduction of FABs through a multidisciplinary intervention was found to be a significant mediating factor for the reduction of disability in chronic LBP patients in the Back In Action Trial. This study therefore supports the role of training clinicians in being able to target FABs as part of their overall skillset. One key issue still not resolved by this study is that of temporality. Future studies of treatment mediation need to address temporal relationships by including measures of key mediators and outcomes during the treatment period, to more confidently ascertain when reductions in fear tend to occur and thereby inform clinicians about when FABs should be targeted within a course of treatment.
Footnotes
The views expressed in this publication are those of the authors and not necessarily those of the NHS, the NIHR, or the Department of Health.
This paper presents independent research funded by the National Institute for Health Research (NIHR) under its Program Grants for Applied Research Program (grant reference no. RP-PG-0707-10131). The data analyzed in this paper were collected with a research grant from the National Institute of Health (DE08773) to M.V.K. at Group Health Research Institute, Seattle, WA. J.C.H. is supported through a NIHR Research Professorship (NIHR-RP-011-015), which is held by Nadine Foster. The authors declare no conflict of interest.
REFERENCES
- 1.Hoy D, March L, Brooks P, et al. The global burden of low back pain: estimates from the Global Burden of Disease 2010 study. Ann Rheum Dis. 2014;73:968–974. [DOI] [PubMed] [Google Scholar]
- 2.Henschke N, Kamper SJ, Maher CG. The epidemiology and economic consequences of pain. Mayo Clin Proc. 2015;90:139–147. [DOI] [PubMed] [Google Scholar]
- 3.Wynne-Jones G, Cowen J, Jordan JL, et al. Absence from work and return to work in people with back pain: a systematic review and meta-analysis. Occup Environ Med. 2014;71:448–456. [DOI] [PMC free article] [PubMed] [Google Scholar]
- 4.Maniadakis N, Gray A. The economic burden of back pain in the UK. Pain. 2000;84:95–103. [DOI] [PubMed] [Google Scholar]
- 5.Jordan KP, Kadam UT, Hayward R, et al. Annual consultation prevalence of regional musculoskeletal problems in primary care: an observational study. BMC Musculoskelet Disord. 2010;11:144. [DOI] [PMC free article] [PubMed] [Google Scholar]
- 6.Menezes Costa L de C, Maher CG, Hancock MJ, et al. The prognosis of acute and persistent low back pain: a meta-analysis. CMAJ. 2012;184:E613–E624. [DOI] [PMC free article] [PubMed] [Google Scholar]
- 7.Pengel LHM, Herbert RD, Maher CG, et al. Acute low back pain: systematic review of its prognosis. BMJ. 2003;327:323. [DOI] [PMC free article] [PubMed] [Google Scholar]
- 8.Hayden JA, Dunn KD, van der Windt DA, et al. What is the prognosis of back pain? Best Pract Res Clin Rheumatol. 2010;24:167–179. [DOI] [PubMed] [Google Scholar]
- 9.Geisser ME, Robinson ME, Miller QL, et al. Psychosocial factors and functional capacity evaluation among persons with chronic pain. J Occup Rehabil. 2003;13:259–276. [DOI] [PubMed] [Google Scholar]
- 10.Lakke SE, Soer R, Takken T, et al. Risk and prognostic factors for non-specific musculoskeletal pain: a synthesis of evidence from systematic reviews classified into ICF dimensions. Pain. 2009;147:153–164. [DOI] [PubMed] [Google Scholar]
- 11.Linton SJ. A review of psychological risk factors in back and neck pain. Spine. 2000;25:1148–1156. [DOI] [PubMed] [Google Scholar]
- 12.Pincus T, Burton AK, Vogel S, et al. A systematic review of psychological factors as predictors of chronicity/disability in prospective cohorts of low back pain. Spine. 2002;27:E109–E120. [DOI] [PubMed] [Google Scholar]
- 13.Pincus T, Vogel S, Burton AK, et al. Fear-avoidance and prognosis in back pain: a systematic review and synthesis of current evidence. Arthritis Rheum. 2006;54:3999–4010. [DOI] [PubMed] [Google Scholar]
- 14.Ramond A, Bouton C, Richard I, et al. Psychosocial risk factors for chronic low back pain in primary care—a systematic review. Fam Pract. 2011;28:12–21. [DOI] [PubMed] [Google Scholar]
- 15.Verkerk K, Luijsterburg PAJ, Miedema HA, et al. Prognostic factors for recovery in chronic nonspecific low back pain: a systematic review. Phys Ther. 2012;92:1093–1108. [DOI] [PubMed] [Google Scholar]
- 16.Wertli MM, Rasmussen-Barr E, Weiser S, et al. The role of fear avoidance beliefs as a prognostic factor for outcome in patients with nonspecific low back pain: a systematic review. Spine J. 2014;14:816–836. [DOI] [PubMed] [Google Scholar]
- 17.Zale EL, Lange KL, Fields SA, et al. The relation between pain-related fear and disability: a meta-analysis. J Pain. 2013;14:1019–1030. [DOI] [PMC free article] [PubMed] [Google Scholar]
- 18.Wertli MM, Eugster R, Held U, et al. Catastrophizing—a prognostic factor for outcome in patients with low back pain: a systematic review. Spine J. 2014b;14:2639–2657. [DOI] [PubMed] [Google Scholar]
- 19.Jackson T, Wang Y, Wang Y, et al. Self-efficacy and chronic pain outcomes: a meta-analytic review. J Pain. 2014;15:800–814. [DOI] [PubMed] [Google Scholar]
- 20.Mallen CD, Peat G, Thomas E, et al. Prognostic factors for musculoskeletal pain in primary care: a systematic review. Br J Gen Pract. 2007;57:655–661. [PMC free article] [PubMed] [Google Scholar]
- 21.Koes BW, van Tulder M, Lin C-WC, et al. An updated review of clinical guidelines for the management of non-specific low back pain in primary care. Eur Spine J. 2010;19:2075–2094. [DOI] [PMC free article] [PubMed] [Google Scholar]
- 22.Mayer JM, Haldeman S, Tricco AC, et al. Management of chronic low back pain in active individuals. Curr Sports Med Rep. 2010;9:60–66. [DOI] [PubMed] [Google Scholar]
- 23.Linton SJ, Shaw WS. Impact of psychological factors in the experience of pain. Phys Ther. 2011;91:700–711. [DOI] [PubMed] [Google Scholar]
- 24.van der Windt D, Hay E, Jellema P, et al. Psychosocial interventions for low back pain in primary care. Lessons learned from recent trials. Spine. 2008;33:81–89. [DOI] [PubMed] [Google Scholar]
- 25.Keefe FJ, Rumble ME, Scipio CE, et al. Psychological aspects of persistent pain: current state of the science. J Pain. 2004;5:195–211. [DOI] [PubMed] [Google Scholar]
- 26.Smeets RJEM, Vlaeyen JWS, Keste ADM, et al. Reduction of pain catastrophizing mediates the outcome of both physical and cognitive-behavioural treatment in chronic low back pain. J Pain. 2006;7:261–271. [DOI] [PubMed] [Google Scholar]
- 27.Kraemer HC, Wilson GT, Fairburn CG, et al. Mediators and moderators of treatment effects in randomized clinical trials. Arch Gen Psychiatry. 2002;59:877–883. [DOI] [PubMed] [Google Scholar]
- 28.Kazdin AE. Mediators and mechanisms of change in psychotherapy research. Annu Rev Clin Psychol. 2007;3:1–27. [DOI] [PubMed] [Google Scholar]
- 29.Vlaeyen JWS, Morley S. Cognitive-behavioral treatments for chronic pain: what works for whom? Clin J Pain. 2005;21:1–8. [DOI] [PubMed] [Google Scholar]
- 30.Grice JW, Cohn A, Ramsey RR, et al. On muddled reasoning and mediation modeling. Basic Appl Soc Psychol. 2015;37:214–225. [Google Scholar]
- 31.Maric M, Wiers RW, Prins PJM. Ten ways to improve the use of statistical mediation analysis in the practice of child and adolescent treatment research. Clin Child Fam Psychol Rev. 2010;15:177–191. [DOI] [PMC free article] [PubMed] [Google Scholar]
- 32.Von Korff M, Balderson BHK, Saunders K, et al. A trial of an activating intervention for chronic back pain in primary care and physical therapy settings. Pain. 2005;113:323–330. [DOI] [PubMed] [Google Scholar]
- 33.Byrne BM, Lam WWT, Fielding R. Measuring patterns of change in personality assessments: an annotated application of latent growth curve modelling. J Pers Assess. 2008;90:536–546. [DOI] [PubMed] [Google Scholar]
- 34.Balderson BHK, Lin EHB, von Korff M.Asmundsen GJG, Vlaeyen JWS, Crombez G. The management of pain-related fear in primary care. Understanding and Treating Fear of Pain. Oxford: Oxford University Press; 2004:267–292. [Google Scholar]
- 35.Patrick DL, Deyo RA, Atlas SJ, et al. Assessing health-related quality of life in patients with sciatica. Spine. 1995;20:1899–1909. [DOI] [PubMed] [Google Scholar]
- 36.Dunn KM, Jordan K, Croft PR. Does questionnaire structure influence response in postal surveys? J Clin Epidemiol. 2003;56:10–16. [DOI] [PubMed] [Google Scholar]
- 37.Dunn KM, Cherkin DC. Letter to the editor: RMDQ-23. Spine. 2007;32:285–289. [Google Scholar]
- 38.Kori SH, Miller RP, Todd DD. Kinesiophobia: a new view of chronic pain behaviour. Pain Manag. 1990;3:35–43. [Google Scholar]
- 39.Cheong J, MacKinnon DP, Khoo ST. Investigation of mediational processes using parallel process latent growth curve modelling. Struct Equ Modeling. 2003;10:238. [DOI] [PMC free article] [PubMed] [Google Scholar]
- 40.Kosma M, Ellis R, Bauer JJ. Longitudinal changes in psychosocial constructs and physical activity among adults with physical disabilities. Disabil Health J. 2012;5:1–8. [DOI] [PubMed] [Google Scholar]
- 41.Witkiewitz K, Donovan DM, Hartzler B. Drink refusal training as part of a combined behavioral intervention: effectiveness and mechanisms of change. J Consult Clin Psychol. 2012;80:440–449. [DOI] [PMC free article] [PubMed] [Google Scholar]
- 42.Curran PJ, Muthén BO. The application of latent curve analysis to testing developmental theories in intervention research. Am J Community Psychol. 1999;27:567–595. [DOI] [PubMed] [Google Scholar]
- 43.Byrne BM. Structural Equation Modelling With AMOS: Basic Concepts, Applications, and Programming, 2nd ed London: Routledge; 2010. [Google Scholar]
- 44.Fritz MS, MacKinnon DP. Required sample size to detect the mediated effect. Psychol Sci. 2007;18:233–239. [DOI] [PMC free article] [PubMed] [Google Scholar]
- 45.Hayes AF, Scharkow M. The relative trustworthiness of inferential tests of the indirect effect in statistical mediation analysis: does method really matter? Psychol Sci. 2013;24:1918–1927. [DOI] [PubMed] [Google Scholar]
- 46.Hayes AF. Beyond Baron and Kenny: statistical mediation analysis in the new millennium. Commun Monogr. 2009;76:408–420. [Google Scholar]
- 47.Schermelleh-Engel K, Moosbrugger H, Müller H. Evaluating the fit of structural equation models: tests of significance and descriptive goodness-of-fit measures. Method of Psychological Research - Online. 2003;8:23–74. [Google Scholar]
- 48.Bentler PM. On tests and indices for evaluating structural models. Pers Indiv Differ. 2007;42:825–829. [Google Scholar]
- 49.Tabachnick BG, Fidell LS. Using Multivariate Statistics, 5th ed London: Pearson; 2007. [Google Scholar]
- 50.Little RJA. A test of missing completely at random for multivariate data with missing values. J Am Stat Assoc. 1988;83:1198–1202. [Google Scholar]
- 51.Campbell P, Bishop A, Dunn KM, et al. Conceptual overlap of psychological constructs in low back pain. Pain. 2013;154:1783–1791. [DOI] [PMC free article] [PubMed] [Google Scholar]
- 52.Mansell G, Kamper SJ, Kent P. Why and how back pain interventions work: what can we do to find out? Best Pract Res Clin Rheumatol. 2013;27:685–697. [DOI] [PubMed] [Google Scholar]
- 53.Lee H, McAuley JH, Hübscher M, et al. Does changing pain-related knowledge reduce pain and improve function through changes in castastrophizing? Pain. 2016;157:922–930. [DOI] [PubMed] [Google Scholar]
- 54.Vlaeyen JWS, Kole-Snijders AMK, Boeren RGB, et al. Fear of movement/(re)injury in chronic low back pain and its relation to behavioral performance. Pain. 1995a;62:363–372. [DOI] [PubMed] [Google Scholar]
- 55.Leeuw M, Goossens MEJB, Linton SJ, et al. The fear-avoidance model of musculoskeletal pain: current state of the scientific evidence. J Behav Med. 2007;30:77–94. [DOI] [PubMed] [Google Scholar]
- 56.den Hollander M, de Jong JR, Volders S, et al. Fear reduction in patients with chronic pain: a learning theory perspective. Expert Rev Neurother. 2010;10:1733–1745. [DOI] [PubMed] [Google Scholar]
- 57.Gheldof ELM, Crombez G, Van der Bussche E, et al. Pain-related fear predicts disability, but not pain severity: a path analytic approach to the fear-avoidance model. Eur J Pain. 2010;14:870e1–870e9. [DOI] [PubMed] [Google Scholar]
- 58.Wideman TH, Asmundson GGJ, Smeets RJEM, et al. Rethinking the fear-avoidance model: toward a multidimensional framework of pain-related disability. Pain. 2013;154:2262–2265. [DOI] [PMC free article] [PubMed] [Google Scholar]
- 59.Lundberg M, Larsson M, Östlund H, et al. Kinesiophobia among patients with musculoskeletal pain in primary healthcare. J Rehabil Med. 2006;38:37–43. [DOI] [PubMed] [Google Scholar]
- 60.Vlaeyen JWS, Kole-Snijders AMJ, Rotteveel AM, et al. The role of fear of movement/(re)injury in pain disability. J Occup Rehabil. 1995b;5:235–252. [DOI] [PubMed] [Google Scholar]
- 61.Roesch SC, Norman GJ, Adams MA, et al. Latent growth curve modelling of adolescent physical activity: testing parallel process and mediation models. J Health Psychol. 2009;14:313–325. [DOI] [PubMed] [Google Scholar]
- 62.Piehler TF, Bloomquist ML, August GJ, et al. Executive functioning as a mediator of conduct problems prevention in children of homeless families residing in temporary supportive housing: a parallel process latent growth modelling approach. J Abnorm Child Psychol. 2014;42:681–692. [DOI] [PMC free article] [PubMed] [Google Scholar]
- 63.Baron RM, Kenny DA. The moderator-mediator variable distinction in social psychological research: conceptual, strategic, and statistical considerations. J Pers Soc Psychol. 1986;51:1173–1182. [DOI] [PubMed] [Google Scholar]
- 64.Selig JP, Preacher KJ. Mediation models for longitudinal data in developmental research. Res Hum Dev. 2009;6:144–164. [Google Scholar]