Abstract
The long-lasting neuromodulatory effects of repetitive transcranial magnetic stimulation (rTMS) are of great interest for therapeutic applications in various neurological and psychiatric disorders, due to which functional connectivity among brain regions is profoundly disturbed. Classic TMS studies selectively alter neural activity in specific brain regions and observe neural activity changes on nonperturbed areas to infer underlying connectivity and its changes. Less has been indicated in direct measures of functional connectivity and/or neural network and on how connectivity/network alterations occur. Here, we developed a novel analysis framework to directly investigate both neural activity and connectivity changes induced by rTMS from resting-state EEG (rsEEG) acquired in a group of subjects with a chronic disorder of imbalance, known as the mal de debarquement syndrome (MdDS). Resting-state activity in multiple functional brain areas was identified through a data-driven blind source separation analysis on rsEEG data, and the connectivity among them was characterized using a phase synchronization measure. Our study revealed that there were significant long-lasting changes in resting-state neural activity, in theta, low alpha, and high alpha bands and neural networks in theta, low alpha, high alpha and beta bands, over broad cortical areas 4 to 5 h after the last application of rTMS in a consecutive five-day protocol. Our results of rsEEG connectivity further indicated that the changes, mainly in the alpha band, over the parietal and occipital cortices from pre- to post-TMS sessions were significantly correlated, in both magnitude and direction, to symptom changes in this group of subjects with MdDS. This connectivity measure not only suggested that rTMS can generate positive treatment effects in MdDS patients, but also revealed new potential targets for future therapeutic trials to improve treatment effects. It is promising that the new connectivity measure from rsEEG can be used to understand the variability in treatment response to rTMS in brain disorders with impaired functional connectivity and, eventually, to determine individually tailored stimulation parameters and treatment procedures in rTMS.
Index Terms: Connectivity, dysconnectivity disease, independent component analysis (ICA), mal de debarquement syndrome (MdDS), neuromodulation, phase, repetitive transcranial magnetic stimulation (rTMS)
I. Introduction
Transcranial magnetic stimulation (TMS) has proven to be an important neural stimulation tool in investigating the pathophysiological bases of neurological and psychiatric conditions [1]. It can be used to modulate cortical excitability using either inhibitory low-frequency (≤1 Hz) or facilitatory high-frequency stimulation (≥5 Hz) [1]–[3]. The effects of TMS can be observed not only in local areas at the stimulation site, but also in remote, anatomically and/or functionally connected sites [1], [2], [4]. The effects of TMS in remote cortical structures are of therapeutic interest, since deep brain and certain neocortical structures that exhibit more individual variations are difficult to accurately and efficiently target with surface stimulation. Moreover, repetitive TMS (rTMS) can induce robust and long-lasting effects (outlasting the stimulation period) [4], especially at low-frequency stimulation. Thus, there is great interest in the therapeutic applications of rTMS in neurological and psychiatric disorders [5]–[7].
A variety of methods have been introduced to measure the neuromodulatory effects of TMS. Electromyography (EMG) has been mainly used with single- and paired-pulse TMS to investigate normal and/or impaired motor cortical excitability [8] and various EMG measures [8] have been developed in single-pulse TMS paradigms (motor evoked potential, MEP; resting/active motor threshold, MT and cortical silent period, CSP) and in paired-pulse TMS paradigms (short-interval intracortical inhibition/facilitation, SICI/ICF; short-latency/long-latency afferent inhibition; and transcallosal inhibition). Altered values of these measures have been reported in neurological and psychiatric disorders [8]. The major drawback of the TMS-EMG protocol is that the intervention and read-out is largely limited to the motor cortex (M1) and only in a few brain disorders there have been clear neuropathological evidence of a direct link to motor dysfunction [9]–[11]. Studies of M1 cannot be simply translated to other cortical structures due to differences in cortical architecture, neuron density, and receptor distribution, which might cause different neuromodulation responses [8].
Recent developments that combine TMS and functional neuroimaging techniques, including electroencephalography (EEG) [12]–[16], functional magnetic resonance imaging (fMRI) [17]–[21], and positron emission tomography (PET) [22], have extended the investigation of modulation of cortical excitability to regions other than M1. In particular, the TMS-EEG protocol has been extensively used to assess neuromodulation effects in occipital [23], parietal [24], premotor [25], and dorsolateral pre-frontal cortices (DLPFC) [12], [26], in addition to M1 [13], [14]. Accordingly, many TMS-EEG measures have been proposed to elucidate cortical excitatory and inhibitory changes. As an example, the long-interval cortical inhibition (LICI) measure has been used to assess TMS stimulation responses in DLPFC [27] and other cortical regions [28]. It revealed deficits of cortical inhibition in the gamma frequency band at DLPFC in schizophrenia patients [29]. TMS-EEG measures have been derived from evoked potentials (EPs), such as fronto-central gamma-band EP in schizophrenia patients [15] and P30 in Alzheimer patients [30]. EEG spectral power difference before and after TMS is the most widely used measure, especially when resting-state EEGs (rsEEGs) are being investigated [12], [13], [15]. Some of these studies indicate that long-lasting effects of rTMS can be induced in areas outside the motor cortex, adding evidence beyond from behavioral [31], [32] and clinical effects [5], [33].
Recently, accumulating evidence suggest that functional connectivity, especially resting-state functional connectivity, is profoundly altered in many neurological and psychiatric disorders [8], [34]–[36], i.e., a category of diseases involving dysconnectivity [6], [37]. A technique that is sensitive enough to detect early and subtle functional connectivity changes in these disorders would thus be important in the diagnosis and eventual treatment of these disorders. While the TMS measures discussed earlier imply certain functional connectivity and network changes, most of them do not directly measure changes or alterations in networks. The tools to directly map functional connectivity and to develop network measures in studying their changes under various conditions (healthy, diseased and/or TMS stimulated) would be of both theoretical and eventual practical utility. It has been suggested that network measures are more sensitive clinical biomarkers for dysconnectivity diseases [34], that they can better predict stimulation outcomes [38], [39], and that network-guided stimulation treatments lead to better outcomes [40]. Recent studies using resting-state fMRI (rsfMRI) [17]–[19], [21] have shown different excitatory/inhibitory effects of rTMS between the stimulated and functionally connected regions. Early EEG studies have used coherence as a connectivity measure with increased coherence indicating inhibitory rTMS effects in resting state [14], [41] and under tasks [25]. These network measures highlight the possibility of extending TMS measures to investigate functional connectivity and network changes.
In this study, we developed a novel rsEEG analysis framework to study neural activity changes (using spectral power) and connectivity changes (using phase coherence) after the application of rTMS. We evaluated these two measures at the component level of rsEEG signals, as decomposed from group-level independent component analysis (ICA) [42], [43]. Our method addressed the volume conduction effect [44] in EEG channel signals, and thus avoided false positives in identifying significant rsEEG connectivity (e.g., coherence) due to volume conduction. Since these EEG network measures were computed from rsEEG data, we expected that our capability of detecting significant network structural and connectivity changes would be similar to those measured from rsfMRI [17]–[20].
We applied this new TMS-EEG protocol to a chronic neurological disorder of imbalance, called mal de debarquement syndrome (MdDS) [45]. MdDS is a disorder caused by entrainment to background oscillating environments in which individuals experience a persistent sensation of low frequency rocking dizziness after disembarking from a moving vessel such as a boat or a plane. In some rare individuals, as those investigated in this study, this rocking dizziness lasts for months or years. Inner ear function testing and structural brain imaging are normal in MdDS [45]. However, fluorodeoxyglucose PET and rsfMRI data have revealed resting-state metabolic and functional connectivity differences in MdDS individuals compared to healthy controls [35], which can be used to study the proposed connectivity measure in this new TMS-EEG protocol. We chose MdDS patients also because the disorder appears to be one of abnormal neuroplasticity that is not related to organ damage, which is optimal in studying functional connectivity changes rather than those due to structural alterations. Furthermore, the perception in MdDS can be modulated by moving subjects passively, such as driving [45], which suggests that a similar effect might potentially be achieved by external brain modulation. Our pilot study [33] showed that the rocking perception of MdDS can be acutely modified by rTMS over DLPFC.
Many studies have investigated short-term EEG changes induced by single session rTMS with effects lasting up to 90 min [46]. Since acute changes can be affected by nonspecific rTMS related factors like pain, fatigue, and anxiety, in this study, we were particularly interested in measuring more remote effects of rTMS that would be indicative of actual neuromodulation [1]. The rsEEG data in this study were thus recorded 4 to 5 h after the last rTMS session at the end of a consecutive five-day protocol [33]. We hypothesized that rTMS targeted at DLPFC might generate long-lasting effects on networks broader than those regions specifically related to the treatment of MdDS since the same stimulation protocol has been used for other disorders [12], [26], [27]. Therefore, we not only correlated rsEEG changes to the direction and magnitude of symptom changes that subjects reported during the course of their treatment, but also compared rsEEG measures before and after five rTMS sessions using the group of subjects as a whole without distinguishing symptom improvement and/or worsening.
II. Materials and Methods
A. Subjects
Patients with a history of persistent MdDS meeting the following criteria were recruited through a university neurology clinic as well as an advertisement on the MdDS Balance Foundation website (www.mddsfoundation.org): 1) a chronic perception of rocking dizziness that started after disembarking from sea, air, or land based travel; 2) symptoms lasting at least six months to avoid any possibility of a spontaneous remission during the trial [45]; 3) no other cause for symptoms after evaluation by an experienced neurotologist (Y.H.C); 4) no contraindications to receiving rTMS including pregnancy, medications that lower seizure threshold, or a personal or family history of seizures; 5) at least 18 years old.
Ten right-handed women (age: 47.6 ± 10.7 yrs) with persistent MdDS lasting from 8 to 91 (40.5 ± 24.2) months participated in the study. Though there was no gender exclusion in recruitment, MdDS is significantly more prevalent in women [45] and so this composition was not unexpected. Symptoms were triggered by sea travel in four subjects, air travel in three subjects, land travel in two subjects, and an amusement park ride in one subject. Written informed consent was obtained from participants before the start of all procedures, and the study was approved by Western IRB. Subjects completed the Edinburgh Handedness Inventory [47].
B. rTMS Sessions
Prior to the rTMS treatment, subjects underwent a magnetization-prepared rapid acquisition with gradient echo (MPRAGE) scan on a General Electric (GE) Discovery MR750 3 T MRI whole-body scanner (GE Healthcare, Milwaukee WI, USA). The MPRAGE images were used for neuronavigation during the treatment sessions.
Each subject underwent five sessions of rTMS on five consecutive days. The Localite TMS Navigator (Localite GmBH, Germany) frameless stereotaxy system was used for neuronavigation to identify the middle of the middle frontal gyrus, which is the center of the DLPFC. Navigation was used throughout the procedure to ensure consistent targeting. rTMS was performed with the Magventure MagPro X100 stimulator with a cooled figure-of-eight coil. Motor thresholding was performed each day with independent measurements made for both the right and left M1 hand areas. MTs were defined as the percent intensity of the stimulator output that generated a 50 μV MEP in the contralateral abductor pollicis brevis muscle in five out of ten trials.
Each rTMS session consisted of a standard protocol of 1 Hz right DLPFC stimulation at 110% of MT for 1200 pulses (20 min) followed by 10 Hz left DLPFC stimulation at 110% MT for 2000 pulses (25 min). The 10 Hz protocol was administered as trains of 40 pulses over 4-s followed by 26 s of rest, i.e., each train was 30 s. Fifty 10 Hz trains were administered at each session. Subjects were seated in a recliner in a quiet room with their eyes open. Subjects rated the degree of their MdDS symptoms on a visual analogue scale (VAS) of 0–100 each day, where 0 was complete suppression of symptoms. The change in the VAS from Day 1 to 5 was used as the measure of symptom change.
C. EEG Recording and Preprocessing
rsEEG was recorded in two 5-min sessions: one before the subjects received their first TMS treatment on Day 1 (the pre-TMS rsEEG session) and another 4 to 5 h after the last TMS session on Day 5 (the post-TMS rsEEG session). 126-channel EEG signals were recorded using a BrainAmp amplifier (Brain Products GmbH, Munich, Germany). The online reference channel was located at the FCz position, while the ground electrode was located at the AFz position. The impedance of all electrodes was maintained below 10 kΩ during recordings. EEG signals were recorded at a sampling frequency of 1000 Hz with an analog filter (from 0.016 to 250 Hz) and a resolution of 0.1 μV. Subjects were siting in a recliner quietly with eyes closed in a quiet darkened room when rsEEG data were recorded.
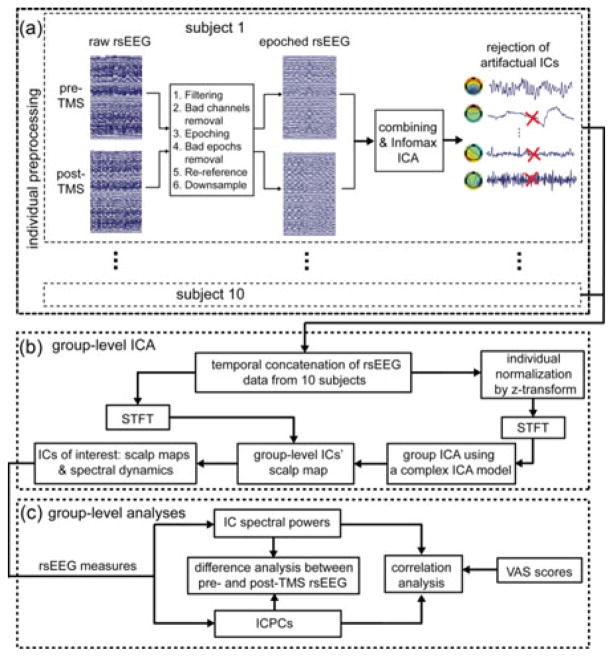
The preprocessing steps for each individual subject are depicted in Fig. 1(a). First, a bandpass filter of 0.5–30 Hz was performed on pre- and post-TMS rsEEG data separately from each subject. Second, bad channels were detected using an automatic method from the FASTER toolbox [48] integrated in EEGLAB [49], as well as by visual inspection. rsEEG data on bad channels and at the channel FCz were then interpolated from neighboring channels using the EEGLAB toolbox [49]. Third, rsEEG data were segmented into 1-s epochs with bad epochs identified and removed using the FASTER toolbox. In these FASTER processes, the statistical threshold was selected at Z-score >3 for each metric used [48]. Finally, rsEEG data were rereferenced to an arithmetically derived common average and downsampled to 250 Hz. After these steps, the resulting rsEEG epochs from pre- and post-TMS rsEEG sessions of each individual subject were concatenated for an Infomax ICA [49] to reject additional artifacts [see Fig. 1(a)]. rsEEG data from each subject were decomposed into 64 independent components (ICs); those ICs linked to ocular, cardiac, and muscular activity were rejected. The purpose of combining pre- and post-TMS rsEEG data before ICA-based artifact rejection was to avoid possible spectral power differences between them due to different numbers of artifact-related ICs being rejected if processed separately. After all processes were performed on all subjects, an average of 291 (SD: 15) epochs for each rsEEG session was obtained for each subject.
Fig. 1.
Block diagram of the analysis process: (a) preprocessing steps from raw rsEEG to artifacts-rejected rsEEG epochs for individual subjects, (b) steps to calculate spatial patterns and spectral dynamics of ICs of interest using a group-level ICA, and (c) group-level analyses examining the effects of rTMS treatment on neural activity and connectivity.
D. Group-Level ICA Analysis
To obtain dissociable rsEEG patterns linked to distinct neural substrates over all subjects, a group-level ICA scheme was employed [see Fig. 1(b)]. Preprocessed rsEEG epochs from individual subjects were separately normalized using a z-transform to reduce intersubject variations, and then temporally concatenated. These concatenated time-domain 1-s epoch data were converted into a 3-D time–frequency representation (TFR) (X̂ ∈ CNc ×Nf ×NT ) using a short-time Fourier transform (STFT), where Nc, Nf, and NT denote the number of channels (i.e., 126 plus the interpolated FCz), the number of frequency bins (i.e., 27 bins from 4 to 30 Hz with a resolution of 1 Hz), and the number of epochs (i.e., 5827 epochs from ten subjects each with two rsEEG sessions), respectively. Thereafter, the 3-D complex-valued TFR data were rearranged into a 2-D matrix X̃ ∈ CNc ×(NfNT) by mixing samples in temporal and spectral domains, and fed into a complex ICA model [42], [43] as follows:
| (1) |
where A ∈ RNc ×Ns is the real-valued mixing matrix, S̃ ∈ CNs ×(NfNT) is the IC source activation matrix, and Ns denotes the number of ICs (i.e., 25). After the group-level ICA decomposition, the spatial patterns (columns of A) of the group-level ICs were obtained. Their spectral dynamics were calculated from STFT-transformed temporally concatenated rsEEG epochs (without z-transform) using the unmixing matrix (A−1 ), and reorganized into pre-and post-TMS sessions for each individual.
From the resulted 25 group-level ICs, 13 ICs were identified based on their spatial-spectral patterns, i.e., spatial patterns approximately explained by dipolar sources [50] and/or spectral powers with evident peak(s) in theta, alpha, and/or beta bands, after excluding those ICs related to nuisance processes (e.g., eye movement and residue muscle activity). Epoch-wise spectral dynamics of 13 ICs were then used to compute rsEEG measures as discussed next [see Fig. 1(c)].
E. Spectral Domain rsEEG Measures
Two rsEEG measures, i.e., spectral powers of individual ICs and inter-IC phase-based coherences (ICPCs) [49] of any pair of two different ICs (i.e., 78 pairs from 13 ICs), were computed and statistically compared in the contrast of pre- and post-TMS rsEEGs [see Fig. 1(c)].
Spectral power
For both pre- and post-TMS sessions, spectral powers at four frequency bands, i.e., theta (4–7 Hz), low alpha (8–10 Hz), high alpha (11–13 Hz), and beta (14–30 Hz) band, were obtained by averaging spectral powers over the frequency bins in each band. The statistical difference between pre- and post-TMS rsEEGs at each frequency band was examined [see Fig. 1(c)] by a paired t test (two-tailed) for each IC, with the significant level set at p < 0.05.
Phase coherence
ICPC was employed to detect the connectivity between two functional brain regions (i.e., two ICs) [49], which is calculated as follows:
| (2) |
where n is the number of epochs, and φj (f,e) and φk (f,e) are the phases from the eth epoch of jth and kth ICs at the frequency f. If the phases of two ICs fluctuate in synchrony over time courses (i.e., epochs), the difference between them would be a constant and the ICPC value is close to 1. Otherwise, it would be close to 0. As in the analysis of spectral power, ICPC differences between pre- and post-TMS rsEEGs were also examined at the same four frequency bands [see Fig. 1(c)]. We first tested whether ICPCs obtained in each rsEEG session (separately for pre- and post-TMS rsEEGs) were significantly different from zero (null hypothesis for no significant connections) using one-sample t-tests (two-tailed), and those significant connections obtained were used to form neural networks in each condition. The significant level was set to p < 0.01 with Bonferroni correction (divided by the number of IC pairs, 78). Thereafter, the ICPC differences between pre- and post-TMS sessions at four frequency bands were examined by a paired t test (two-tailed) only in cases with at least one significant ICPC (p < 0.01, corrected) in either pre- or post-TMS rsEEG. The significant level was set to p < 0.05.
F. Relationship Between rsEEG Measures and VAS Scores
To investigate the relationship between rsEEG measures and changes in symptoms [see Fig. 1(c)], the differences in spectral power and ICPC between pre- and post-TMS rsEEGs at the four frequency bands of individual ICs were correlated to VAS score changes from pre- to post-TMS tests using a cross-subject Pearson correlation analysis. The correlation coefficients (CCs) with p < 0.05 were considered to be significant. Similarly, the correlation analyses involving ICPC were only conducted in cases with at least one significant ICPC in either pre- or post-TMS rsEEG. The directions of changes in both rsEEG measures and VAS scores were investigated to further verify the correspondence between electrophysiological and symptom changes. Since the number of ICPC changes was relatively large, the directions of ICPC changes of individuals were investigated using metrics concerning total ICPC changes. First, subjects were categorized, based on VAS score changes, into positive (reduced at least 10 points), neutral (less than 10 points), and negative groups (increased at least 10 points). Second, the connections that indicated significant CCs from the correlation analysis earlier were tested in individual subjects to identify a subset of connections that show significant ICPC changes (p < 0.01, corrected) from pre- to post-TMS rsEEG for each subject. The direction of ICPC changes of each subject in three groups was then evaluated using two metrics computed from the subset of connections: 1) fraction of connections of reduced ICPCs; and 2) sum of ICPC changes.
III. Results
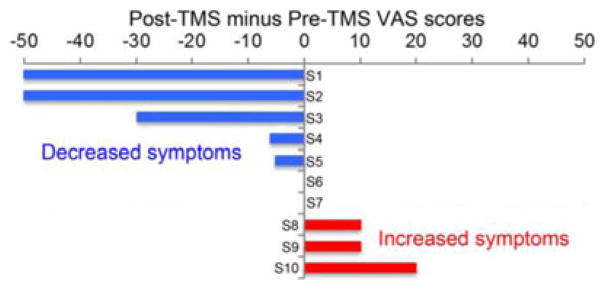
Edinburgh handedness scores ranged from 40 to 100 (mean: 86; median: 95), indicating overall strong right-hand dominance in patients. A range of symptom changes was reported in this cohort of ten subjects (see Fig. 2). A minimum of a 10-point change in the VAS was required to be considered either a positive or negative response. According to this categorization criterion, three subjects (S1, S2, and S3) were in the positive responder group, three subjects (S8, S9, and S10) were in the negative responder group, and the remaining subjects (S4, S5, S6, and S7) were in the neutral group.
Fig. 2.
Summary of VAS score changes over ten subjects.
A. ICs of Interest
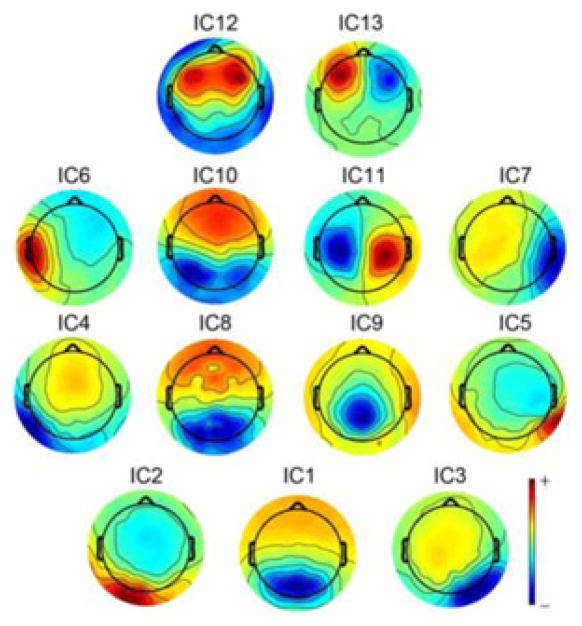
Thirteen ICs (see Fig. 3) were identified with typical spatial-spectral patterns (labeled as ICk, k = 1. . .13), which were consistent with previously reported IC patterns from rsEEG [43], [51]–[53]. IC1 indicates an occipital topography over the primary visual cortex. IC2 and IC3 show the left and right occipital topographies, respectively, over the lateral primary visual cortex. IC4 and IC5 indicate the left and right occipital topographies, respectively, which are toward the temporal cortex and cover the secondary visual cortex. These five ICs to a large extent correspond to the visual resting-state networks (RSNs) identified in fMRI [51]. IC6 and IC7 indicate the left and right temporal topographies, respectively, covering the left and right secondary somatosensory cortex [43]. IC8 indicates the most complex pattern among all ICs and resembles the IC that has been identified in a recent study [51], showing the significant correlation to the default mode network (DMN) from fMRI [51]. IC9 indicates a typical parietal topography over the parietal cortex. IC10 shows the patterns over both left and right central sulcus (CS) in the primary motor cortex. IC11 indicates a dipolar pattern over the central medial region, which corresponds to the supplementary motor area. Both IC12 and IC13 indicate prefrontal topographies, while IC12 shows a symmetrical distribution over the left and right DLPFC and IC13 shows a distribution over the medial prefrontal cortex. Note that the left and right symmetric patterns are sometimes detected in combination [51] or separately [52], [53].
Fig. 3.
Scalp maps of 13 ICs of interest.
It is noted that IC1 to IC7 are all related to sensory functions involved in processing motion information, which is of particular interest since many symptoms in MdDS appear to involve abnormal motion information processing [35]. Moreover, the posterior parietal cortex (IC9) has also been reported to involve motion processing [35]. IC12 is of interest since it overlaps the rTMS stimulation sites over DLPFC.
B. Spectral Power Differences Between Pre- and Post-TMS rsEEG
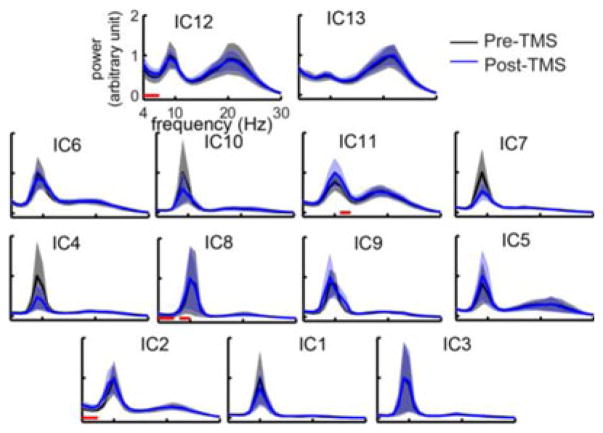
All 13 ICs had alpha peaks in both pre- and post-TMS rsEEG data, while IC13 exhibited the most diminished peak (see Fig. 4). The two prefrontal ICs (IC12 and IC13) and one motor component (IC11) indicated another peak in the beta band. While no spectral peaks in the theta band were evident, the two prefrontal ICs had more elevated theta power in the entire spectral power distributions as compared with other ICs.
Fig. 4.
Grand averaged spectral powers of 13 ICs over ten subjects for pre-and post-TMS sessions. Red lines denote the frequency bands of significant power differences (p < 0.05). Solid lines: mean powers; shaded areas: SEM.
Only four out of 13 ICs indicated spectral power differences in at least one of the four frequency bands examined. In IC2, IC8, and IC12, a significant theta power difference between pre- and post-TMS rsEEG (p < 0.05; Fig. 4) was revealed, with enhanced theta powers in post-TMS rsEEG in all three ICs. IC8 further revealed significantly higher spectral power in the low alpha band (p < 0.05) in post-TMS rsEEG than pre-TMS rsEEG (see Fig. 4), which might be extended from the theta band power difference. IC11 indicates significantly higher spectral power in the high alpha band (p < 0.05) in post-TMS rsEEG than pre-TMS rsEEG (see Fig. 4).
C. Relationship Between Spectral Power Changes and VAS Score Changes
The significant correlations between spectral power changes and VAS score changes were only revealed in two ICs (IC2 and IC9) (see Fig. 5). IC2 showed the significant negative correlations in the high alpha (CC = −0.64; p < 0.05) and beta bands (CC = −0.73; p < 0.02) [see Fig. 5(a)]. IC9 indicated a significant positive correlation in the beta band (CC = 0.67; p < 0.05) [see Fig. 5(b)]. Most subjects from the positive group and negative group indicate opposite directions of changes in both spectral power and VAS score, and all subjects from the neutral group show small changes.
Fig. 5.
Scatter plots of significant cross-subject correlations between spectral power changes and VAS score changes from pre- to post-TMS sessions: (a) significant correlations in high alpha and beta bands from IC2, and (b) significant correlations in beta band from IC9. Red crosses denote coordinate origins; black lines are regressed lines; and blue, black, and red dots indicate subjects from positive, neutral, and negative groups, respectively.
Comparing the ICs showing significant rTMS effects (see Fig. 4) and the ICs showing significant correlations to VAS scores (see Fig. 5), only one IC overlapped (IC2). However, if specific frequency band changes are also taken into consideration, no IC overlapped in these two investigations.
D. ICPC Differences Between Pre- and Post-TMS rsEEG
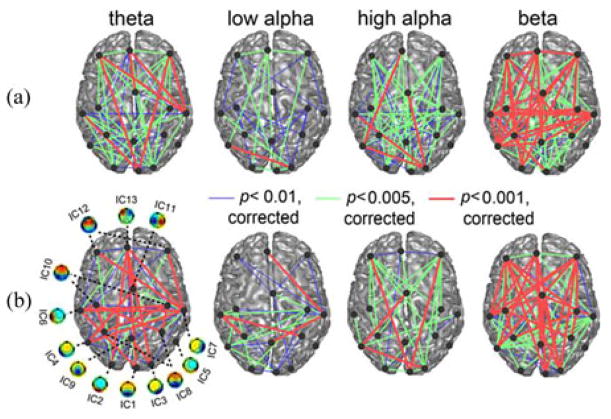
Both pre- and post-TMS rsEEGs indicate a network of significant connections (as measured by ICPC) among 13 ICs in multiple frequency bands (see Fig. 6). Note that those ICs with symmetric left and right distributions (IC8, IC10, and IC12) are represented by two dots (with each on one hemisphere) and thus the total number of nodes in Fig. 6 is 16. The numbers of significant connections (p < 0.01, corrected) in the beta band in both pre- and post-TMS rsEEGs were the highest ones among all frequency bands, as well as the numbers of the most significant connections (p < 0.001, corrected). The low alpha band had the least number of significant connections and the smallest number of the most significant connections. Based on visualization, long connections over different lobes (e.g., among the prefrontal, temporal, parietal, and occipital lobes) and connections between homologous structures in both hemispheres were present (e.g., in the temporal, parietal, and occipital lobes) in all frequency bands and in both pre- and post-TMS rsEEGs. The only obvious missing significant connections were between the frontal lobe and the temporal lobe in the high alpha band in both pre- and post-TMS rsEEGs. The most significant connections within the frontal lobe seemed to be only in the beta band. Importantly, the numbers of significant connections in all frequency bands were less in post-TMS rsEEGs than in pre-TMS rsEEGs.
Fig. 6.
Significant ICPCs (p < 0.01, corrected) in the four frequency bands from both pre-TMS (a) and post-TMS (b) sessions.
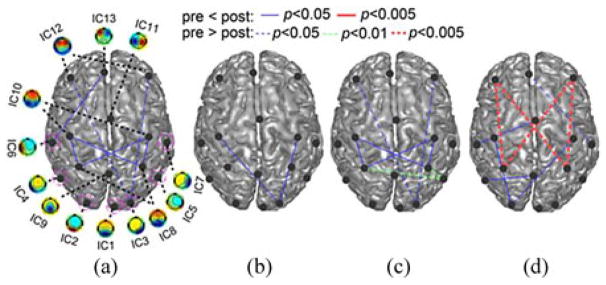
Fig. 7 shows the quantitative results of connectivity differences between pre- and post-TMS rsEEGs. The most significant ICPC decrease (p < 0.005) appeared in the beta band between the prefrontal and parietal lobes (between IC12 and IC8). There were more modestly significant ICPC decreases (p < 0.01) between IC8 and IC5 in the high alpha band. Other significant ICPC decreases (p < 0.05) were between IC3 and IC12 in both the theta and high alpha bands and between IC7 and IC13 in the beta band. Two significant ICPC increases (p < 0.05) were between IC8 and IC10 in both theta and high alpha bands. Other significant ICPC increases were all between a sensory related area [circled in Fig. 7(a)] and a nonsensory related area (not circled). In sum, there were total 12 significant connectivity changes, four of them involving DLPFC with decreased connectivity and five involving the parietal lobe.
Fig. 7.
Significant ICPC differences (p < 0.05) between pre- and post-TMS sessions identified in (a) theta band, (b) low alpha band, (c) high alpha band, and (d) beta band. Circles mark sensory function related ICs. Dashed lines: reduced connections; solid lines: enhanced connections.
E. Relationship Between ICPC Changes and VAS Score Changes
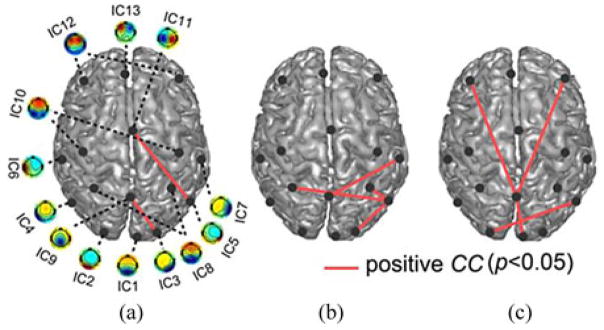
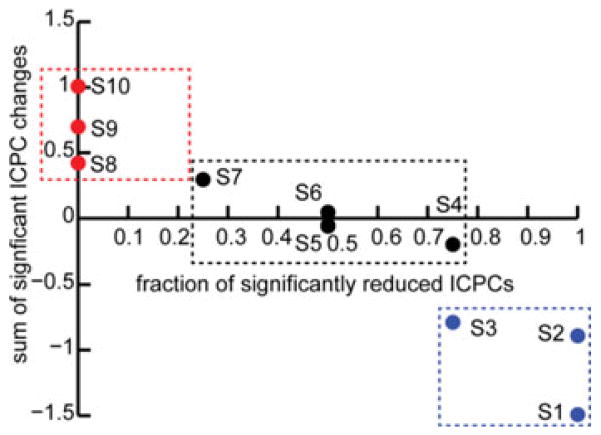
Eight significant correlations (p < 0.05) between the ICPC changes and the VAS score changes from pre- to post-TMS session were revealed in the theta [see Fig. 8(a)], low alpha [see Fig. 8(b)], and high alpha [see Fig. 8(c)] bands, but none in the beta band. Most of the significant correlations (p < 0.05) involved ICs from the parietal lobe (five involving either IC8 or IC9) and sensory-related areas (seven involving either IC1, IC2, IC3, IC5, or IC7). The only significant correlation involving the prefrontal lobe was linked to the parietal lobe (between IC9 and IC12). It is important to note that all significant correlations were positive, meaning that the coherences among these areas decreased as the VAS score decreased, i.e., symptoms improved. Fig. 9 exhibited that all subjects from the positive group and negative group exhibited opposite direction of changes, and all subjects from the neutral group showed smaller changes than subjects from other two groups.
Fig. 8.
Significant cross-subject correlations (p < 0.05) between ICPC changes and VAS score changes from pre- to post-TMS sessions in (a) theta, (b) low alpha, and (c) high alpha bands.
Fig. 9.
Directions of ICPC changes in subjects from positive (blue dots), neutral (black dots), and negative groups (red dots) using two metrics: 1) x-axis: number of negative significant ICPC changes over total number of significant ICPC changes; 2) y-axis: sum of all significant ICPC changes.
While ICs showing many significant connectivity changes from pre- to post-TMS sessions (see Fig. 7) were from the prefrontal lobe in the theta, high alpha, and beta bands, ICs showing significant correlations with VAS scores (see Fig. 8) were mainly from the parietal lobe and sensory-related areas in the theta and low and high alpha bands. No IC pair overlapped in both investigations.
IV. Discussion and Conclusion
In this study, we developed novel rsEEG measures of neural activity and connectivity in evaluating lasting modulation effects induced by rTMS in a group of MdDS patients. First, we characterized the resting-state activity of multiple functional brain areas identified in a data-driven blind source separation analysis (i.e., ICA) from rsEEG data. We then characterized the RSNs defined by the connectivity among these brain areas. We studied the resting-state activity and connectivity changes in these brain areas before and after consecutive days of rTMS in an attempt to capture neuromodulation effects. We further correlated these changes to clinical symptom changes. We demonstrated that there are significant changes in resting-state neural activity (see Fig. 4) and neural networks (see Fig. 7) over broad cortical areas before and after rTMS. We further showed that the changes in the parietal and occipital lobes (see Figs. 5 and 8) were significantly correlated to the clinical effects between pre-and post-TMS sessions.
While TMS effects from classical measures have successfully elucidated the pathophysiology of various neurological and psychiatric disorders [54], [55], they also appear to be non-specific [4]. For example, many different disorders can exhibit the same kind of abnormalities [55] and disorders without clear motor cortex pathology have been found to exhibit abnormal motor cortical excitability [56]. This can be due to the nonspecific nature of TMS stimulation itself, the particular stimulation paradigm utilized, or because only indirect TMS effects are being measured. Specifically, some classical TMS measures (e.g., MEP and CSP) only investigate peripheral output system changes (e.g., muscles) to study corresponding brain areas (e.g., the motor cortex) [8]; some investigate hypothetical connectivity changes between the stimulation site and remote areas by comparing only neural activity changes at these areas using different conditions as contrasts (e.g., pre- and poststimulation, real and sham stimulations, and with and without stimulation) [12], [13]; and some from paired-pulse stimulation paradigms (e.g., SICI and LICI) depend on transiently altered interactions in pretargeted brain areas [8]. All these investigational means are limited in their capabilities of evaluating complex network/connectivity changes. On the other hand, while it is still uncertain, dysconnectivity diseases are likely driven by alterations in normal neurophysiological connectivity [57], e.g., synaptic plasticity or developmental wiring [58]. While the mechanisms of the lasting modulation effects of rTMS are also unclear, long-term potentiation [59] and depression [60] of cortical synapses have been suggested, which is also related to connectivity changes. These findings suggest that understanding the lasting neuromodulation effect of rTMS and its potential to affect dysconnectivity diseases requires directly mapping neural connectivity structures. Novel network measurements that can detect dynamic connectivity changes among various brain regions are needed in order to understand the neuromodulatory effect of rTMS.
The rsEEG connectivity analysis we developed in this study involved constructing neural connectivity maps (see Fig. 6) and detecting dynamic connectivity changes before and after rTMS (see Figs. 7 and 8). Results from the connectivity measure indicate that the human brain is highly functionally connected across hemispheres and various cortical lobes over multiple frequency bands in the resting state, regardless of the pre- or post-TMS condition (see Fig. 6). This finding was consistent with other rsEEG studies in healthy subjects [52], [53] and rsfMRI studies in both healthy subjects [61] and patients [34]. More importantly, it also revealed significant connectivity changes specific to the clinical effect of rTMS in our patients (see Fig. 8). Finally, it is worth noting that the advantage of measuring network changes from rsEEG over those from rsfMRI are twofold: 1) EEG has much higher temporal resolution than fMRI (milliseconds versus seconds), which provides significantly better capability of detecting dynamic connectivity changes; and 2) BOLD fMRI is an indirect measure of neural activity, which is complicated by other system variations (e.g., respiration) [62], as compared with a primary neural response measured in EEG.
Another EEG measure (i.e., IC spectral power) was also used in this study to evaluate neural activity changes after rTMS sessions. While both EEG measures indicated consistent patterns in general, the ICPC measure seemed to be more sensitive. For example, in Figs. 4 and 7, both measures revealed significant changes over broad cortical areas after rTMS sessions (including the frontal, central, parietal, and occipital areas) but the ICPC measure also indicated the involvement of the temporal area. In Figs. 5 and 8, both measures revealed that major significant correlations against VAS scores were from the parietal (particularly IC9) and occipital areas. The ICPC measure further indicated involvement of more areas within the occipital area, and some significant connectivity changes involving DLPFC (IC12) and DMN (IC8) (see Fig. 8).
It is hypothesized that the imbalance sensation in MdDS patients is caused by a poorly regulated network that involves reduced prefrontal connectivity and increased connectivity in parietal, temporal, and occipital areas for motion processing [35]. The EEG changes specific to symptom changes suggest a beta power decrease in the parietal area (IC9) and an alpha power increase in the left lateral primary visual area (IC2) (see Fig. 5). The symptom-specific network changes indicate all positive (no negative) correlations to VAS score changes mainly over the occipital, temporal, and parietal areas (see Fig. 8). In summary, when the symptom improves, in above areas, cortical inhibition increases (alpha power) whereas cortical activations (beta power) and functional connectivity decreases, which can be interpreted as suppressed motion processing in these areas. However, the beta band EEG power increases in IC2 along with VAS score decreases [see Fig. 5(a)] was an exception to this pattern. One of the limitations in this study is the lack of Sham stimulation as a control due the rareness of the disease [45]. Therefore, we further investigated the direction of changes in two rsEEG measures (see Figs. 5 and 9). It is suggested that the direction of changes (i.e., decreased, almost none, and increased changes) in both spectral power and ICPC correspond to the direction of changes in VAS scores (i.e., positive, neutral, and negative, respectively). While the number of subjects in each group is limited, it provides evidence that these EEG changes are induced by rTMS, which can be further verified in future studies with more subjects.
It is interesting that the patterns related to general changes and those related to symptom-specific changes in rsEEG measures do not overlap. This is because subjects with different symptom changes were grouped together in the investigation of rsEEG changes before and after rTMS. The different treatment responses might be caused by the symptom severity and duration of MdDS subjects [33]. As indicated in Fig. 2, the numbers of subjects in positive, negative, and neutral groups are almost equal, and the symptom-specific rsEEG changes (see Fig. 9) at the group level can be largely canceled out due to the opposite directions of changes in the positive and negative groups and almost zero changes in the neutral group. The detection of these nonspecific rsEEG changes suggests that more general and broader neural modulation effects might result from rTMS over DLPFC, which is why DLPFC has been targeted by rTMS in various psychiatric disorders [12], [26], [27]. More importantly, the detection of symptom-specific changes not only suggests that rTMS can generate positive treatment effects in MdDS patients, but can also reveal potentially new targets in future therapeutic trials to improve treatment effects. DLPFC was selected as the target area for rTMS in this study because rTMS over this area was shown to acutely decrease the sensation of low frequency oscillation in MdDS [33], [63]. An important finding in our study is that while many connectivity changes were observed in the prefrontal area after rTMS, they were not significantly correlated to symptom changes. Interestingly, those connectivity changes within motion processing areas were significantly correlated to symptom changes (see Fig. 8). These facts suggest that the parietal and occipital areas may be additional or even better targets for rTMS in treating MdDS patients. Also interestingly, while more significant connections in the resting brain were in the theta and beta bands (see Fig. 6), the most significant connectivity changes related to symptom changes were in the alpha band (see Fig. 8). It is consistent with the fact that many TMS-EEG studies have yielded results in alpha oscillation changes [23].
In contrast to previous TMS-EEG studies [12], [13], [15], we examined oscillatory neural activity and connectivity changes from rTMS in multiple resting-state neural substrates at the IC level. Compared to the channel-level analysis, applying ICA to rsEEG data has the following advantages. First, ICA addresses the volume conduction issue [44] that reduces crosstalk in EEG data from different neural sources and avoids false detection of coherence. Second, locations of neural sources underlying individual ICs can be inferred from their spatial patterns and have been well reported in the literature. However, it should be noted that the source localization capability of ICA, as compared with fMRI, is still limited since it does not directly reconstruct sources inside the human brain, which might produce ambiguities in the interpretation of IC sources. As an example, while differences can be observed, IC8 and IC10 show similar spatial patterns in many aspects. This problem can be further addressed by EEG source imaging technologies [64], [65] and one of our works has demonstrated the capability of reconstructing RSNs from EEG alone [66]. Third, ICA can resolve oscillatory activity and obtain their patterns with high sensitivity that is otherwise difficult to measure directly at the channel level, particularly from rsEEG [53]. Finally, we adopted a newly developed complex ICA strategy built from our previous study [43]. Complex ICA methods have demonstrated better capability in detecting neural components over artifactual components than time-domain ICAs [42]. While the phase coherence was first used to measure interchannel synchrony caused by external [49] and internal events [67], [68], as well as in resting-state data [69], its use on ICs from event-related potentials has also been suggested [49]. In this study, we extended its use on ICs obtained from rsEEG data. While most previous studies use magnitude correlation to investigate connectivity among ICs [70], phase synchrony represents another important mechanism of communication in the human brain [71]. Due to the enforced constraint on detecting ICs, i.e., maximal statistical independence, synchronized sources might be detected in one IC (such as IC10 and IC12, in which left and right components from symmetric structures in both hemispheres are indicated) or in different ICs but showing significant coherences (see Fig. 6). Therefore, rsEEG changes in both activity and connectivity have been investigated in this study considering that the activity of individual ICs might suggest network changes too.
The use of the combination stimulation protocol in this study was based on a pilot study in investigating the role of rTMS in the treatment of MdDS [33]. This pilot study determined that high-frequency left DLPFC stimulation was overall the most effective one in acutely reducing the rocking perception in MdDS and low-frequency right DLPFC stimulation was the second most effective one. A similar pattern has been reported in the treatment of depression using rTMS. While both protocols have been noted to be more effective than sham stimulation in inducing response and remission in depression, recent studies have shown that combining two protocols can be more efficient than unilateral stimulations in terms of number of pulses required and duration of sessions [72]. Theoretically, because of strong interhemispheric inhibition between the cerebral hemispheres [73], the net effect of low-frequency stimulation over the right DLPFC and high-frequency stimulation over the left DLPFC would synergistically act to reduce right DLPFC tone while increasing left DLPFC tone. Furthermore, since some patients may be left-sided responders while others are right-sided responders [33], this combined protocol would give all subjects the best chance at obtaining a clinical response.
Due to the rareness of MdDS [45], we only investigated ten subjects in this study. Thus, resting-state connectivity changes were not directly compared between responders and nonresponders. Instead, we used a correlation analysis and a direction analysis as surrogates which used the change in symptom score as a continuous or categorical variable. Sham group and more subjects are needed in future studies to further verify that rsEEG changes after rTMS are all induced by rTMS. With more subjects, issues, such as the relationship between treatment responses and symptom severity/duration, can be investigated. Furthermore, since there was only one EEG recording session after rTMS, time-varying features of positive neuromodulatory effects across hours and days cannot be studied. Multiple recording sessions after rTMS may provide more data in understanding long-lasting characteristics of rTMS effects. These should be addressed in a future study. Nevertheless, the technology presented here is to advance the capability of the TMS-EEG protocol in evaluating neuromodulatory effects of rTMS. It has the potential to contribute to the establishment of a closed-loop system that can deliver electrical and/or magnetic stimulation to dysconnectivity disorders, in which the measured neural activity and connectivity changes from rsEEG can be used to determine patient-tailored stimulation parameters and treatment procedures. This kind of feedback system may enhance understanding of the variability in treatment response to rTMS while providing individualized treatment targets. This study on MdDS disease demonstrates the merits for further investigation into developing novel TMS-EEG technologies.
Biographies

Lei Ding (S′02–M′07) received the B.E. degree (honors) from Zhejiang University, Hangzhou, China, in 2000, and the Ph.D. degree (Dissertation Fellow) from the University of Minnesota, Twin Cities, Minneapolis, MN, USA, in 2007, both in biomedical engineering.
He has been with the Faculty of the University of Oklahoma, Norman, OK, USA, as an Assistant Professor (since 2007) and Associate Professor (since 2013) at the School of Electrical and Computer Engineering and the Center for Biomedical Engineering.
He is also an Adjunct Associate Professor at the Laureate Institute for Brain Research, Tulsa, OK, USA. He has published more than 50 peer review papers in areas of neuroimaging and neural engineering. His current research interests include functional neuroimaging, neuromodulation, epilepsy, psychiatric disorders, cognitive engineering, neuroadaptive interface, and brain computer interface.
Dr. Ding is serving as an Associate Editor for IEEE Access and IEEE Transactions on Biomedical Engineering. He received the National Science Foundation CAREER Award and is the only recipient of the New Scientist Award from Oklahoma Center for the Advancement of Science and Technology at 2009. He is also listed in Who’s Who in America.
Guofa Shou (M′07) received the B.S. degree from Northwestern Polytechnical University, Xi’an, China, in 2004, and the Ph.D. degree from Zhejiang University, Hangzhou, China, in 2009, both in biomedical engineering.
From 2007 to 2008, he was a Visiting Scholar with the School of Information Technology and Electrical Engineering, University of Queensland, Australia. From 2008 to 2009, he was an Intern Researcher with Philips Research Asia-Shanghai. From 2009 to 2010, he was a Postdoctoral Fellow with Zhejiang University. Since 2010, he has been a Research Associate with the School of Electrical and Computer Engineering, University of Oklahoma, Norman, OK, USA. His research interest includes neuroimaging, neural signal processing, cardiac imaging, and bioelectromagnetism.

Han Yuan (S′05–M′11) received the B.S. degree from Tsinghua University, Beijing, China, in 2005, and the Ph.D. degree from the University of Minnesota, Minneapolis, MN, USA, in 2010, both in biomedical engineering.
She was a Postdoctoral Associate and currently a Staff Scientist at the Laureate Institute for Brain Research, Tulsa, OK, USA. Her research interests include multimodal functional neuroimaging, neural interfacing, and neuromodulation.

Diamond Urbano was born in San Diego, CA, USA, in 1989. She received the B.A. degree in psychology from Northeastern State University in Broken Arrow, Tahlequah, OK, USA, in 2013, where she assisted in research projects in relation to social psychology.
She is currently with the Transcranial Magnetic Stimulation Laboratory, Laureate Institute for Brain Research, Tulsa, OK, and plans to pursue graduate training in clinical psychology.
Ms. Urbano has been nominated for the Jack L. Haney Service Award and the Northeastern State University Hall of Fame. She has received the DELTA Discipline Award, DELTA Shining Star Award, as well as the Northeastern State University Outstanding Senior Award.

Yoon-Hee Cha received the B.S. degree in biology from Stanford University, Stanford, CA, USA, in 1995, and the M.D. degree from Mayo Medical School, Rochester, MN, USA, in 2001.
She is a Neurologist using functional imaging and neuromodulation to treat disorders of balance and motion perception. She completed her medical internship at the Brigham and Women’s Hospital in Boston, MA, in 2002 and completed her residency training in neurology at the University of California San Francisco from 2002 to 2005 during which time she was a Chief Resident from 2004 to 2005. She completed fellowship training in neurotology at the University of California Los Angeles from 2005 to 2007 after which time she joined the faculty and began work on functional imaging and neuromodulation methods. She is currently an Assistant Professor and Principal Investigator at the Laureate Institute for Brain Research, Tulsa, OK, USA, where she runs the Transcranial Magnetic Stimulation Laboratory.
Dr. Cha received the Howard Hughes-NIH Research Scholars Program Fellowship, the Harry Hoffman Humanitarian Award, the Philanthropic Educational Organization Award for Research, the American Academy of Neurology Clinical Research Training Award, the MdDS Balance Foundation Early Career Distinguished Investigator Award, and has been inducted into the National Organization of Rare Disorders Hall of Fame.
Footnotes
Color versions of one or more of the figures in this paper are available online at http://ieeexplore.ieee.org.
Contributor Information
Lei Ding, School of Electrical and Computer Engineering, Center of Biomedical Engineering, University of Oklahoma, Norman, OK 73019 USA and also with the Laureate Institute of Brain Research, Tulsa, OK 74136 USA.
Guofa Shou, School of Electrical and Computer Engineering, University of Oklahoma, Norman, OK 73072 USA.
Han Yuan, Laureate Institute of Brain Research, Tulsa, OK 74136 USA.
Diamond Urbano, Laureate Institute of Brain Research, Tulsa, OK 74136 USA.
Yoon-Hee Cha, Laureate Institute of Brain Research, Tulsa, OK 74136 USA.
References
- 1.Hallett M. Transcranial magnetic stimulation: A primer. Neuron. 2007;55:187–199. doi: 10.1016/j.neuron.2007.06.026. [DOI] [PubMed] [Google Scholar]
- 2.Di Lazzaro V, Dileone M, Pilato F, Capone F, Musumeci G, Ranieri F, Ricci V, Bria P, Di Iorio R, de Waure C, Pasqualetti P, Profice P. Modulation of motor cortex neuronal networks by rTMS: Comparison of local and remote effects of six different protocols of stimulation. J Neurophysiol. 2011;105:2150–2156. doi: 10.1152/jn.00781.2010. [DOI] [PubMed] [Google Scholar]
- 3.Noh NA, Fuggetta G, Manganotti P, Fiaschi A. Long lasting modulation of cortical oscillations after continuous theta burst transcranial magnetic stimulation. PLoS ONE. 2012;7(4):e35080. doi: 10.1371/journal.pone.0035080. [DOI] [PMC free article] [PubMed] [Google Scholar]
- 4.Kobayashi M, Pascual-Leone A. Transcranial magnetic stimulation in neurology. Lancet Neurol. 2003;2:145–156. doi: 10.1016/s1474-4422(03)00321-1. [DOI] [PubMed] [Google Scholar]
- 5.Dell’Osso B, Mundo E, D’Urso N, Pozzoli S, Buoli M, Ciabatti M, Rosanova M, Massimini M, Bellina V, Mariotti M, Altamura C. Augmentative repetitive navigated transcranial magnetic stimulation (rTMS) in drug-resistant bipolar depression. Bipolar Disorders. 2009;11:76–81. doi: 10.1111/j.1399-5618.2008.00651.x. [DOI] [PubMed] [Google Scholar]
- 6.Hasan A, Falkai P, Wobrock T. Transcranial brain stimulation in schizophrenia: Targeting cortical excitability, connectivity and plasticity. Curr Med Chem. 2013;20:405–413. [PubMed] [Google Scholar]
- 7.Jung S, Kim Y, Kim S, Paik N. Prediction of motor function recovery after sub-cortical stroke: Case series of activation PET and TMS studies. Ann Rehabil Med. 2012;36:501–511. doi: 10.5535/arm.2012.36.4.501. [DOI] [PMC free article] [PubMed] [Google Scholar]
- 8.Bunse T, Wobrock T, Strube W, Padberg F, Palm U, Falkai P, Hasan A. Motor cortical excitability assessed by transcranial magnetic stimulation in psychiatric disorders: A systematic review. Brain Stimulation. 2014;7(2):158–169. doi: 10.1016/j.brs.2013.08.009. [DOI] [PubMed] [Google Scholar]
- 9.Hasan A, Wobrock T, Grefkes C, Labusga M, Levold K, Schneider-Axmann T, Falkai P, Müller H, Klosterkötter J, Bechdolf A. Deficient inhibitory cortical networks in antipsychotic-naive subjects at risk of developing first-episode psychosis and first-episode schizophrenia patients: A cross-sectional study. Biol Psychiatry. 2012;72:744–751. doi: 10.1016/j.biopsych.2012.03.005. [DOI] [PubMed] [Google Scholar]
- 10.Nardone R, Bergmann J, Christova M, Caleri F, Tezzon F, Ladurner G, Trinka E, Golaszewski S. Short latency afferent inhibition differs among the subtypes of mild cognitive impairment. J Neural Transm. 2012;119:463–471. doi: 10.1007/s00702-011-0725-3. [DOI] [PubMed] [Google Scholar]
- 11.Levinson AJ, Fitzgerald PB, Favalli G, Blumberger DM, Daigle M, Daskalakis ZJ. Evidence of cortical inhibitory deficits in major depressive disorder. Biol Psychiatry. 2010;67:458–464. doi: 10.1016/j.biopsych.2009.09.025. [DOI] [PubMed] [Google Scholar]
- 12.Griskova I, Ruksenas O, Dapsys K, Herpertz S, Höppner J. The effects of 10 Hz repetitive transcranial magnetic stimulation on resting EEG power spectrum in healthy subjects. Neurosci Lett. 2007;419:162–167. doi: 10.1016/j.neulet.2007.04.030. [DOI] [PubMed] [Google Scholar]
- 13.Fuggetta G, Pavone EF, Fiaschi A, Manganotti P. Acute modulation of cortical oscillatory activities during short trains of high-frequency repetitive transcranial magnetic stimulation of the human motor cortex: A combined EEG and TMS study. Hum Brain Mapping. 2008;29:1–13. doi: 10.1002/hbm.20371. [DOI] [PMC free article] [PubMed] [Google Scholar]
- 14.Oliviero A, Strens LHA, Lazzaro V, Tonali PA, Brown P. Persistent effects of high frequency repetitive TMS on the coupling between motor areas in the human. Exp Brain Res. 2003;149:107–113. doi: 10.1007/s00221-002-1344-x. [DOI] [PubMed] [Google Scholar]
- 15.Ferrarelli F, Massimini M, Peterson MJ, Riedner BA, Lazar M, Murphy MJ, Huber R, Rosanova M, Alexander AL, Kalin N, Tononi G. Reduced evoked gamma oscillations in the frontal cortex in schizophrenia patients: A TMS/EEG study. Am J Psychiatry. 2008;165:996–1005. doi: 10.1176/appi.ajp.2008.07111733. [DOI] [PubMed] [Google Scholar]
- 16.Massimini M, Ferrarelli F, Huber R, Esser SK, Singh H, Tononi G. Breakdown of cortical effective connectivity during sleep. Science. 2005;309:2228–2232. doi: 10.1126/science.1117256. [DOI] [PubMed] [Google Scholar]
- 17.Vercammen A, Knegtering H, Liemburg EJ, Boer den JA, Aleman A. Functional connectivity of the temporo-parietal region in schizophrenia: Effects of rTMS treatment of auditory hallucinations. J Psychiatr Res. 2010;44:725–731. doi: 10.1016/j.jpsychires.2009.12.011. [DOI] [PubMed] [Google Scholar]
- 18.Grefkes C, Nowak DA, Wang LE, Dafotakis M, Eickhoff SB, Fink GR. Modulating cortical connectivity in stroke patients by rTMS assessed with fMRI and dynamic causal modeling. NeuroImage. 2010;50:233–242. doi: 10.1016/j.neuroimage.2009.12.029. [DOI] [PMC free article] [PubMed] [Google Scholar]
- 19.Eldaief MC, Halko MA, Buckner RL, Pascual-Leone A. Transcranial magnetic stimulation modulates the brain’s intrinsic activity in a frequency-dependent manner. Proc Nat Acad Sci USA. 2011;108:21229–21234. doi: 10.1073/pnas.1113103109. [DOI] [PMC free article] [PubMed] [Google Scholar]
- 20.Martin L, Borckardt JJ, Reeves ST, Frohman H, Beam W, Nahas Z, Johnson K, Younger J, Madan A, Patterson D, George M. A pilot functional MRI study of the effects of prefrontal rTMS on pain perception. Pain Med. 2013;14:999–1009. doi: 10.1111/pme.12129. [DOI] [PubMed] [Google Scholar]
- 21.Watanabe T, Hanajima R, Shirota Y, Ohminami S, Tsutsumi R, Terao Y, Ugawa Y, Hirose S, Miyashita Y, Konishi S, Kunimatsu A, Ohtomo K. Bidirectional effects on interhemispheric resting-state functional connectivity induced by excitatory and inhibitory repetitive transcranial magnetic stimulation. Hum Brain Mapping. doi: 10.1002/hbm.22300. published online 29 Jul. 2013. [DOI] [PMC free article] [PubMed] [Google Scholar]
- 22.Strafella AP, Paus T, Fraraccio M, Dagher A. Striatal dopamine release induced by repetitive transcranial magnetic stimulation of the human motor cortex. Brain. 2003;126:2609–2615. doi: 10.1093/brain/awg268. [DOI] [PubMed] [Google Scholar]
- 23.Thut G, Théoret H, Pfennig A, Ives J, Kampmann F, Northoff G, Pascual-Leone A. Differential effects of low-frequency rTMS at the occipital pole on visual-induced alpha desynchronization and visual evoked potentials. NeuroImage. 2003;18:334–347. doi: 10.1016/s1053-8119(02)00048-4. [DOI] [PubMed] [Google Scholar]
- 24.Klimesch W, Sauseng P, Gerloff C. Enhancing cognitive performance with repetitive transcranial magnetic stimulation at human individual alpha frequency. Eur J Neurosci. 2003;17:1129–1133. doi: 10.1046/j.1460-9568.2003.02517.x. [DOI] [PubMed] [Google Scholar]
- 25.Chen WH, Mima T, Siebner HR, Oga T, Hara H, Satow T, Begum T, Nagamine T, Shibasaki H. Low-frequency rTMS over lateral premotor cortex induces lasting changes in regional activation and functional coupling of cortical motor areas. Clin Neurophysiol. 2003;114:1628–1637. doi: 10.1016/s1388-2457(03)00063-4. [DOI] [PubMed] [Google Scholar]
- 26.Schutter DJ, van Honk J, d’Alfonso AA, Postma A, de Haan EH. Effects of slow rTMS at the right dorsolateral prefrontal cortex on EEG asymmetry and mood. Neuroreport. 2001;12(3):445–447. doi: 10.1097/00001756-200103050-00005. [DOI] [PubMed] [Google Scholar]
- 27.Farzan F, Barr MS, Levinson AJ, Chen R, Wong W, Fitzgerald PB, Daskalakis ZJ. Reliability of long-interval cortical inhibition in healthy human subjects: A TMS-EEG study. J Neurophysiol. 2010;104:1339–1346. doi: 10.1152/jn.00279.2010. [DOI] [PubMed] [Google Scholar]
- 28.Rosanova M, Casali A, Bellina V, Resta F, Mariotti M, Massimini M. Natural frequencies of human corticothalamic circuits. J Neurosci. 2009;29:7679–7685. doi: 10.1523/JNEUROSCI.0445-09.2009. [DOI] [PMC free article] [PubMed] [Google Scholar]
- 29.Farzan F, Barr MS, Levinson AJ, Chen R, Wong W, Fitzgerald PB, Daskalakis ZJ. Evidence for gamma inhibition deficits in the dorsolateral prefrontal cortex of patients with schizophrenia. Brain. 2010;133:1505–1514. doi: 10.1093/brain/awq046. [DOI] [PubMed] [Google Scholar]
- 30.Julkunen P, Jauhiainen AM, Kononen M, Paakkonen A, Karhu J, Soininen H. Combining transcranial magnetic stimulation and electroencephalography may contribute to assess the severity of Alzheimer’s disease. Int J Alzheimer’s Dis. 2011;2011 doi: 10.4061/2011/654794. Article ID 654794. [DOI] [PMC free article] [PubMed] [Google Scholar]
- 31.Kosslyn SM, Pascual-Leone A, Felician O, Camposano S, Keenan JP, Thompson WL, Ganis G, Sukel KE, Alpert NM. The role of area 17 in visual imagery: Convergent evidence from PET and rTMS. Science. 1999;284:167–170. doi: 10.1126/science.284.5411.167. [DOI] [PubMed] [Google Scholar]
- 32.Hilgetag C, Theoret CH, Pascual-Leone A. Enhanced visual spatial attention ipsilateral to rTMS-induced ‘virtual lesions’ of human parietal cortex. Nat Neurosci. 2001;4:953–957. doi: 10.1038/nn0901-953. [DOI] [PubMed] [Google Scholar]
- 33.Cha YH, Cui Y, Baloh RW. Repetitive transcranial magnetic stimulation for mal de debarquement syndrome. Otol Neurotol. 2013;34:175–179. doi: 10.1097/MAO.0b013e318278bf7c. [DOI] [PMC free article] [PubMed] [Google Scholar]
- 34.Bassett DS, Nelson BG, Mueller BA, Camchong J, Lim KO. Altered resting state complexity in schizophrenia. NeuroImage. 2012;59:2196–2207. doi: 10.1016/j.neuroimage.2011.10.002. [DOI] [PMC free article] [PubMed] [Google Scholar]
- 35.Cha YH, Chakrapani S, Craig A, Baloh RW. Metabolic and functional connectivity changes in mal de debarquement syndrome. PLoS ONE. 2012;7:e49560. doi: 10.1371/journal.pone.0049560. [DOI] [PMC free article] [PubMed] [Google Scholar]
- 36.Hanson C, Hanson SJ, Ramsey J, Glymour C. Atypical effective connectivity of social brain networks in individuals with autism. Brain Stimulation. 2013;3(6):578–589. doi: 10.1089/brain.2013.0161. [DOI] [PubMed] [Google Scholar]
- 37.Friston KJ. The disconnection hypothesis. Schizophrenia Res. 1998;30:115–125. doi: 10.1016/s0920-9964(97)00140-0. [DOI] [PubMed] [Google Scholar]
- 38.Vanneste S, Focquaert F, Heyning P, Ridder D. Different resting state brain activity and functional connectivity in patients who respond and not respond to bifrontal tDCS for tinnitus suppression. Exp Brain Res. 2011;210:217–227. doi: 10.1007/s00221-011-2617-z. [DOI] [PubMed] [Google Scholar]
- 39.Arns M, Cerquera A, Gutiérrez RM, Hasselman F, Freund JA. Non-linear EEG analyses predict non-response to rTMS treatment in major depressive disorder. Clin Neurophysiol. doi: 10.1016/j.clinph.2013.11.022. to be published, 2013. [DOI] [PubMed] [Google Scholar]
- 40.Kleinjung T, Eichhammer P, Landgrebe M, Sand P, Hajak G, Steffens, Strutz J, Langguth B. Combined temporal and prefrontal transcranial magnetic stimulation for tinnitus treatment: A pilot study. Otolaryngol Head Neck Surg. 2008;138:497–501. doi: 10.1016/j.otohns.2007.12.022. [DOI] [PubMed] [Google Scholar]
- 41.Strens LHA, Oliviero A, Bloem BR, Gerschlager W, Rothwell JC, Brown P. The effects of subthreshold 1 Hz repetitive TMS on cortico-cortical and interhemispheric coherence. Clin Neurophysiol. 2002;113:1279–1285. doi: 10.1016/s1388-2457(02)00151-7. [DOI] [PubMed] [Google Scholar]
- 42.Bingham E, Hyvarinen A. A fast fixed-point algorithm for independent component analysis of complex valued signals. Int J Neural Syst. 2000;10:1–8. doi: 10.1142/S0129065700000028. [DOI] [PubMed] [Google Scholar]
- 43.Shou G, Ding L, Dasari D. Probing neural activations from continuous EEG in a real-world task: Time-frequency independent component analysis. J Neurosci Methods. 2012;209:22–34. doi: 10.1016/j.jneumeth.2012.05.022. [DOI] [PubMed] [Google Scholar]
- 44.van den Broek SP, RF, Donderwinkel M, Peters MJ. Volume conduction effects in EEG and MEG. Electroencephalogr Clin Neurophysiol. 1998;106:522–534. doi: 10.1016/s0013-4694(97)00147-8. [DOI] [PubMed] [Google Scholar]
- 45.Cha YH. Mal de debarquement. Semin Neurol. 2009;29:520–527. doi: 10.1055/s-0029-1241038. [DOI] [PMC free article] [PubMed] [Google Scholar]
- 46.Thut G, Pascual-Leone A. A review of combined TMS-EEG studies to characterize lasting effects of repetitive TMS and assess their usefulness in cognitive and clinical neuroscience. Brain Topography. 2010;22:219–232. doi: 10.1007/s10548-009-0115-4. [DOI] [PMC free article] [PubMed] [Google Scholar]
- 47.Oldfield RC. The assessment and analysis of handedness: The Edinburgh inventory. Neuropsychologia. 1971;9:97–113. doi: 10.1016/0028-3932(71)90067-4. [DOI] [PubMed] [Google Scholar]
- 48.Nolan H, Whelan R, Reilly RB. FASTER: Fully automated statistical thresholding for EEG artifact rejection. J Neurosci Methods. 2010;192:152–162. doi: 10.1016/j.jneumeth.2010.07.015. [DOI] [PubMed] [Google Scholar]
- 49.Delorme A, Makeig S. EEGLAB: An open source toolbox for analysis of single-trial EEG dynamics including independent component analysis. J Neurosci Methods. 2004;134:9–21. doi: 10.1016/j.jneumeth.2003.10.009. [DOI] [PubMed] [Google Scholar]
- 50.Delorme A, Palmer J, Onton J, Oostenveld R, Makeig S. Independent EEG sources are dipolar. PLoS ONE. 2012;7:e30135. doi: 10.1371/journal.pone.0030135. [DOI] [PMC free article] [PubMed] [Google Scholar]
- 51.Yuan H, Zotev V, Phillips R, Drevets WC, Bodurka J. Spatiotemporal dynamics of the brain at rest—Exploring EEG microstates as electrophysiological signatures of BOLD resting state networks. NeuroImage. 2012;60:2062–2072. doi: 10.1016/j.neuroimage.2012.02.031. [DOI] [PubMed] [Google Scholar]
- 52.Chen JL, Ros T, Gruzelier JH. Dynamic changes of ICA-derived EEG functional connectivity in the resting state. Hum Brain Mapping. 2013;34:852–868. doi: 10.1002/hbm.21475. [DOI] [PMC free article] [PubMed] [Google Scholar]
- 53.Ponomarev VA, Mueller A, Candrian G, Grin-Yatsenko VA, Kropotov JD. Group independent component analysis (gICA) and current source density (CSD) in the study of EEG in ADHD adults. Clin Neurophysiol. 2014;125:83–97. doi: 10.1016/j.clinph.2013.06.015. [DOI] [PubMed] [Google Scholar]
- 54.Ridding MC, Inzelberg R, Rothwell JC. Changes in excitability of motor cortical circuitry in patients with Parkinson’s disease. Ann Neurol. 1995;37:181–188. doi: 10.1002/ana.410370208. [DOI] [PubMed] [Google Scholar]
- 55.Rona S, Berardelli A, Vacca L, Inghilleri M, Manfredi M. Alterations of motor cortical inhibition in patients with dystonia. Movement Disorders. 1998;13:118–124. doi: 10.1002/mds.870130123. [DOI] [PubMed] [Google Scholar]
- 56.Maeda F, Keenan JP, Pascual-Leone A. Interhemispheric asymmetry of motor cortical excitability in major depression as measured by transcranial magnetic stimulation. Brit J Psychiatry. 2000;177:169–173. doi: 10.1192/bjp.177.2.169. [DOI] [PubMed] [Google Scholar]
- 57.Valli IJS, Mechelli A, Bhattacharyya S, Raffin M, Allen P, Fusar-Poli P, Lythgoe D, O’Gorman R, Seal M, McGuire P. Altered medial temporal activation related to local glutamate levels in subjects with prodromal signs of psychosis. Biol Psychiatry. 2011;69:97–99. doi: 10.1016/j.biopsych.2010.08.033. [DOI] [PubMed] [Google Scholar]
- 58.Stephan KE, Baldeweg T, Friston KJ. Synaptic plasticity and dysconnection in schizophrenia. Biol Psychiatry. 2006;59:929–939. doi: 10.1016/j.biopsych.2005.10.005. [DOI] [PubMed] [Google Scholar]
- 59.Gustafsson B, Wigstrom H. Physiological mechanisms underlying long-term potentiation. Trends Neurosci. 1998;11:156–162. doi: 10.1016/0166-2236(88)90142-7. [DOI] [PubMed] [Google Scholar]
- 60.Christie BR, Kerr DS, Abraham WC. Flip side of synaptic plasticity: Long-term depression mechanisms in the hippocampus. Hippocampus. 1994;4:127–135. doi: 10.1002/hipo.450040203. [DOI] [PubMed] [Google Scholar]
- 61.Fox MD, Raichle ME. Spontaneous fluctuations in brain activity observed with functional magnetic resonance imaging. Nat Rev Neurosci. 2007;8:700–711. doi: 10.1038/nrn2201. [DOI] [PubMed] [Google Scholar]
- 62.Yuan H, Zotev V, Phillips R, Bodurka J. Correlated slow fluctuations in respiration, EEG, and BOLD fMRI. NeuroImage. 2013;79:81–93. doi: 10.1016/j.neuroimage.2013.04.068. [DOI] [PubMed] [Google Scholar]
- 63.Selemon LD, Goldman-Rakic PS. Common cortical and subcortical targets of the dorsolateral prefrontal and posterior parietal cortices in the rhesus monkey: Evidence for a distributed neural network subserving spatially guided behavior. J Neurosci. 1998;8:4049–4068. doi: 10.1523/JNEUROSCI.08-11-04049.1988. [DOI] [PMC free article] [PubMed] [Google Scholar]
- 64.Ding L. Reconstructing cortical current density by exploring sparseness in the transform domain. Phys Med Biol. 2009;54:2683–2697. doi: 10.1088/0031-9155/54/9/006. [DOI] [PubMed] [Google Scholar]
- 65.Ding L, Yuan H. Simultaneous EEG and MEG source reconstruction in sparse electromagnetic source imaging. Hum Brain Mapping. 2013;34:775–795. doi: 10.1002/hbm.21473. [DOI] [PMC free article] [PubMed] [Google Scholar]
- 66.Yuan H, Ding L, Zhu M, Bodurka J. Spatial and temporal similarity of EEG microstates and BOLD resting state networks. presented at 19th Annual Meeting of the Organization for Human Brain Mapping; Seattle, WA, USA. 2013. [Google Scholar]
- 67.Cavanagh JF, Cohen MX, Allen JB. Prelude to and resolution of an error: EEG phase synchrony reveals cognitive control dynamics during action monitoring. J Neurosci. 2009;29:98–105. doi: 10.1523/JNEUROSCI.4137-08.2009. [DOI] [PMC free article] [PubMed] [Google Scholar]
- 68.van Driel J, Ridderinkhof KR, Cohen MX. Not all errors are alike: Theta and alpha EEG dynamics relate to differences in error-processing dynamics. J Neurosci. 2012;32:16795–16806. doi: 10.1523/JNEUROSCI.0802-12.2012. [DOI] [PMC free article] [PubMed] [Google Scholar]
- 69.Ghuman AS, McDaniel JR, Martin A. A wavelet-based method for measuring the oscillatory dynamics of resting-state functional connectivity in MEG. NeuroImage. 2011;56:69–77. doi: 10.1016/j.neuroimage.2011.01.046. [DOI] [PMC free article] [PubMed] [Google Scholar]
- 70.Chen JL, Ros T, Gruzelier JH. Dynamic changes of ICA-derived EEG functional connectivity in the resting state. Hum Brain Mapping. 2013;34:852–868. doi: 10.1002/hbm.21475. [DOI] [PMC free article] [PubMed] [Google Scholar]
- 71.Lachaux JP, Rodriguez E, Martinerie J, Varela FJ. Measuring phase synchrony in brain signals. Hum Brain Mapping. 1999;8:194–208. doi: 10.1002/(SICI)1097-0193(1999)8:4<194::AID-HBM4>3.0.CO;2-C. [DOI] [PMC free article] [PubMed] [Google Scholar]
- 72.George MS, Taylor JJ, Short EB. The expanding evidence base for rTMS treatment of depression. Curr Opin Psychiatry. 2013;26:13–18. doi: 10.1097/YCO.0b013e32835ab46d. [DOI] [PMC free article] [PubMed] [Google Scholar]
- 73.Ferbert A, Priori A, Rothwell JC, Day BL, Colebatch JG, Marsden CD. Interhemispheric inhibition of the human motor cortex. J Physiol. 1992;453:525–546. doi: 10.1113/jphysiol.1992.sp019243. [DOI] [PMC free article] [PubMed] [Google Scholar]


