

Abstract
Key points
Glutamatergic neurons in the median preoptic area were stimulated using genetically targeted Channelrhodopsin 2 in transgenic mice.
Stimulation of glutamatergic median preoptic area neurons produced a profound hypothermia due to cutaneous vasodilatation.
Stimulation also produced drinking behaviour that was inhibited as water was ingested, suggesting pre‐systemic feedback gating of drinking.
Anatomical mapping of the stimulation sites showed that sites associated with hypothermia were more anteroventral than those associated with drinking, although there was substantial overlap.
Abstract
The median preoptic nucleus (MnPO) serves an important role in the integration of water/electrolyte homeostasis and thermoregulation, but we have a limited understanding these functions at a cellular level. Using Cre–Lox genetic targeting of Channelrhodospin 2 in VGluT2 transgenic mice, we examined the effect of glutamatergic MnPO neuron stimulation in freely behaving mice while monitoring drinking behaviour and core temperature. Stimulation produced a strong hypothermic response in 62% (13/21) of mice (core temperature: −4.6 ± 0.5°C, P = 0.001 vs. controls) caused by cutaneous vasodilatation. Stimulating glutamatergic MnPO neurons also produced robust drinking behaviour in 82% (18/22) of mice. Mice that drank during stimulation consumed 912 ± 163 μl (n = 8) during a 20 min trial in the dark phase, but markedly less during the light phase (421 ± 83 μl, P = 0.0025). Also, drinking during stimulation was inhibited as water was ingested, suggesting pre‐systemic feedback gating of drinking. Both hypothermia and drinking during stimulation occurred in 50% of mice tested. Anatomical mapping of the stimulation sites showed that sites associated with hypothermia were more anteroventral than those associated with drinking, although there was substantial overlap. Thus, activation of separate but overlapping populations of glutamatergic MnPO neurons produces effects on drinking and autonomic thermoregulatory mechanisms, providing a structural basis for their frequently being coordinated (e.g. during hyperthermia).
Keywords: autonomic nervous system, hypothalamus, hypothermia, optogenetic, sympathetic nervous system, temperature, thermoregulation, thirst
Key points
Glutamatergic neurons in the median preoptic area were stimulated using genetically targeted Channelrhodopsin 2 in transgenic mice.
Stimulation of glutamatergic median preoptic area neurons produced a profound hypothermia due to cutaneous vasodilatation.
Stimulation also produced drinking behaviour that was inhibited as water was ingested, suggesting pre‐systemic feedback gating of drinking.
Anatomical mapping of the stimulation sites showed that sites associated with hypothermia were more anteroventral than those associated with drinking, although there was substantial overlap.
Abbreviations
- BAT
brown adipose tissue
- BDNF
brain‐derived neurotrophic factor
- ChR2
Channlerhodopsin 2
- DHA
dorsal hypothalamic area
- GABA
gamma‐aminobutyric acid
- LepRb
leptin receptor
- MnPO
median preoptic nucleus
- MPA
medial preoptic area
- OVLT
organum vaculosum of the laminae terminalis
- PACAP
pituitary adenylate cyclase‐activating polypeptide
- POA
preoptic area
- RPa
raphe pallidus
- Tc
core temperature
- Ttail
tail surface temperature
- VGluT2
vesicular glutamate transporter 2
Introduction
The median preoptic nucleus (MnPO) is a portion of the lamina terminalis that has been implicated in the integration of signalling from brainstem and hypothalamic regions involved in osmotic, cardiovascular, thermal and sleep–wake regulation (McKinley et al. 2015). Neurons in the MnPO can be broadly classified as either glutamatergic or GABAergic based on the expression of their respective vesicular transporters and there is evidence that these glutamatergic and GABAergic neurons are engaged in opposing functions, for example, glutamatergic MnPO neurons drive drinking behaviour and GABAergic MnPO neurons suppress it (Abbott et al. 2016).
Prevailing models of thermoregulation suggest that GABAergic MnPO neurons are activated by cold‐sensitive inputs and increase thermogenesis and heat conservation, while glutamatergic MnPO neurons are activated by warm‐sensitive inputs and inhibit thermogenesis and promote heat loss. It has been proposed that both neuronal populations execute their actions by modulating the activity of warm‐sensitive GABAergic neurons in the medial preoptic area (MPA) which inhibit brown adipose and shivering thermogenesis, as well as reducing heat conservation by preventing cutaneous vasoconstriction (McAllen et al. 2010; Morrison & Nakamura, 2011; Nakamura, 2011; Morrison, 2016). However, a recent study (Zhao et al. 2017) found hypothermic responses from stimulating GABAergic neurons in the ventrolateral preoptic area, and none at all from optogenetic simulation of GABAergic neurons in the MPA. Other work suggests that the glutamatergic MnPO inputs to the dorsal hypothalamic area (DHA) and raphe pallidus (RPa) promote hyperthermia in response to injections of pyrogenic agents into the preoptic area (Madden & Morrison, 2004; Tanaka et al. 2011, 2013). Also, it was recently reported that stimulating a population of neurons that express the neuropeptide pituitary adenylate cyclase‐activating polypeptide (PACAP) or the growth factor brain‐derived neurotrophic factor (BDNF) in the ‘ventromedial preoptic area’ (equivalent to the ventral part of the MnPO) produces hypothermia, and ∼70% of these neurons were GABAergic (Tan et al. 2016). On the other hand, activating leptin receptor (LepRb)‐expressing neurons in the same region of the MnPO also causes hypothermia, and ∼60% of these neurons are glutamatergic (Yu et al. 2016). In the second study (Yu et al. 2016), the authors also showed that activating glutamatergic, but not GABAergic, neurons in the preoptic area in mice using a Cre–Lox designer receptor exclusively activated by designer drug (DREADD) system produces a similar hypothermic response. However, large injections of virus (400–800 nl) were used in the latter study, so it is not clear whether they excited glutamatergic neurons in the MnPO, nearby parts of the preoptic area, or some other site.
Collectively, these studies challenge the role of GABAergic and glutamatergic MnPO neurons in thermoregulation set out by existing models and raise the question of whether the glutamatergic neurons in the MnPO contribute to hypothermic responses. Also, we recently reported that glutamatergic neurons in the MnPO drive drinking responses (Abbott et al. 2016), but their relationship with MnPO neurons with a thermoregulatory function is not known. Dehydration and hyperthermia often occur together, but certain aspects of the response to heat exposure, such as salivation, are suppressed during dehydration and are apparently controlled differentially (Doris & Baker, 1981; Baker et al. 1983; McKinley et al. 2009). Therefore, the aims of this study are twofold: first, to determine the effects of genetically targeted stimulation of glutamatergic MnPO neurons on body temperature; and second to determine the relationship between glutamatergic MnPO neurons that regulate drinking behaviour and thermoregulation. To address these aims, we performed optogenetic stimulation of the MnPO in freely behaving mice while measuring drinking behaviour and core temperature.
Methods
Ethical approval
All animal care and experimental procedures were approved by the Beth Israel Deaconess Medical Center Institutional Animal Care and Use Committee (ethics protocol: 055‐2011).
Animals
We used male and female heterozygous Slc17a6‐ires‐Cre (VGluT2‐ires‐Cre) (Vong et al. 2011), some of which were mated to Cre‐dependent green fluorescent protein (GFP) reporter mice (R26‐loxSTOPlox‐L10‐GFP) (Krashes et al. 2014). Mouse lines were generously provided by B. B. Lowell (BIDMC, Harvard University), were back‐crossed to C57BL6 (The Jackson Laboratory, Bar Harbor, ME, USA), and underwent genotyping before experiments. The age of mice at the time of experimentation ranged between 12 and 30 weeks. Following injections of virus mice were individually housed in standard plastic cages with standard corn‐cob bedding with nesting materials on a 12 h light–12 h dark cycle (lights on 08.00 h) at ambient temperatures ranging between 21 and 23 °C. Mouse chow (Teklad F6 Rodent Diet 8664, Envigo, Huntington, UK) and water were provided ad libitum. Age‐matched littermates were used to create experimental and control groups by random assignment during injections of virus.
Viral vectors
AAV‐DIO‐ChR2 (H134R)‐mCherry‐WPRE (serotype 8; titre: 3.8 × 10¹²), AAV‐DIO‐ChR2 (E123/T159C)‐p2a‐mCherry‐WPRE (serotype 5; titre: 4.0 × 10¹²) and AAV‐DIO‐mCherry‐WPRE (serotype 5; titre: 4.1 × 10¹²) plasmids were generously provided by K. Deisseroth (Stanford University) and the AAVs were produced at the University of North Carolina virus core. Injection of these viruses in C57BL6 mice did not produce detectable expression of mCherry when brains were examined after 1 month of incubation (n = 2 for each virus).
Surgery
All surgery was performed in sterile conditions. Mice were anaesthetized with ketamine/xylazine (100 and 10 mg kg−1, respectively, i.p.) with additional doses of 10% of the initial dose throughout surgery to eliminate the withdrawal reflex. Stereotaxic microinjections of 9–15 nl virus were made into the MnPO region (coordinates: AP = +1.5 mm, L = midline, DV = −4.4 mm on a 10 deg posterior angle) and an optical fibre (200 μm, 0.39 nA) was implanted 300–500 μm dorsal to the injection site using the same approach. Mice were implanted with a radio telemetry temperature sensor (TA‐F10, DSI, New Brighton, MN, USA) in the intra‐peritoneal space via laparotomy and a subset of mice were also equipped with a six‐pin head connector (Millimax, Milli‐Max Manufacturing, Oyster Bay, NY, USA) connected to 3 intracranial screws (left frontal, right parietal and occipital) and three braided stainless‐steel wires (A‐M Systems, Sequim, WA, USA) implanted in the neck muscles for electromyogram (EMG) and along the sternum for electrocardiogram (EKG) recording. Electroencephalogram (EEG) (recorded between the left frontal and right parietal screw) and EMG recording was used to monitor sleep behaviour, as this affects thermoregulation. Wounds were closed with surgical glue and mice were allowed to recover on a heating pad until conscious. Meloxicam, for analgesia, was administered prior to surgery then again 24 h later. Mice recovered for 21 days prior to experimentation. Following recovery, mice showed no signs of discomfort and gained weight normally.
General procedures
During recordings, mice were housed individually with corn‐cob bedding, nesting material, food and water in static plastic containers (diameter, 20 cm; height, 30 cm), within an insulated sound‐proofed recording chamber (MED Associates, Fairfax, VT, USA). Mice were habituated to these conditions overnight prior to experiments, and for at least 48 h for sleep–wake recordings. Ambient temperature in these conditions was 21 ± 1°C (nominally 21°C) when measured using temperature loggers (SubCue, Minimitter, Bend, OR, USA). In some cases, environmental warming of the chamber was performed by placing the chamber on a heating pad set at 40°C, which raised the ambient temperature within the bedding to 31 ± 1°C (nominally ambient temperature 31°C). A period of 1 h was allowed for mice to acclimate to the elevated ambient temperature before stimulations were recommenced. Mice were examined for a continuous period of up to 3 days during which time they were checked daily. Stimulation was automatically initiated once every 3–6 h.
Core temperature recordings
For core temperature (T c) recordings, the signal from an implanted radiotelemetry probe was detected by a receiver and converted (DSI) into an analog signal and acquired via Spike software (v8, CED, Cambridge, UK) at 1 Hz. DSI probes were calibrated by placing the probe and receiver inside an environmental chamber set at 30 and 35°C, with the gain and offset of the probe determined by linear regression between the voltage recorded at each set‐point via the radiotelemetry probe and chamber temperature recorded in parallel using temperature data loggers (0.125°C accuracy). Eight of the probes were calibrated in this way, and the standard deviation for the gain (4%) and offset (11%) were so small and consistent that we applied the mean gain and offset for the remaining four probes (which accounted for data from 6/21 experimental and 2/7 control mice).
Thermal imaging
Thermal imaging was performed during the light phase using an infrared camera (FLIR E4) (Geerling et al. 2016). Mice were imaged in disposable open‐top waxed paper cups on a DSI receiver placed on an open benchtop. The cups did not contain corn‐cob bedding or food. Following 1 h of habituation to these conditions, mice were connected to the laser and allowed 20–30 min to recover. Stimulation was performed in room temperature conditions (ambient temperature 21 ± 1°C). Initially, thermographic videos were used to determine the time course of changes in tail temperature (T tail) in parallel with T c, as well as the optimal parameters for analysing changes in T tail during stimulation. For data analysis, a single image was acquired immediately before a 1 min stimulus at 10 Hz, followed by one to three images taken 0–60 s after termination of the stimulus. These images were used to determine T tail using analysis software provided by the manufacturer of the thermographic camera. The data presented as ΔT tail refer to the change in T tail after 1 min stimulations performed when baseline T tail less than 30°C (range of baseline T tail for all mice: 23.9–29.1°C, n = 29). Up to three trials per mouse were performed to generate a single mean baseline and peak T tail value per mouse that was used to calculate ΔT tail in Fig. 2. There was no statistical difference in the baseline T tail between groups (one‐way ANOVA, F 2,25 = 0.65, P = 0.53).
Figure 2. Stimulation causes heat loss through rapid vasodilatation of the tail.
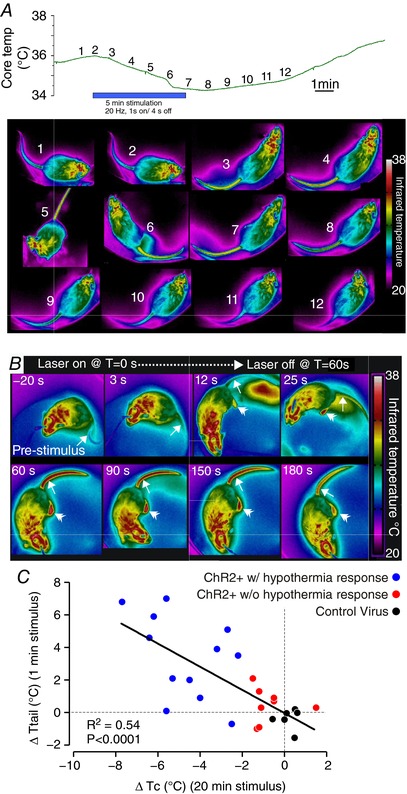
A, time course of changes in T c (upper panel) and tail temperature (T tail, lower panel, one photo each minute at the time shown on the upper panel) during 5 min of phasic stimulation. Note that increasing T tail (arrow) precedes a decrease in T c following the beginning of the stimulus, and T tail decreases before T c recovers post‐stimulus. B, example thermographs used for analysis of T tail (single arrowhead) during a 60 s stimulus starting at T = 0. Note that temperature of the feet (double arrowhead) also increases during stimulation. C, x–y plot of ΔT c vs. ΔT tail in 20 VGluT2‐ires‐CreChR2+ and 6 mice injected with a control virus.
Measuring drinking and sleep/wake behaviour
Water consumption was assessed by video‐scoring or using a lickometer (Hayar et al. 2006). Junction potentials ranging from 0.5 to 1 V was produced when contact was made between the mouse and the water spout (2.7 mm internal diameter), and this signal was acquired at 500 Hz (band‐pass filter: 1–100 Hz). Based on previous measurements in our experimental set‐up (Abbott et al. 2016), mice consume around 1.3 μl per spout lick. Visual records were acquired using a webcam (Logitech, Romanel‐sur‐Morges, Switzerland) and native software, and later synchronized to physiological recordings using time stamps. During video scoring, we excluded drinking bouts that were less than 2 s in duration due to the poor resolution of the onset and offset of licking. Video analysis and lickometer recordings performed in parallel demonstrate a high correlation between video scoring and spout licks (r 2 = 0.80).
EEG, EMG and EKG were amplified and band pass filtered using an A‐M systems amplifier (band‐pass filter, gain and sampling rate, EEG: 0.1–500 Hz, ×1000, 0.5 kHz; EMG: 300–1000 Hz, ×1000, 2 kHz; EKG: 10–500 Hz, ×1000, 2 kHz). All signals were acquired, processed, and analysed using Spike software (CED). Sleep–wake pattern was analysed in 10 s bins based on power‐spectrum analysis and EMG using the Sleepscore script available for Spike software.
Stimulation parameters
Stimulation was performed with a diode‐pumped solid‐state (DPSS) laser (473 nm, 100 mW max output; LaserGlow, Toronto, Ontario, Canada; LRS‐0473‐TSM‐00100‐10) controlled by Spike software. During initial experiments, we observed hypothermic responses in control mice during continuous and high frequency tonic stimulation (i.e. 12 mW continuously for 1 min or 20 Hz/10 ms pulses for 10 min). We did not observe cell death in post‐mortem tissue that had been illuminated and similar stimulation of other distant brain sites in control mice had no effect on T c suggesting that local tissue heating in the preoptic area during extended light application produces a heat‐defence response. To avoid tissue heating during our physiological studies we settled on a pattern of stimulation that had no effect on T c in control mice, but produced physiological changes in VGluT2‐ires‐CreChR2+ mice. Stimulation patterns consisted of 20 × 5 ms pulses at 20 Hz every 5 s for 20 min repeated at intervals of 3–4 h or tonic 5 ms pulses delivered at 2–20 Hz for 1 min. Laser power measured at the tip of the fibre optic was 12 mW during continuous light delivery.
Grouping of animals and analysis
Core temperature effects were grouped according to the direction and magnitude of the change observed during stimulation. A change in T c greater than 4 times the standard deviation around the mean of T c during stimulation in mice injected with a control virus (i.e. 0.48°C) was defined as a hypothermic response (i.e. ΔT c > 1.93°C from baseline values is a hypothermic response). Between two and five trials per light cycle were used to generate a within mouse average for T c and HR. Single 20 min trials occurring 08.00–11.00 and 20.00–23.00 h were grouped to detect diurnal differences in the effects of stimulation. Sleep–wake responses in the light and dark phase were grouped because of small sample sizes.
Perfusions and brain sectioning
Mice were deeply anaesthetized with chloral hydrate (1.5% BW i.p. 7% solution) and transcardially perfused with 30 ml phosphate‐buffered saline (PBS) and then 30 ml 10% pH neutral formalin. Brains were extracted and post‐fixed overnight in 10% formalin and then stored in 20% sucrose until sectioned using a freezing microtome (35 μm coronal sections into 3 series). Following sectioning tissue was stored at 4°C in PBS with 0.2% sodium azide until processed for histology.
Mapping of injection site
To map injection sites, one series of sections through the preoptic area was mounted and coverslipped with hard‐set mounting media containing 4′,6‐diamidino‐2‐phenylindole (DAPI) stain (Vectashield; Vector Laboratories, Burlingame, CA, USA). Tissue was imaged at ×10 for native mCherry fluorescence on an Olympus VS120 slide scanning microscope. Regions of the preoptic area containing ChR2‐mCherry transduced neurons within 1 mm of the tip of the optical fibre were plotted on coronal template sections, which were then overlapped to compare injection sites.
Data handling and statistical analysis
Statistical analysis was performed using Prism v5 (GraphPad Software, San Diego, CA, USA). Experimenters were not blind to experimental conditions or phenotype of the mice. Following a test for normality (D'Agostino–Pearson omnibus normality test), significant differences were determined using either Student's paired or unpaired t test, the Mann–Whitney U‐test, Wilcoxon's signed‐rank test or repeated measures one‐way and two‐way ANOVA followed by a t test with Bonferroni correction. Pearson's r was calculated to determine the sample correlation coefficient between variables. A P < 0.05 was considered statistically significant. Data are presented as means ± SEM unless otherwise indicated.
Results
Stimulation of MnPO/OVLT glutamatergic neurons causes hypothermia
The median preoptic nucleus in mice, as in rats, is an inverted Y‐shaped structure that is draped over the rostral end of the third ventricle. The two arms of the Y are located along either side of the third ventricle as it opens and enclose the organum vasculosum of the lamina terminalis (OVLT), which is located along the rostral tip of the ventricle. The tail of the Y extends dorsally along the lamina terminalis, running along the rostral surface of the anterior commissure, so that in sections cut in the coronal plane at the level of the commissure, a part of the MnPO can be seen just above the commissure, and between it and the dorsal surface of the third ventricle.
We placed injections of AAV‐DIO‐ChR2‐mCherry (9–15 nl) from an anterior 10 degree angle, aimed at the body of the MnPO just above the opening of the third ventricle (see Abbott et al. 2016), in the region where Tan et al. (2016) and Yu et al. (2016) described BDNF/PACAP‐ and LepRb‐expressing neurons, respectively. In rats, this region corresponds to the ‘rostral medial preoptic area’ defined by Tanaka et al. (2009) and projects heavily to the RPa and dorsal hypothalamic area (Nakamura et al. 2009; Yoshida et al. 2009). Transduced neurons were often observed in the OVLT as it borders the ventral margins of the MnPO. No injection was solely confined to the OVLT, so for the purpose of this analysis the two regions were combined (referred to henceforth as the MnPO).
Phasic stimulation of vesicular glutamate transporter 2 (VGluT2)‐expressing neurons in the MnPO for 20 min in a nominal ambient temperature of 21°C produced a fall in T c of at least 1.9°C (i.e. a hypothermic response; see Methods for details of criteria) in 13/21 (62%) of VGluT2‐ires‐CreChR2+ mice (Table 1). In the eight VGluT2‐ires‐CreChR2+ mice in which stimulation did not produce a fall in T c of at least 1.9°C, five mice had a fall in T c between 1.0 and 1.9°C, two mice had a change of less than 1.0°C, and one mouse had a slight increase in T c (Table 1). Also, no change in T c or HR during laser stimulation was observed in mice injected with a control virus (Fig. 1 B and C).
Table 1.
Response characteristics of VGlut2‐ires‐CreChR2+ mice
| Mouse id no. | Time spent drinking in 1 min during lights on (%) | Baseline T c during lights on (°C) | ΔT c (°C) | Baseline T tail during lights on (°C) | ΔT tail (°C) |
|---|---|---|---|---|---|
| 139 | 76 | 35.7 | −7.7 | 26.0 | 6.8 |
| 141 | 30 | 36.5 | −5.6 | 27.0 | 7.0 |
| 142 | 5 | 34.6 | −0.5 | 25.4 | 0.7 |
| 143 | 16 | 37.2 | −1.1 | 27.5 | 0.3 |
| 172 | 0 | 36.6 | −2.5 | 27.3 | −0.7 |
| 220 | 0 | 37.5 | −5.3 | 25.4 | 2.1 |
| 224 | 0 | 36.1 | −1.5 | 28.4 | 2.1 |
| 290 | 24 | NT | NT | NT | NT |
| 291 | 25 | 37.0 | −1.2 | 26.1 | 1.3 |
| 298 | 25 | 36.9 | −6.4 | 27.5 | 4.6 |
| 299 | 0 | 36.1 | −2.0 | NT | NT |
| 313 | 31 | 37.6 | −2.7 | 26.5 | 5.1 |
| 314 | 27 | 36.0 | −4.0 | 26.0 | 0.9 |
| 360 | 39 | 35.7 | −3.2 | 29.1 | 3.9 |
| 362 | 32 | 36.5 | −0.5 | 24.4 | 0.9 |
| 363 | 30 | 35.3 | −5.6 | 24.7 | 0.1 |
| 376 | 18 | 35.7 | −1.3 | 28.1 | −1.0 |
| 379 | 15 | 36.8 | −6.2 | 25.4 | 5.9 |
| 381 | 28 | 37.9 | −4.5 | 28.5 | 2.0 |
| 383 | 17 | 36.5 | 1.5 | 25.8 | 0.3 |
| 384 | 68 | 34.7 | −1.2 | 26.7 | −0.9 |
| 385 | 68 | 38.5 | −2.2 | 27.7 | 3.5 |
NT, not tested.
Figure 1. Time course of the effects of glutamatergic MnPO neuron stimulation.
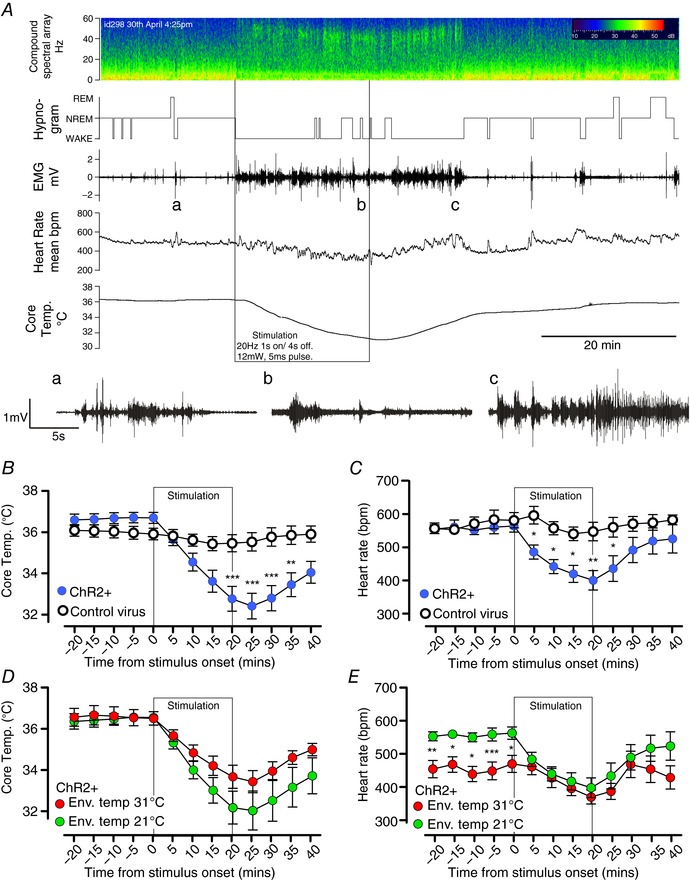
A, experimental recording of changes in EEG compound spectral activity, wake–sleep state (hypnogram), neck muscle activity (EMG), heart rate (HR) and core temperature (T c) in response to 20 min of phasic optogenetic stimulation of MnPO glutamatergic neurons (mouse id 298). Note that the animal awakens almost immediately with onset of stimulation, but that HR and T c gradually fall throughout the stimulation period. Insets a–c: expanded EMG trace before, during and after stimulation; note the rhythmic bursts in EMG representing shivering in c. B and C, grouped data of T c (B) and HR (C) changes during stimulation of VGlut2‐ires‐CreChR2+ mice (n = 14) with a hypothermic response and controls (n = 7). D and E, grouped data of T c (D) and heart rate (E) changes during stimulation in the light phase in VGlut2‐ires‐CreChR2+ (n = 7) with a hypothermic response in room temperature conditions (nominally 21°C) and thermoneutral (nominally 31°C) conditions. *** P < 0.001, ** P < 0.01, ** P < 0.05, t test with Bonferroni correction.
Among the 13 mice with a fall in T c of at least 1.9°C, the hypothermic response was characterized by a monotonic decrease in T c (Fig. 1 B and Table 1) to 4.6 ± 0.5°C below baseline at the nadir (controls: −0.9 ± 0.33°C, n = 13 and 7, respectively, unpaired t test, t = 3.5, P = 0.001). Heart rate was also assessed in seven of these mice (id nos 139, 141, 172, 220, 224, 298 and 299). Stimulation in this cohort decreased T c by 4.4 ± 0.9°C, and heart rate simultaneously decreased to 157 ± 25 bpm below baseline at the nadir (controls: +19 ± 38 bpm, n = 7 and 6, respectively, unpaired t test, t = 3.158, P = 0.009, Fig. 1 C). After the termination of the stimulus, HR began to recover almost immediately, whereas T c continued to decrease for approximately 5 min (Fig. 1 A–C). Full recovery of T c required up to 60 min in cases where the nadir of T c was less than 32°C (n = 5). Shivering was observed in EMG recordings during the initial period of rewarming, but not during the stimulation (inset of Fig. 1 A). During the recovery period, mice that exhibited large decreases in T c became behaviourally quiescent and immobile. Changes in T c and HR were similar in trials performed during the light phase and dark phase (T c: −4.4 ± 0.9 vs. −4.7 ± 0.9, n = 7, paired t test, t = 1.05, P = 0.33. HR: −164 ± 30 vs. −184 ± 28 bpm, paired t test, t = 0.673, P = 0.53), even though baseline T c was elevated during nocturnal trials (T c: 36.6 ± 0.2 vs. 37.7 ± 0.3, n = 7, paired t test, t = 7.12, P = 0.0004. HR: 559 ± 20 vs. 608 ± 17 bpm, paired t test, t = 2.062, P = 0.08). We did not observe postural extension or saliva spreading during stimulation as might be expected during heat exposure.
Next, we performed stimulations at an elevated ambient temperature (nominally 31°C) (Fig. 1 D and E). Under this condition, baseline HR was significantly reduced (from 563 ± 19 bpm at 21°C to 470 ± 25 bpm at 31°C, paired t test, t = 7.0, P = 0.0004), consistent with a presumed reduction in metabolic rate and brown adipose tissue (BAT) thermogenesis owing to ambient temperature being raised into the thermoneutral zone for mice. When ambient temperature was elevated to 31°C, ΔHR and ΔT c during stimulation were significantly reduced, but not eliminated, (ΔHR at 21 vs. 31°C: −164 ± 30 vs. −100 ± 15 bpm, paired t test, t = 3.21, P = 0.0184; ΔT c at 21 vs. 31°C: −4.5 ± 1.1 vs. −3.1 ± 0.6°C, paired t test, t = 2.54, P = 0.044). However, the dramatic fall in T c even at 31 ± 1°C suggests a regulated forced hypothermia, even at what should be a thermoneutral temperature.
We next examined the effects of stimulation on cutaneous blood flow, a process regulated by the activity of cutaneous sympathetic nerves in rodents (Morrison, 2016). Cutaneous blood flow was determined by measuring tail temperature (T tail), using infrared imaging (Geerling et al. 2016). Periods of stimulation at room temperature (21 ± 1°C) resulted in a rapid increase in T tail, reflecting an increase in tail blood flow, which preceded changes in T c (Fig. 2 A). Elevated T tail during stimulation was detectable within 15 s of the stimulus onset and peaked between the first and second minutes, and then progressively decreased, presumably reflecting reductions in T c due to heat dissipation. To quantify this effect, we performed single bouts of tonic stimulation at 10 Hz for 1 min (Fig. 2 B and C), which increased T tail by 3.4 ± 0.7°C (n = 12) in VGluT2‐ires‐CreChR2+ mice with a hypothermic response. By comparison the same stimulation procedure produced no effect on T tail in mice injected with a control virus (−0. 3 ± 0.3°C, n = 9, Mann–Whitney test, U = 9.5, P = 0.0018) or the eight VGluT2‐ires‐CreChR2+ mice that did not exhibit a hypothermic response in T c during stimulation (0.2 ± 0.3°C, n = 8, Mann–Whitney test, U = 13.5, P = 0.0087). Importantly, when the ΔT tail during these short stimulations was plotted against the maximum change in T c during 20 min of stimulation, there was a significant negative correlation between the two parameters (Fig. 2 C).
Sleep/wake behaviour and diurnal variation in the intensity of water consumption during stimulation
Stimulation provoked water consumption in 18/22 VGluT2‐ires‐CreChR2+ mice consistent with our previous descriptions (Abbott et al. 2016), which occurred in multiple bouts over the 20 min period of stimulation (Fig. 3). Mice injected with a control virus (AAV‐DIO‐mCherry) were never observed to consume water during stimulation trials conducted during the light phase. Because mice must, of necessity, be awake to drink, we also measured wake–sleep behaviour by analysing EEG and EMG activity in 10 VGluT2‐ires‐CreChR2+ mice (id nos 139, 141, 142, 143, 172, 220, 224, 291, 298 and 299) and seven control mice. In mice that showed a drinking response, stimulation of glutamatergic MnPO neurons during both the day and the night increased wakefulness and reduced NREM and REM sleep (Fig. 4 A and B). Wakefulness during the first 5 min of the stimulus was greater in VGluT2‐ires‐CreChR2+ mice (Δ +30.5 ± 7.6%, n = 10) compared to controls (Δ +5.8 ± 6.5%, n = 7, unpaired t test, t = 2.8, P = 0.015). The increase in wakefulness was restricted to mice that consumed water during stimulation (Δ +39.9 ± 8.4%, n = 6, unpaired t test, t = 3.3, P = 0.0075 vs. control), as percentage wakefulness in mice with thermoregulatory changes alone was not different from controls (Δ +3.0 ± 3.1%, n = 4, unpaired t test, t = 0.31, P = 0.76 vs. control).
Figure 3. Drinking during MnPO stimulation is regulated by diurnal feed‐forward and inhibitory feedback mechanisms.
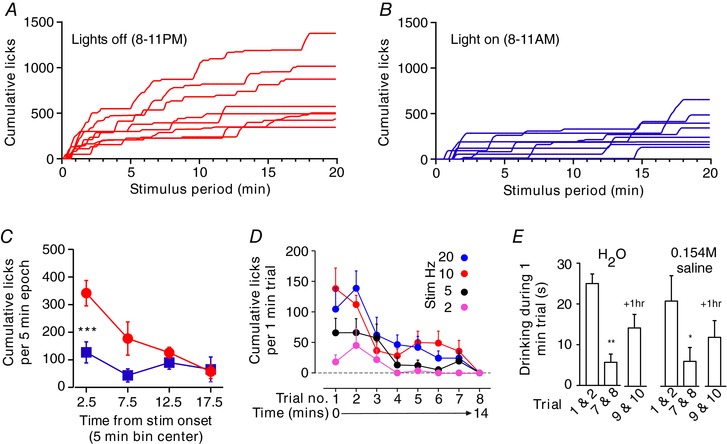
A and B, individual time course of cumulative water spout licks during 20 min trials in 8 mice conducted in the dark (A, red) and light (B, blue) phase. C, distribution of cumulative licks in light and dark phase trials for cases in A and B. *** P < 0.001 t test with Bonferroni correction. D, spout licks during each of 8 trials performed over 15 min (n = 7) using different stimulation frequencies. E, time spent drinking distilled water or 0.154 m saline during initial trials (average of trials 1 and 2) and last trials (average of trials 7 and 8) of a series of 8 trials, and two trials performed after 1 h of recovery (average of trials 9 and 10). n = 5, * P < 0.05, ** P < 0.01 vs. trials 1 and 2, t test with Bonferroni correction.
Figure 4. MnPO stimulation promotes wakefulness.
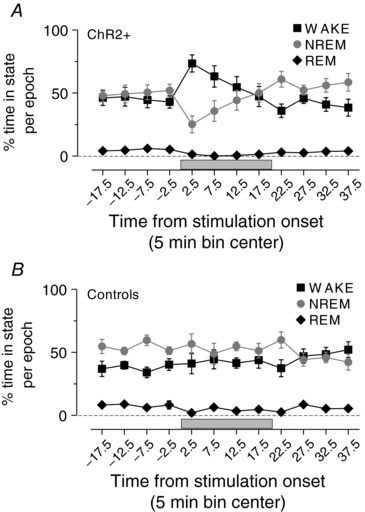
Grouped data of sleep/wake profile during stimulation in VGlut2‐ires‐Cre ChR2+ (A) and controls (B). Note that stimulations during the day and night are combined in this analysis.
VGluT2‐ires‐CreChR2+ mice were generally awake and behaviourally active between bouts of water consumption, and engaged in natural waking behaviours including exploration, rearing, cage‐circling, burrowing and the consumption of food. Interestingly, water consumption during stimulation was markedly potentiated during trials in the dark phase (Fig. 3 A–C). The latency to the first bout of drinking was decreased and the total number of licks during each trial was greater in the dark phase vs. light phase (median onset: 27.5 vs. 77.5 s, range 10–45 vs. 40–870 s, n = 8 Wilcoxon's signed rank test, W = 36.00, P = 0.014; Cumulative licks during the dark cycle vs. light cycle: 702 ± 125 vs. 324 ± 64, n = 8, paired t test, t = 4.6, P = 0.0025). The median water volume consumed in 20 min was approximated 912 and 421 μl during the dark and light phase, respectively.
Habituation of the drinking response during stimulation of glutamatergic MnPO neurons
We noted that water consumption was greatest during the early stages of the 20 min stimulation period whereas changes in T c and HR were monotonic throughout stimulation (compare Figs 1 and 3). We hypothesized that the drinking response was gated by feedback from receptors activated by water consumption (such as gut distension or haemodilution). To assess this further, we examined drinking over a series of 8 × 1 min trials at frequencies of 2–20 Hz during the light phase in seven mice (id nos 313, 314, 360, 362, 363, 376, 379 and 381; Fig. 3 E and F). Water spout licks were most frequent during the first two trials of the series, after which water consumption steeply declined to a lower plateau for the next five trials, and by the eighth trial no response was elicited irrespective of stimulation frequency (Fig. 3 E). Notably, providing physiological saline instead of distilled water did not affect the decline in consumption over sequential trials (i.e. this was unlikely to be the result of haemodilution), and we observed a partial reinstatement of water consumption following 1 h of recovery (Fig. 3 F). Importantly, the rate of T c change during the eighth trial was not different from the first trial in mice with a hypothermic response to stimulation (n = 4, Wilcoxon's signed rank test, W = −28.0, P = 0.25) indicating that the absence of drinking was not caused by depolarizing block during stimulation.
Relationship between hypothermia effect and water consumption
Of 21 VGluT2‐ires‐CreChR2+ mice examined for core temperature effects, stimulation caused a marked hypothermic response (i.e. ΔT c > 1.93°C) in 13 (62%) mice. Of the 13 mice exhibiting a hypothermic response, three (23%) mice did not consume water (Table 1, see id nos 172, 220 and 299). Of the 18/22 (81%) mice that consumed water during stimulation, 10 (57%) exhibited marked hypothermia. While there was no correlation between the intensity of water consumption and ΔT c during stimulation across the entire cohort of VGluT2‐ires‐CreChR2+ mice (Pearson's r = −0.19, P = 0.39, n = 21, there was a weak correlation in mice that exhibited both responses (Pearson's r = −0.44, P = 0.019, 28 trials in 7 mice), though preventing access to water during stimulation did not affect the hypothermic response (−5.1 ± 0.8°C with water access vs. −5.0 ± 0.7°C without water access, n = 5, paired t test, t = 0.77, P = 0.49).
Distribution of VGluT2 neurons in the preoptic area and distribution of neurons transduced with ChR2‐mCherry neurons
Post‐mortem analysis of the preoptic area of VGluT2‐ires‐CreChR2+ mice revealed that expression of ChR2‐mCherry was observed primarily in the ventral MnPO and OVLT, and to a lesser degree in the dorsal periventricular region (see e.g. id no. 298, Fig. 5 A and B). Although larger injections and injections that were intentionally placed lateral to the MnPO incorporated neurons in other cell groups (the anterodorsal preoptic area, medial preoptic area, medial septum and diagonal band of Broca, but never in the subfornical organ), the cells that were stimulated were limited by the placement of the tip of the optical fibre, which was typically located within the dorsal MnPO (Fig. 5 B).
Figure 5. Distribution of ChR2‐mCherry neurons in animals with specific physiological responses.
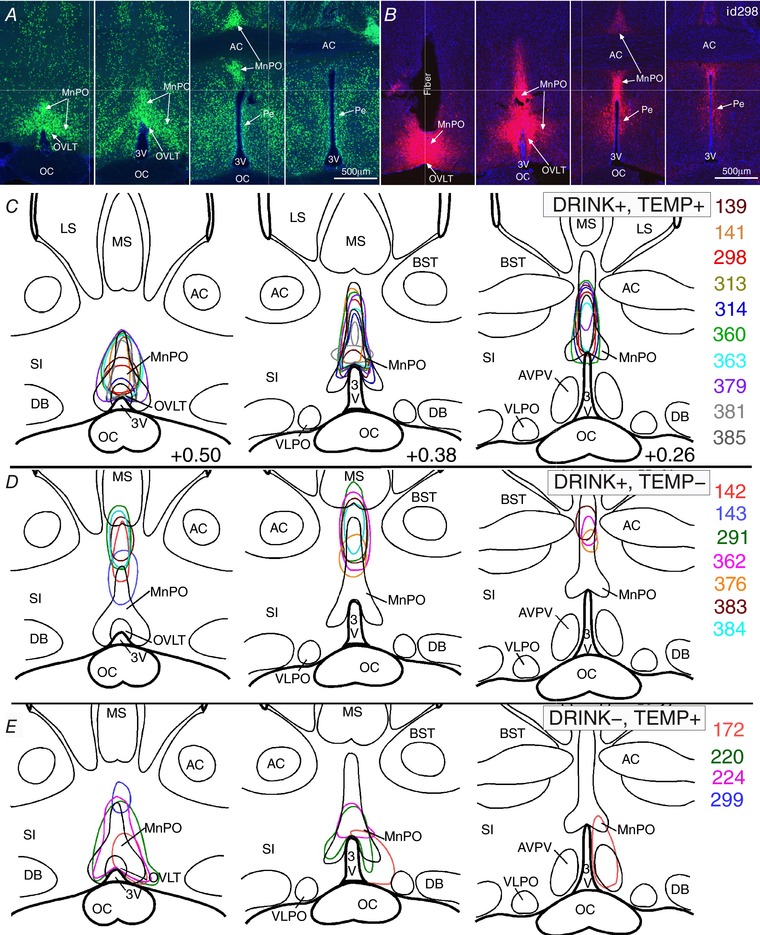
A and B, sequential coronal sections of the median preoptic nucleus in a Slc17a6‐cre;Rpl10‐GFP (Vglut2‐GFP) mouse (A) and a VGlut2‐ires‐CreChR2+ mouse (id 298, B), showing typical placement of an injection and the optical fibre. Scale bar: 500 μm. C–E, mapping of transduced neurons (irregular outlines) within 1 mm below the tip of the optical fibre for 10 VGlut2‐ires‐CreChR2+ mice with a hypothermic response and water consumption during stimulation (C), six with water consumption, but little or no T c change during stimulation (D), and four with T c reductions and no water consumption during stimulation (E). Abbreviations: 3V, 3rd ventricle; AC, anterior commissure; AVPV, anteroventral periventricular preoptic nucleus; BST, bed nucleus of the striatum; DB, nucleus of the diagonal band; LS, lateral septum; MS, medial septum; oc, optic chiasm; Pe, periventricular preoptic nucleus; SI, substantia innominate.
We plotted the location of transduced neurons ventral to the tip of the optical fibre in the VGluT2‐ires‐CreChR2+ mice and grouped them according to the presence or absence of the drinking and T c responses to stimulation. On this basis, the 10 stimulation sites in experiments in which there was both a fall in T c of least 1.9°C (i.e. 4 × SD of control mice indicating a hypothermic response) and increased water consumption with stimulation were clustered in the rostromedial MnPO and extending dorsally into the tail of the MnO (Fig. 5 C). By comparison, the seven injection sites in cases with drinking responses but little if any change in T c (i.e. less than a 1.9°C fall in T c) were located more dorsally in the MnPO (Fig. 5 D) and failed to include the rostromedial MnPO. Of the four cases with hypothermia but no drinking response, all involved the rostromedial MnPO. In only one case (id no. 224) did the injection extend into the dorsal MnPO, but the optical fibre in this case was implanted with the tip just above the rostromedial MnPO, so the dorsal component was not illuminated by the laser. Thus, it appears that the glutamatergic neurons in the rostromedial part of the MnPO primarily generated hypothermia in this study.
Another notable difference is that the dorsal cap of the OVLT was invariably included in the injection site of cases that produced a fall in T c of at least 1.9°C, but not those that did not (compare Fig. 5 C and E with D), though this may have reflected its position in the middle of the rostromedial MnPO, rather than a direct effect of the OVLT neurons. However, the OVLT was not included in any of the injection sites where the animals drank but did not show hypothermia (Fig. 5 D).
VGluT2‐ires‐Cre mice injected with a control (AAV‐DIO‐mCherry) virus (n = 7) showed a similar distribution of mCherry expression to experimental cases and injections of Cre‐dependent AAVs in Cre‐negative C57 mice (n = 2) did not result in ChR2‐mCherry expression. Furthermore, a total of nine VGluT2‐ires‐CreChR2+ mice were not included in the analysis because (a) there was no evidence of transduced neurons in the preoptic area (n = 4), presumably because injections were placed in the third ventricle, or (b) post hoc testing of the explanted fibre optic indicated inadequate light transmission (n = 5). Stimulation in these mice had no effect on any variable.
Discussion
We have demonstrated that activating MnPO neurons that express VGluT2 causes hypothermia and intense water consumption in conscious freely behaving mice. The two responses were not always seen in the same animal, and the hypothermic responses appeared to be associated with activation of the most anteroventral part of the MnPO and OVLT. We also demonstrated that the hypothermic response is associated with bradycardia and cutaneous vasodilatation. The hypothermia was so profound that animals often used shivering thermogenesis to increase their T c once the stimulation stopped. The water drinking during stimulation of glutamatergic MNPO neurons was much greater in the dark cycle when mice are usually awake, and the stimulation woke up mice during the light cycle when they are asleep. The intensity of drinking diminished with repeated bouts of drinking and appeared to be gated by non‐osmotic signalling related to the consumption of water.
Limitations of the data
Our results were obtained with optogenetic stimulation, optimized to minimize the heating effects of the laser light. Because many preoptic neurons are warm‐sensitive, and experimental warming of the preoptic area elicits hypothermia, we used stimulation parameters that did not affect T c in control (wild‐type) animals. However, this continuous metronomic pattern of stimulation is not one that would occur in a natural situation. Hence it is possible that the participation of specific neuronal populations in these responses may differ during natural responses to dehydration or overheating. Another limitation is that our injections, while small and generally well placed, nevertheless are not entirely confined to specific parts of the MnPO. This is particularly true for injections filling the rostral tip of the MnPO, which invariably involve the OVLT, which is composed of glutamatergic neurons. Unfortunately, targeting the MnPO in VGluT2‐ires‐Cre mice does not allow distinguishing the contributions of these two nuclei, and so for the purposes of this paper we have combined them.
Finally, we did not explicitly assess BAT thermogenesis in this study, so we cannot say with any certainty whether glutamatergic MnPO neurons influence this form of autonomic thermoregulation. The sympathetic nerves controlling cutaneous blood flow and BAT thermogenesis are independently regulated by distinct descending pathways that originate in the preoptic area (POA; McAllen et al. 2010), so it is theoretically possible that our stimulations activated a population of neurons that only control cutaneous blood flow. However, we show that shivering thermogenesis was only observed after the termination of stimulation, which suggests that shivering thermogenesis is suppressed by MnPO glutamatergic neurons. In addition, Yu et al. (2016) showed that activation of glutamatergic POA neurons reduces oxygen consumption, suggesting that metabolically driven heat production is inhibited during glutamatergic MnPO neuron stimulation.
Glutamatergic MnPO neurons regulate cutaneous blood flow
When exposed to warm environments, many mammals have increased cutaneous blood flow to the tail and paws to facilitate passive heat transfer to the environment as a means of regulating T c. Our findings demonstrate that glutamatergic MnPO neurons promote cutaneous vasodilatation of the tail, indicating these neurons are important in thermoregulation. The physiological significance of this effect may be related to changes in temperature regulation that occur in a circadian pattern, during sleep, or in response to heat exposure.
There is evidence in the literature for a role for MnPO glutamatergic neurons in thermoregulation. For example, LepRb‐expressing MnPO neurons, 80% of which are glutamatergic, show increased cFos expression with heat exposure, suggesting that they are physiologically activated. Similarly, neurons expressing the neuropeptide PACAP and the growth factor BDNF, roughly 30% of which are glutamatergic, represent 60–70% of all POA neurons activated by heat exposure (Tan et al. 2016). Genetically targeted stimulation of LepR and PACAP/BDNF POA neurons causes hypothermia, as does stimulation of glutamatergic POA neurons. Thus, our study expands these observations by demonstrating that glutamatergic neurons in the rostral MnPO promote cutaneous heat loss through vasodilatation of the tail. The implication of this finding is that cutaneous heat loss probably contributes to the hypothermic effect observed by Yu et al. (2016) following stimulation of glutamatergic and LepR MnPO neurons. Also, glutamatergic MnPO neurons may contribute to the changes in cutaneous blood flow and hypothermia observed by Tan et al. (2016) following stimulation of PACAP/BDNF neurons, even though these cells represent no more than 30% of this population.
On the other hand, our findings do not provide support for the existence of a population of cold‐activated glutamatergic MnPO neurons that drive cutaneous vasoconstriction by directly activating RPa neurons (Tanaka et al. 2011, 2013). However, considering the dense innervation of the RPa by glutamatergic MnPO neurons (Abbott et al. 2016), it is plausible that a subpopulation of these terminals promote vasoconstriction, though our study suggests that if these neurons exist, then they are in the minority compared to those promoting vasodilatation.
Importantly, the organization we propose is consistent with the pattern of inputs from thermoreceptive regions of the parabrachial nucleus (Fulwiler & Saper, 1984; Geerling et al. 2016). In addition, the MnPO provides limited innervation of the medial preoptic area, but dense innervation of the dorsal lateral preoptic area (Saper & Levisohn, 1983; Yoshida et al. 2005; Uschakov et al. 2007; Abbott et al. 2016; Zhao et al. 2017). There is also a prominent glutamatergic projection from the MnPO to the periaqueductal grey matter (Abbott et al. 2016) that may mediate vasodilatation (Zhang et al. 1997; Yoshida et al. 2005; Uschakov et al. 2009). Finally, glutamatergic MnPO neurons also target the DHA and RPa (Dimitrov et al. 2011; Abbott et al. 2016), which have been suggested to promote hyperthermia (Morrison & Nakamura, 2011; Nakamura, 2011; Tanaka et al. 2013; Morrison, 2016), and thus the MnPO neurons responsible for the hypothermia we observed may activate local GABAergic interneurons in the DHA and RPa that inhibit excitatory output neurons, a possibility that is supported by recent functional studies in mice (Zhao et al. 2017).
In summary, we propose that a subpopulation of glutamatergic neurons located in the rostral MnPO, which we have shown to promote heat loss, represent a subset of the warm‐activated preoptic neurons that are critical in the thermoregulatory response to heat stress owing to excitatory signalling from the dorsal lateral parabrachial nucleus (Nakamura & Morrison, 2010; Geerling et al. 2016). It is possible that some of these glutamatergic MnPO neurons express PACAP and BDNF, and likely that some express the LepRb, and we suggest that the effect of activating these neurons on cutaneous blood flow is mediated through GABAergic interneurons. This organization is comparable to what has been proposed in the most recent models of autonomic thermoregulation (see Morrison, 2016) except that in our model glutamatergic MnPO neurons contact inhibitory interneurons in the dorsolateral preoptic area (Yoshida et al. 2005) or in the dorsal hypothalamic area or RPa, rather than in the ‘medial preoptic area’ (Morrison & Nakamura, 2011; Nakamura, 2011; Morrison, 2016). It is noteworthy that most of the evidence for medial preoptic neurons participating in thermoregulation was obtained from injection of pharmacological substances into a site that is about half‐way between the MnPO and the dorsolateral preoptic neuron populations, both of which project to the RPa and dorsomedial nucleus (Yoshida et al. 2009), but that this ‘medial preoptic’ site itself contains few if any neurons that project to either of these thermoregulatory downstream targets.
The MnPO is also known to mediate aspects of behavioural thermoregulation (Whyte et al. 2006; Konishi et al. 2007; Tan et al. 2016). We did not observe heat‐defence behaviours (such as licking the fur to cause evaporative heat loss) during stimulation, though we did not examine this possibility extensively (e.g. by putting animals in a temperature gradient). Moreover, it is possible that water consumption during stimulation prevented us from unambiguously identifying heat‐defence behaviour or quite possibly that the drinking was part of a hypovolemic response that opposed behaviours such as fur licking.
Water consumption during stimulation is regulated by diurnal rhythms and pre‐systemic inhibition of thirst
Glutamatergic MnPO neurons are believed to drive the physiological response to dehydration including drinking (McKinley et al. 2015), and we have previously shown that stimulation of glutamatergic MnPO neurons causes water consumption (Abbott et al. 2016). Our findings extend these observations by demonstrating that water consumption during optogenetic stimulation varies according to endogenous biological rhythms, similar to water consumption following injections of dipsogenic agents in rats (Cunningham et al. 1992). This suggests that drinking behaviour is facilitated or gated by the activity of networks governing arousal and circadian rhythms. As water consumption requires wakefulness, when we stimulated during sleep, we often saw a brisk awakening that preceded the drinking behaviour (Fig. 1). The finding that glutamatergic MnPO neurons may promote cortical arousal and/or oppose sleep drive is consistent with observations that MnPO efferents target the orexin field in the lateral hypothalamus, as well as the tuberomammillary, pedunculopontine and parabrachial nuclei, and the locus coeruleus (Uschakov et al. 2007; Abbott et al. 2016). Thus, the activity of glutamatergic MnPO neurons may oppose drive from GABAergic MnPO neurons, which have been proposed to be sleep‐promoting (Szymusiak & McGinty, 2008).
Interestingly we found that water consumption during stimulation rapidly decays as water is consumed. This effect is unlikely to be due to damage to the glutamatergic MnPO neurons from the heat of the laser stimulus as the response recovered after about an hour of rest and could be repeated on successive days. Also, the fact that we observed the same pattern whether saline or water was consumed indicates that osmosensory signals are not critical in the loss of the drinking response. At frequencies producing robust water consumption (10 and 20 Hz), the drinking response was largely lost within 5 min of the first trial suggesting that the inhibition of drinking may be due to presystemic mechanisms (i.e. one that responds too quickly to represent systemic changes in blood osmolality or sodium). In rodents, pre‐systemic thirst inhibition is mediated by the activation of brainstem pathways responding to alimentary tract filling and distension rather than oropharyngeal sensory events (reviewed by Stricker & Stricker, 2011), which is consistent with the time course over which the drinking response was lost. Vagal gastrointestinal afferents terminate in the medial part of the nucleus of the solitary tract, from which A2 noradrenergic neurons innervate the MnPO (Saper et al. 1983; Shapiro & Miselis, 1985) as well as the dorsal lateral parabrachial subnucleus (Herbert & Saper, 1990), which also projects to the MnPO (Fulwiler & Saper, 1984). The target neurons for pre‐systemic signals within the MnPO have not been determined (Davern & McKinley, 2013), but may include activation of MnPO GABAergic neurons, which we have shown to suppress water consumption (Abbott et al. 2016), or reduction of the activity of glutamatergic MnPO/OVLT neurons, or both. Additional studies will be needed to address this question.
Drinking and hypothermia during MnPO stimulation are generated by overlapping but not identical populations of glutamatergic neurons
One goal of this study was to determine the anatomical overlap between glutamatergic MnPO neurons causing drinking and hypothermia. The fact that both drinking and some degree of hypothermia during stimulation were found in 50% of cases suggests that MnPO neurons regulating water consumption and hypothermia are nearby, but probably not identical. Supporting a different substrate for the two responses is the observation that three animals consumed water with no change or even an increase in T c during stimulation of the dorsal midline MnPO. The most robust and consistent reductions in T c occurred only when a discrete portion of the anterior ventral tip of the MnPO/OVLT was stimulated (i.e. the rostromedial MnPO), corresponding to sites where GABA injections increases cutaneous vasoconstrictor nerve activity in rats (Tanaka et al. 2009) and where hypothermia‐promoting neurons that express BDNF, PACAP, or leptin receptors have recently been reported. Further studies will need to genetically dissect the MnPO, and understand which cell types play particular roles in thermoregulation, wake–sleep, drinking, and water–electrolyte homeostasis.
Our data show that the glutamatergic MnPO neurons promote hypothermia by increasing cutaneous vasodilatation, presumably through the activation of inhibitory neurons that regulate the descending autonomic thermoregulatory network (Tanaka et al. 2009, 2011; Morrison, 2016). It is plausible that glutamatergic MnPO neurons exert their effects by exciting GABAergic neurons in the MnPO and dorsolateral preoptic area because combined lesions of the MnPO and the dorsolateral preoptic area (called the caudolateral preoptic area by McAllen) are necessary to unleash an unopposed hyperthermic response (Yoshida et al. 2009), similar to what is produced by large electrolytic lesions and transections of the POA (Szymusiak & Satinoff, 1982; Rathner et al. 2008). How these different populations of preoptic hypothermic neurons are interconnected, and what inputs drive them, will be an important area of exploration in unravelling the mechanisms of thermoregulation.
Additional information
Competing interests
The authors have no competing interests to disclose.
Author contributions
Both authors contributed to the conception and design of the work, the interpretation of the data, and the writing of the manuscript. S.B.G.A. performed the acquisition and analysis of the data. Both authors approved the final version of the manuscript and agree to be accountable for all aspects of the work in ensuring that questions related to the accuracy or integrity of any part of the work are appropriately investigated and resolved.
Funding
Supported by USPHS grants NS085477 and HL095491. S.B.G.A. is supported by an early career fellowship from the National Health and Medical Research Council of Australia (GNT1052674).
Acknowledgements
The authors acknowledge the excellent technical support of Sathyajit Bandaru, Quan Ha and Minh Ha.
This is an Editor's Choice article from the 15 October 2017 issue.
References
- Abbott SB, Machado NL, Geerling JC & Saper CB (2016). Reciprocal control of drinking behavior by median preoptic neurons in mice. J Neurosci 36, 8228–8237. [DOI] [PMC free article] [PubMed] [Google Scholar]
- Baker MA, Doris PA & Hawkins MJ (1983). Effect of dehydration and hyperosmolality on thermoregulatory water losses in exercising dogs. Am J Physiol Regul Integr Comp Physiol 244, R516–R521. [DOI] [PubMed] [Google Scholar]
- Cunningham JT, Beltz T, Johnson RF & Johnson AK (1992). The effects of ibotenate lesions of the median preoptic nucleus on experimentally‐induced and circadian drinking behavior in rats. Brain Res 580, 325–330. [DOI] [PubMed] [Google Scholar]
- Davern PJ & McKinley MJ (2013). Brain regions influenced by the lateral parabrachial nucleus in angiotensin II‐induced water intake. Neuroscience 252, 410–419. [DOI] [PubMed] [Google Scholar]
- Dimitrov EL, Kim YY & Usdin TB (2011). Regulation of hypothalamic signaling by tuberoinfundibular peptide of 39 residues is critical for the response to cold: a novel peptidergic mechanism of thermoregulation. J Neurosci 31, 18166–18179. [DOI] [PMC free article] [PubMed] [Google Scholar]
- Doris PA & Baker MA (1981). Effects of dehydration on thermoregulation in cats exposed to high ambient temperatures. J Appl Physiol Respir Environ Exerc Physiol 51, 46–54. [DOI] [PubMed] [Google Scholar]
- Fulwiler CE & Saper CB (1984). Subnuclear organization of the efferent connections of the parabrachial nucleus in the rat. Brain Res 319, 229–259. [DOI] [PubMed] [Google Scholar]
- Geerling JC, Kim M, Mahoney CE, Abbott SB, Agostinelli LJ, Garfield AS, Krashes MJ, Lowell BB & Scammell TE (2016). Genetic identity of thermosensory relay neurons in the lateral parabrachial nucleus. Am J Physiol Regul Integr Comp Physiol 310, R41–R54. [DOI] [PMC free article] [PubMed] [Google Scholar]
- Hayar A, Bryant JL, Boughter JD & Heck DH (2006). A low‐cost solution to measure mouse licking in an electrophysiological setup with a standard analog‐to‐digital converter. J Neurosci Methods 153, 203–207. [DOI] [PMC free article] [PubMed] [Google Scholar]
- Herbert H & Saper CB (1990). Cholecystokinin‐, galanin‐, and corticotropin‐releasing factor‐like immunoreactive projections from the nucleus of the solitary tract to the parabrachial nucleus in the rat. J Comp Neurol 293, 581–598. [DOI] [PubMed] [Google Scholar]
- Konishi M, Kanosue K, Kano M, Kobayashi A & Nagashima K (2007). The median preoptic nucleus is involved in the facilitation of heat‐escape/cold‐seeking behavior during systemic salt loading in rats. Am J Physiol Regul Integr Comp Physiol 292, R150–R159. [DOI] [PubMed] [Google Scholar]
- Krashes MJ, Shah BP, Madara JC, Olson DP, Strochlic DE, Garfield AS, Vong L, Pei H, Watabe‐Uchida M, Uchida N, Liberles SD & Lowell BB (2014). An excitatory paraventricular nucleus to AgRP neuron circuit that drives hunger. Nature 507, 238–242. [DOI] [PMC free article] [PubMed] [Google Scholar]
- Madden CJ & Morrison SF (2004). Excitatory amino acid receptors in the dorsomedial hypothalamus mediate prostaglandin‐evoked thermogenesis in brown adipose tissue. Am J Physiol Regul Integr Comp Physiol 286, R320–R325. [DOI] [PubMed] [Google Scholar]
- McAllen RM, Tanaka M, Ootsuka Y & McKinley MJ (2010). Multiple thermoregulatory effectors with independent central controls. Eur J Appl Physiol 109, 27–33. [DOI] [PubMed] [Google Scholar]
- McKinley MJ, Weissenborn F & Mathai ML (2009). Drinking‐induced thermoregulatory panting in rehydrated sheep: influences of oropharyngeal/esophageal signals, core temperature, and thirst satiety. Am J Physiol Regul Integr Comp Physiol 296, R1881–R1888. [DOI] [PubMed] [Google Scholar]
- McKinley MJ, Yao ST, Uschakov A, McAllen RM, Rundgren M & Martelli D (2015). The median preoptic nucleus: front and centre for the regulation of body fluid, sodium, temperature, sleep and cardiovascular homeostasis. Acta Physiol (Oxf) 214, 8–32. [DOI] [PubMed] [Google Scholar]
- Morrison SF (2016). Central control of body temperature. F1000Res 5, F1000 Faculty Rev‐880. [DOI] [PMC free article] [PubMed] [Google Scholar]
- Morrison SF & Nakamura K (2011). Central neural pathways for thermoregulation. Front Biosci 16, 74–104. [DOI] [PMC free article] [PubMed] [Google Scholar]
- Nakamura K (2011). Central circuitries for body temperature regulation and fever. Am J Physiol Regul Integr Comp Physiol 301, R1207–R1228. [DOI] [PubMed] [Google Scholar]
- Nakamura K & Morrison SF (2010). A thermosensory pathway mediating heat‐defense responses. Proc Natl Acad Sci USA 107, 8848–8853. [DOI] [PMC free article] [PubMed] [Google Scholar]
- Nakamura Y, Nakamura K & Morrison SF (2009). Different populations of prostaglandin EP3 receptor‐expressing preoptic neurons project to two fever‐mediating sympathoexcitatory brain regions. Neuroscience 161, 614–620. [DOI] [PMC free article] [PubMed] [Google Scholar]
- Rathner JA, Madden CJ & Morrison SF (2008). Central pathway for spontaneous and prostaglandin E2‐evoked cutaneous vasoconstriction. Am J Physiol Regul Integr Comp Physiol 295, R343–R354. [DOI] [PMC free article] [PubMed] [Google Scholar]
- Saper CB & Levisohn D (1983). Afferent connections of the median preoptic nucleus in the rat: anatomical evidence for a cardiovascular integrative mechanism in the anteroventral third ventricular (AV3V) region. Brain Res 288, 21–31. [DOI] [PubMed] [Google Scholar]
- Saper CB, Reis DJ & Joh T (1983). Medullary catecholamine inputs to the anteroventral third ventricular cardiovascular regulatory region in the rat. Neurosci Lett 42, 285–291. [DOI] [PubMed] [Google Scholar]
- Shapiro RE & Miselis RR (1985). The central organization of the vagus nerve innervating the stomach of the rat. J Comp Neurol 238, 473–488. [DOI] [PubMed] [Google Scholar]
- Stricker EM & Stricker ML (2011). Pre‐systemic controls of fluid intake and vasopressin secretion. Physiol Behav 103, 86–88. [DOI] [PubMed] [Google Scholar]
- Szymusiak R & McGinty D (2008). Hypothalamic regulation of sleep and arousal. Ann N Y Acad Sci 1129, 275–286. [DOI] [PubMed] [Google Scholar]
- Szymusiak R & Satinoff E (1982). Acute thermoregulatory effects of unilateral electrolytic lesions of the medial and lateral preoptic area in rats. Physiol Behav 28, 161–170. [DOI] [PubMed] [Google Scholar]
- Tan CL, Cooke EK, Leib DE, Lin YC, Daly GE, Zimmerman CA & Knight ZA (2016). Warm‐sensitive neurons that control body temperature. Cell 167, 47–59.e15. [DOI] [PMC free article] [PubMed] [Google Scholar]
- Tanaka M, McKinley MJ & McAllen RM (2009). Roles of two preoptic cell groups in tonic and febrile control of rat tail sympathetic fibers. Am J Physiol Regul Integr Comp Physiol 296, R1248–R1257. [DOI] [PubMed] [Google Scholar]
- Tanaka M, McKinley MJ & McAllen RM (2011). Preoptic‐raphe connections for thermoregulatory vasomotor control. J Neurosci 31, 5078–5088. [DOI] [PMC free article] [PubMed] [Google Scholar]
- Tanaka M, McKinley MJ & McAllen RM (2013). Role of an excitatory preoptic‐raphe pathway in febrile vasoconstriction of the rat's tail. Am J Physiol Regul Integr Comp Physiol 305, R1479–R1489. [DOI] [PubMed] [Google Scholar]
- Uschakov A, Gong H, McGinty D & Szymusiak R (2007). Efferent projections from the median preoptic nucleus to sleep‐ and arousal‐regulatory nuclei in the rat brain. Neuroscience 150, 104–120. [DOI] [PMC free article] [PubMed] [Google Scholar]
- Uschakov A, McGinty D, Szymusiak R & McKinley MJ (2009). Functional correlates of activity in neurons projecting from the lamina terminalis to the ventrolateral periaqueductal gray. Eur J Neurosci 30, 2347–2355. [DOI] [PMC free article] [PubMed] [Google Scholar]
- Vong L, Ye C, Yang Z, Choi B, Chua S Jr & Lowell BB (2011). Leptin action on GABAergic neurons prevents obesity and reduces inhibitory tone to POMC neurons. Neuron 71, 142–154. [DOI] [PMC free article] [PubMed] [Google Scholar]
- Whyte DG, Brennan TJ & Johnson AK (2006). Thermoregulatory behavior is disrupted in rats with lesions of the anteroventral third ventricular area (AV3V). Physiol Behav 87, 493–499. [DOI] [PubMed] [Google Scholar]
- Yoshida K, Konishi M, Nagashima K, Saper CB & Kanosue K (2005). Fos activation in hypothalamic neurons during cold or warm exposure: projections to periaqueductal gray matter. Neuroscience 133, 1039–1046. [DOI] [PubMed] [Google Scholar]
- Yoshida K, Li X, Cano G, Lazarus M & Saper CB (2009). Parallel preoptic pathways for thermoregulation. J Neurosci 29, 11954–11964. [DOI] [PMC free article] [PubMed] [Google Scholar]
- Yu S, Qualls‐Creekmore E, Rezai‐Zadeh K, Jiang Y, Berthoud HR, Morrison CD, Derbenev AV, Zsombok A & Munzberg H (2016). Glutamatergic preoptic area neurons that express leptin receptors drive temperature‐dependent body weight homeostasis. J Neurosci 36, 5034–5046. [DOI] [PMC free article] [PubMed] [Google Scholar]
- Zhang YH, Hosono T, Yanase‐Fujiwara M, Chen XM & Kanosue K (1997). Effect of midbrain stimulations on thermoregulatory vasomotor responses in rats. J Physiol 503, 177–186. [DOI] [PMC free article] [PubMed] [Google Scholar]
- Zhao ZD, Yang WZ, Gao C, Fu X, Zhang W, Zhou Q, Chen W, Ni X, Lin JK, Yang J, Xu XH & Shen WL (2017). A hypothalamic circuit that controls body temperature. Proc Natl Acad Sci USA 114, 2042–2047. [DOI] [PMC free article] [PubMed] [Google Scholar]