Summary
Identification of genes specifically deregulated in prostate adenocarcinoma may lead to discovery of new oncogenes/tumour suppressors with clinical relevance for diagnosis, prognosis and/or therapy. CXXC5 is a gene encoding a retinoid‐inducible nuclear factor, whose overexpression in breast tumours, metastatic malignant melanomas and papillary thyroid carcinoma has been recently reported. We previously found differential expression of CXXC5 transcripts in metastatic prostate cancer cell lines of both rat and human origin. However, knowledge on the expression of this gene in benign or malignant human prostate tissue is lacking. The aim of this study was to determine the mRNA and protein expression pattern of CXXC5 in human benign prostate tissue, proliferative inflammatory atrophy, high‐grade prostatic intra‐epithelial neoplasia and prostate cancer, using qPCR, chromogenic in situ hybridization and immunohistochemistry. Our results showed that protein levels determined by immunohistochemistry were in agreement with transcript levels observed by chromogenic in situ hybridization. CXXC5 mRNA and protein expressions were significantly higher in prostate cancer, high‐grade prostatic intra‐epithelial neoplasia, and proliferative inflammatory atrophy, compared to benign prostate tissue. Significantly, within the same tissue specimens, CXXC5 staining was stronger in malignant acini than in matched adjacent, benign acini; immunostaining for this protein was mainly localized to the nucleus of benign epithelial cells and both the nucleus and cytoplasm of malignant epithelial cells. Our findings suggest that CXXC5 may play a role in the process of prostate carcinogenesis. Additional studies are required to determine the biological and clinical significance of CXXC5 in prostate cancer development and/or progression.
Keywords: chromogenic in situ hybridization, CXXC5, high‐grade prostatic intra‐epithelial neoplasia, IHC, proliferative inflammatory atrophy, prostatic adenocarcinoma
Prostate adenocarcinoma (PCa) is the second most frequently diagnosed cancer and the fifth leading cause of death from cancer in males worldwide (Ferlay et al. 2015). The identification of genes specifically deregulated in this neoplasia may uncover new oncogenes or tumour suppressors with clinical relevance for diagnosis, prognosis and/or therapy. We have previously reported the differential expression of CXXC5 in metastatic prostate cancer cell lines of both rat (Reyes et al. 2007) and human origin (Bettin et al. 2016). CXXC5, also referred to as retinoid‐inducible nuclear factor (RINF), is a gene localized to the 5q31.3 chromosomal region, which encodes a retinoid‐inducible nuclear protein containing a CXXC‐type zinc finger motif (Pendino et al. 2009). It has been shown that some members of the CXXC family of proteins are cancer‐associated genes that can regulate the activity and function of important transcriptional complexes, such as Polycomb proteins (Katoh 2004).
Experiments addressing the function of the conserved CXXC‐type zinc finger motif have found that it is able to bind unmethylated CpG (Cierpicki et al. 2010), which in turn may suggest a similar role for CXXC5 in the regulation of epigenetics (Knappskog et al. 2011). Overexpression of this gene has been reported in breast tumours, metastatic malignant melanomas and papillary thyroid carcinoma (Knappskog et al. 2011). CXXC5 expression has also been found in tissues from various embryonic origins; it has been proposed that this gene may be involved in development and/or homeostasis of normal and pathological tissues (Andersson et al. 2009; Pendino et al. 2009).
A former genome‐wide methylation study has identified the cancer‐specific methylation of CXXC5, among other genes, in PCa (Devaney et al. 2013); however, participation of CXXC5 expression at the mRNA or protein level in prostate carcinogenesis has not been described to date. In this work, we seek to determine the expression pattern of CXXC5, both at mRNA and protein levels, in human benign and malignant prostate tissue, and in some prostate tissue lesions, such as proliferative inflammatory atrophy (PIA) and high‐grade prostatic intra‐epithelial neoplasia (HGPIN).
Methods
For this work, CXXC5 mRNA levels were measured by qPCR in 65 prostate needle‐biopsy samples, one per patient, from individuals undergoing diagnosis by histology of needle‐biopsy cores. Histological analysis to determine the presence of BPT (benign prostate tissue), PIA (proliferative inflammatory atrophy), HGPIN (high‐grade prostatic intra‐epithelial neoplasia), and PCa was performed in formalin‐fixed, paraffin‐embedded (FFPE) tissues from archived radical prostatectomy specimens from a group of 62 patients with pathology diagnosis of localized PCa (n = 50) or BPT (n = 12), who underwent surgical resection as their primary treatment. A set of 17 prostatectomy tissue specimens from this group, simultaneously bearing BPT, PIA, HGPIN and PCa, was selected for immunohistochemical evaluation of CXXC5 protein expression across these tissue lesions. CXXC5 mRNA and protein expressions were measured in a TMA constructed from archived FFPE radical prostatectomy (n = 33) and trans‐urethral prostatectomy tissue specimens (n = 17) from an independent patient cohort of 47 patients with a diagnosis of localized PCa, who underwent surgical resection as their primary treatment.
Ethical approval
The study was conducted with local ethics approval and according to the Declaration of Helsinki.
CXXC5 mRNA levels in prostatic needle‐biopsy cores
Biopsy tissue collection
Prostatic tissue specimens were obtained with local ethics approval and after signatures were collected on informed consent forms from patients undergoing diagnosis by histology of needle‐biopsy cores at the Hospital Universitario del Caribe in the city of Cartagena, Colombia; the studies were conducted according to the Declaration of Helsinki. Tissue biopsy specimens from participating patients were classified into benign prostate tissue (BPT) and PCa tissue, based on the pathology reports of the respective patients, and further confirmed by histological examination of matched ‘mirror’ biopsy cores taken from the same zone at the time of the biopsy procedure. A total of 65 prostate needle‐biopsy samples were collected, one per patient, and classified into BPT (n = 24) and PCa (n = 41). To preserve RNA integrity for molecular analysis, prostate tissue biopsy specimens from patients were immediately immersed in RNAlater® (Life Technologies, Carlsbad, CA, USA) in the operating room, stored overnight at 4°C and then frozen at −80°C until used for RNA extraction.
RNA isolation
Biopsy specimens stored in RNAlater® were thawed at room temperature, excess RNAlater® was removed, and samples were immediately submerged in RNA isolation lysis solution (TRI Reagent; Ambion, Inc., Carlsbad, CA, USA) and homogenized with a TissueRuptor (Qiagen, Valencia, CA, USA) following the manufacturer's instructions. Concentration and purity of total RNA samples were assessed by spectrophotometry at OD260/OD280 ratio with a NanoDrop 2000c (Thermo Scientific, Waltham, MA, USA). To eliminate any contaminating genomic DNA, 1 μg of total RNA was incubated with genomic DNA Wipeout Buffer (Qiagen) for 2 min at 42°C and then reverse‐transcribed into first‐strand cDNA in a 20 μl reaction volume, using QuantiTect Reverse Transcriptase kit (Qiagen) containing a mix of oligo‐dT and random primers. Samples were incubated at 42°C for 15 min, followed by inactivation at 95°C for 3 min, and stored at −20°C.
qPCR for CXXC5 mRNA expression
cDNA was used for subsequent qPCR to analyse the transcript expression of CXXC5 using previously designed primers for CXXC5 (Bettin et al. 2016) (Forward: 5′GGTGGACAAAAGCAACCCTA3′; Reverse: 5′TCAGCATCTCTGTGGACTGC3′), and β‐actin (Forward: 5′AGAAAATCTGGCACCACACC3′; Reverse: 5′GGGGTGTTGAAGGTCTCAAA3′). PCRs for each sample were carried out in triplicate, in 48‐well optical PCR plates (Applied Biosystems), using QuantiTect® SYBR® Green PCR Master Mix (Qiagen) in a StepOne thermocycler (Applied Biosystems, Foster City, CA, USA), with an initial denaturing step at 95°C for 15 min, followed by 40 cycles of amplification at 95°C for 15 s, 55°C for 45 s and 60°C for 1 s. Negative controls (non‐template control and negative reverse‐transcriptase control) were also included. Relative mRNA expression quantification for CXXC5 was calculated with the Sequence Detection System 2.1 software (Applied Biosystems), using the comparative CT method (2−ΔΔCT). Melting curves for all samples were acquired for quality control purposes, and expression levels for target gene were normalized to the expression levels of the reference gene β‐actin. Transcript levels in the PCa group were compared with levels in the BPT group. Fold‐change values were calculated using 2−ΔΔCT. P value was calculated by Mann–Whitney U‐test comparing fold changes in the PCa group relative to BPT group. Statistical analysis and graphs were performed with graphpad prism v5.0 (GraphPad Software Inc.), and P values < 0.05 were considered statistically significant.
Histological and immunohistochemical analysis of FFPE tissue samples
FFPE tissue collection
FFPE tissues were from archived radical prostatectomy specimens from a group of 62 patients with pathology diagnosis of localized PCa (n = 50) or BPT (n = 12), who underwent surgical resection as their primary treatment. Patients' age range was 50–81 years, with mean of 69.5 years. Archived FFPE radical prostatectomy tissue specimens were obtained from the Department of Pathology at Hospital Universitario del Caribe, Cartagena.
Histology of FFPE prostate tissue samples
A set of 17 prostatectomy tissue specimens, simultaneously bearing BPT (benign prostate tissue), PIA (proliferative inflammatory atrophy), HGPIN (high‐grade prostatic intra‐epithelial neoplasia) and PCa (prostate adenocarcinoma), was selected for immunohistochemical evaluation of CXXC5 protein expression across these tissue lesions. A pathologist blind to the original diagnosis and relevant clinical data examined the haematoxylin and eosin (H&E)‐stained tissue sections for the presence of these lesions. Histological grading of tissues with adenocarcinoma was based on GS system (Humphrey 2004). The presence of PIA in its two forms: simple atrophy (SA) and postatrophic hyperplasia (PAH) were evaluated using their morphological definitions, according to ‘Working Group Classification of Focal Prostate Atrophy Lesions’ (De Marzo et al. 2006). HGPIN was identified using criteria defined by Bostwick et al. (2004).
Immunohistochemistry of FFPE prostate tissue samples
CXXC5 expression was evaluated at the protein level by immunohistochemistry of FFPE prostatectomy specimens; 4‐μm FFPE prostate tissue serial sections were cut off, mounted on Superfrost Plus adhesion slides (Lomb Scientific, Sydney, Australia) and heated in a convention oven at 60°C for 45 min. Sections were deparaffinized in xylene and rehydrated in alcohol according to standard procedures, steamed in 10 mM citrate buffer (pH 6.0) to unmask the epitopes for 30 min, incubated with Hydrogen Peroxide Block and Protein Block (Abcam®, Cambridge, MA, USA) and then incubated overnight at 4°C with rabbit/IgG polyclonal anti‐CXXC5 antibody ab133191® (Abcam®, Cambridge, MA, USA) at 1:200 dilution. For detection of antibody binding, EXPOSE Mouse and Rabbit Specific HRP/DAB Detection IHC kit® (Abcam®, Cambridge, MA, USA) was used according to manufacturer's instructions. Negative control slides were incubated in absence of primary antibody only. All slide tissues were counterstained with haematoxylin, dehydrated and mounted. Images were analysed and captured at 400× and 100× magnification using an Eclipse 400 microscope connected to a DS‐Fi1 camera (Nikon, Japan). Immunostaining intensity was scored in BPT, PIA, HGPIN and PCa regions by a pathologist, using the nis‐elements‐3.01 software (Nikon), applying the H‐Score. For this, 10 fields were chosen at random at 100× magnification and the staining intensity in the benign luminal epithelial cells and tumour cells was scored as 0, 1, 2 or 3, corresponding to negative, weak, intermediate and strong brown staining respectively. The total number of cells in each field, and the number of cells stained at each intensity score was counted. The average percentage positive was calculated and the following formula was applied: H‐score = (% of cells stained at intensity category 1 × 1) + (% of cells stained at intensity category 2 × 2) + (% of cells stained at intensity category 3 × 3). H‐score values obtained in each tissue category (BPT, PIA, HGPIN and PCa) were compared by anova. CXXC5 staining was also compared between benign luminal epithelial cells and tumour epithelial cells, by unpaired t‐test using graphpad prism® v5.00 software (GraphPad Software Inc). A P < 0.05 was considered statistically significant.
Tissue microarray construction
TMA design and construction
CXXC5 mRNA and protein expressions were further validated in an independent patient cohort (n = 47) using a prostate tissue microarray (TMA) approach. TMA was constructed from archived FFPE radical prostatectomy (n = 33) and trans‐urethral prostatectomy tissue specimens (n = 14), obtained from the archives of the Department of Pathology at Hospital Universitario del Caribe, Cartagena, from patients with a diagnosis of localized PCa, who underwent surgical resection as their primary treatment. TMA design and construction were performed at the Sidney Kimmel Cancer Comprehensive Center, Johns Hopkins University (Baltimore, MD, USA). For each case, haematoxylin and eosin‐stained sections from donor blocks were subjected to pathological review to determine the presence of lesions of interest; tissue sections representative for each lesion were cut out from the respective block for inclusion into the TMA. Benign prostate tissue obtained from regions distant to lesions was also included for each case. TMA construction was performed according to a previously described technique, using 0.6‐mm cores of PCa, HGPIN, PIA or non‐neoplastic tissue from donor blocks (Fedor & De Marzo 2005); 4‐μm sections were cut off from the TMA block, and one section was stained with H&E to check the lesion in each tissue core according to the previous design in the tmaj® software. TMA processing was performed at Johns Hopkins University Oncology Tissue Services Core, Regional Oncology Research Center, (Baltimore). Table 1 shows the number of cores grouped by lesion.
Table 1.
Number of cores from each tissue lesion included in the TMA constructed with tissue samples from a total of 47 patients
| Tissue/Lesion | Number of cores | Number of patientsa |
|---|---|---|
| BPT | 78 | 28 |
| PIA | 102 | 29 |
| HGPIN | 58 | 15 |
| PCa | 143 | 35 |
| Total number of cores | 381 | – |
Number of patients from which the samples for each tissue category were obtained.
TMA immunohistochemistry and data analysis
To evaluate CXXC5 protein expression in PCa, PIA, HGPIN and BPT, 4‐μm sections from the TMA block were subjected to immunohistochemistry using the previous protocol for FFPE tissues. To quantify CXXC5 expression in each case represented in the TMA, immunostaining in each lesion was scored by microscopically assessing the percentage of luminal epithelial cells with positive staining, to obtain a final H‐Score. Mann–Whitney U‐test and anova were used to compare H‐score values between groups using graphpad prism® v5.00 software (GraphPad Software Inc, San Diego, CA); P < 0.05 was considered statistically significant.
TMA chromogenic in situ hybridization
CXXC5 mRNA in FFPE prostate tissue samples included in the TMA was measured with RNAscope assay (Advanced Cell Diagnostics, ACD, Hayward, CA) following the manufacturer's instructions. In brief, 5‐μm sections were deparaffinized, standard RNAscope 2.5 HD Brown Assay protocol was used with the following pretreatment conditions: target retrieval: 15 min at 95°C. Protease Plus: 30 min at 40°C. Hybridization signals were amplified and visualized. Chromogenic detection was performed using DAB followed by counterstaining with haematoxylin. Assays were performed in parallel with positive and negative controls, to ensure reliable results. The endogenous housekeeping gene Hs‐PPIB (human peptidylprolyl isomerase B) was used as positive control to assess both tissue RNA integrity and assay procedure. Positive staining with signals easily visible under a 10× objective lens was considered adequate. The bacterial gene DapB (dihydrodipicolinate reductase) was used as negative control to assess background signals. RNAscope tissue staining was examined under standard bright‐field microscopy (Nikon Eclipse 400®) at 40–100× magnification. Positive signals are shown as brown punctuate dots. DapB, Hs‐PPIB and CXXC5 hybridization to TMA sections was captured at 100× magnification using the nis‐elements‐3.0® software (Nikon). After image capture, CXXC5 RNAscope positive signals were quantified. We scored and compared the number of dots per cell, which correlates to the number of RNA copy numbers, in BPT, PIA, HGPIN and tumour regions (PCa), using a semiquantitative scoring guideline, as follows: 0: no staining or <1 dot/10 cells; 1: 1–3 dots/cell; 2: 4–9 dots/cell and none or very few dot clusters; 3: 10–15 dots/cell and <10% dots in clusters; 4: >15 dots/cell and >10% dots in clusters. To verify the success of staining, CXXC5 signal was compared to both negative (DapB) and positive (PPIB) controls.
Results
CXXC5 mRNA expression in prostate tissue (qPCR in needle‐biopsy cores)
qPCR was performed in biopsies classified as prostate cancer (PCa) or benign prostatic tissue (BPT) according to pathology reports. We found that CXXC5 transcript levels were differentially expressed in PCa compared to BPT. As shown in Figure 1, expression levels of CXXC5 were significantly higher in PCa biopsies (n = 41) compared to BPT biopsies (n = 24; 0.036 Mann–Whitney U‐test).
Figure 1.
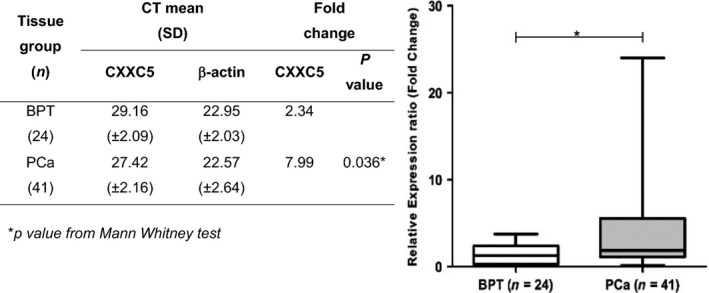
CXXC5 mRNA expression in prostate tissue biopsies. Transcript levels in biopsy specimens from BPT and PCa groups using the CT comparative approach. Positive fold expression indicates overexpression of CXXC5 transcripts relative to the reference gene in each biopsy group.
CXXC5 protein expression in human prostate tissue specimens
Immunohistochemical staining of CXXC5 protein was performed in prostatectomy specimens from 62 patients, classified as PCa (n = 50) and BPT (n = 12). CXXC5 protein expression was significantly increased in cancerous epithelial cells, compared to benign epithelial cells (Figure 2a). CXXC5 staining was weak in benign prostate tissue where it was observed mainly in the nucleus of epithelial cells (Figure 2b), but it was strong in cancerous prostate tissue, where it was observed both in the cytoplasm and the nucleus of epithelial cells (Figure 2c). Staining intensity and extension were determined using the H‐score. Benign luminal epithelial cells had a mean H‐score value of 139.3 (95% CI: 125–153.6), while tumour cells had a mean H‐score value of 239.3 (95% CI: 227.3–251.2; P < 0.0001, t‐test). Immunohistochemical evaluation comparing CXXC5 expression in matched benign and cancerous tissue was performed to a subgroup of 30 prostatectomy tissue samples; we found that staining intensity was stronger in malignant acini compared to benign acini (Figure 2f) (P < 0.001, n = 30, paired t‐test).
Figure 2.
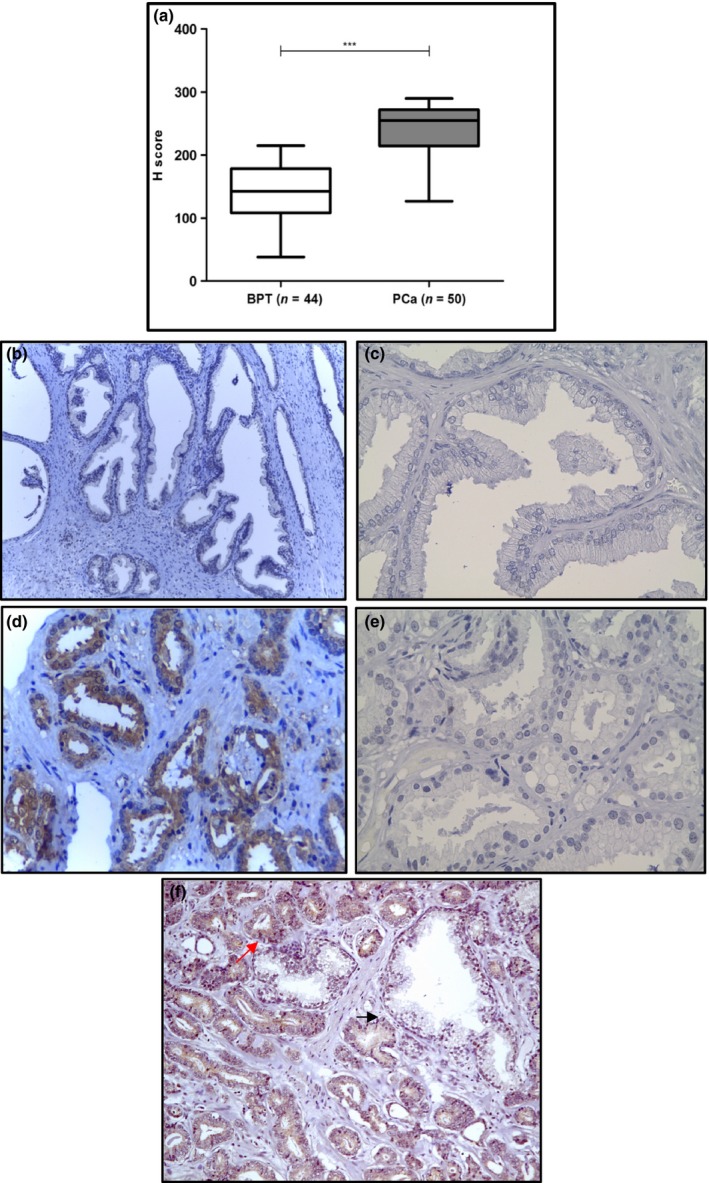
CXXC5 protein expression in benign prostate tissue and prostate cancer. (a) CXXC5 protein expression was evaluated by IHC and compared in prostate tissue with benign glands (n = 44), and prostate tissue with tumour glands (n = 50). Immunohistochemistry staining of CXXC5 in benign prostate tissue with absent to mild staining (b) and prostate cancer tissue with strong staining (d). Negative control (no primary antibody) for benign prostate tissue (c) and malignant prostate tissue (e). CXXC5 staining in malignant acini (red arrow) compared to benign acini (black arrow) from the same patient (f). Magnification: 100×. Brown colour: DAB. Blue colour: Haematoxylin counterstain. ***P < 0.0001. [Colour figure can be viewed at wileyonlinelibrary.com].
To evaluate the expression pattern of CXXC5 across different prostatic lesions, protein expression was evaluated in 17 cases simultaneously bearing BPT, PIA, HGPIN and PCa. We found that CXXC5 protein expression was significantly higher in PCa, HGPIN and PIA compared to benign glands (P < 0.001). In this group of samples, we found a significant staining difference between the different lesions (P < 0.0001, Kruskal–Wallis test). There was a higher immunohistochemical staining score in PCa (243.4, 95% CI: 222.1–264.6) followed in decreasing order by HGPIN (231.5, 95% CI: 207.2–255.9), PIA (169.9, 95% CI: 143.4–196.4) and benign epithelium (143.5, 95% CI: 122.1–165), (Figure 3).
Figure 3.
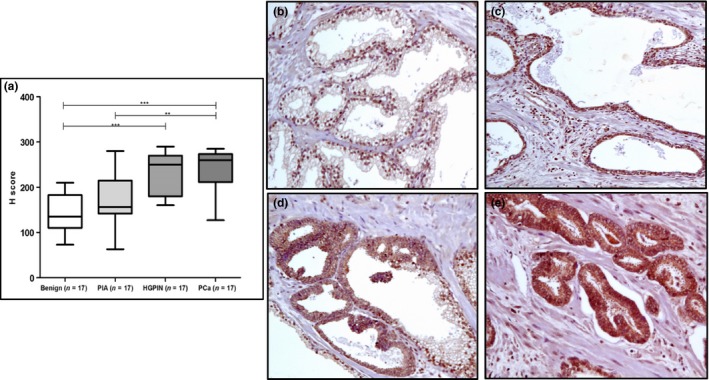
CXXC5 protein expression in prostatectomy specimens. (a) IHC score across tissue lesions in prostatectomy specimens. CXXC5 showing mainly nuclear staining in BPT (b), nuclear and cytoplasmic staining in PIA (c), HGPIN (d) and PCa (e). Immunohistochemical staining of CXXC5 showed absent to mild staining in BPT, mild to moderate staining in PIA, mild to moderate staining in HGPIN and strong staining in PCa. Magnification: 100×. ***P < 0.0001, **P < 0.001. [Colour figure can be viewed at wileyonlinelibrary.com].
Chromogenic in situ hybridization (CISH) in TMA
CXXC5 mRNA expression was evaluated by CISH assay (RNAscope® 2.0 FFPE Assay, Advanced Cell Diagnostics, INC., Hayward, CA), in a TMA arrayed with 381 cores from benign prostate tissue and different tissue lesions from 47 prostatectomy specimens. CISH analysis showed that overall CXXC5 mRNA expression was higher in PCa followed in decreasing order by HGPIN, PIA and BPT (Figure 4), with a significant difference in CXXC5 mRNA expression between BPT and HGPIN, and between BPT and PCa (P < 0.0001, anova test). Difference in expression was not significant between BPT and PIA (P = 0.37, t‐test), nor between HGPIN and PCa (P = 0.19, t‐test).
Figure 4.
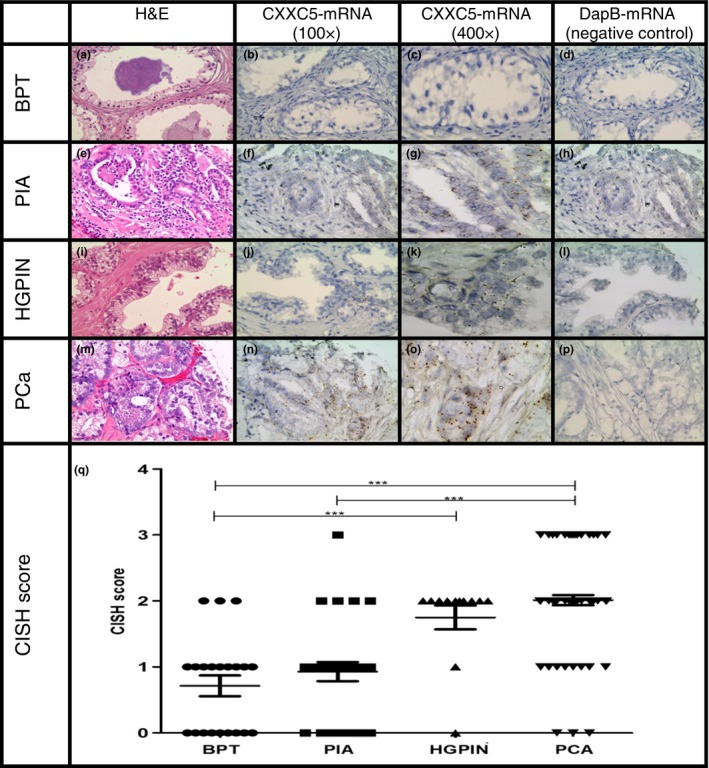
RNA‐CISH staining of CXXC5 in BPT, PIA, HGPIN and PCa in a human prostate tissue microarray. Expression was visualized using DAB‐labelled probes and a magnification of 100× and 400×. BPT in a prostatectomy tissue spot with H&E staining (a), RNA‐CISH staining of CXXC5 100× (b) and 400× (c), RNA‐CISH staining of the negative control DapB (d). PIA in a prostatectomy tissue spot with H&E staining (e), RNA‐CISH staining of CXXC5 showing that signal was located predominantly in epithelial compartment with 2–3 dots/cell 100× (f) and 400× (g) and RNA‐CISH staining of the negative control DapB (h). HGPIN in a prostatectomy tissue spot with H&E staining (i), RNA‐CISH staining of CXXC5 showing that signal was located in epithelial compartment with 3–4 dots/cell 100× (j) and 400× (k) and RNA‐CISH staining of the negative control DapB (l). PCa in a prostatectomy tissue spot with H&E staining (m), RNA‐CISH staining of CXXC5 showing that signal was located in tumour compartment in clustered pattern, 100× (n) and 400× (o), RNA‐CISH staining of the negative control DapB (p). CISH staining score across prostate tissue lesions (q). ***P < 0.0001. [Colour figure can be viewed at wileyonlinelibrary.com].
CXXC5 protein expression in human prostate tissue microarray
CXXC5 protein expression was evaluated by IHC in the same TMA used for CISH analysis, arrayed with 381 cores from benign prostate tissue and different tissue lesions from 47 patients. Immunohistochemical evaluation showed that CXXC5 staining was present in nucleus and cytoplasm of epithelial cells. Compared to BPT, CXXC5 expression was higher in cores with PCa (P < 0.0001), HGPIN (P = 0.0006) or PIA (P < 0.0001). anova test showed a significant difference in staining between tissue lesions (P < 0.0001). There was a higher mean in immunohistochemical staining score in PCa (242.2, 95% CI: 235.4–249.1), compared to HGPIN (214.2, 95% CI: 198.8–229.7), PIA (195.2, 95% CI: 184.4–206.1), and BPT (99.71, 95% CI: 90.5–108.9). The expression of CXXC5 in cores with PCa was higher than cores with HGPIN (P = 0.0006; t‐test), and cores with PIA (P < 0.0001; t‐test). Also, there was a significant difference in the expression of CXXC5 between cores with HGPIN and cores with PIA (P = 0.0006, t‐test). Results of CXXC5 immunostaining in TMA are presented in Figure 5.
Figure 5.
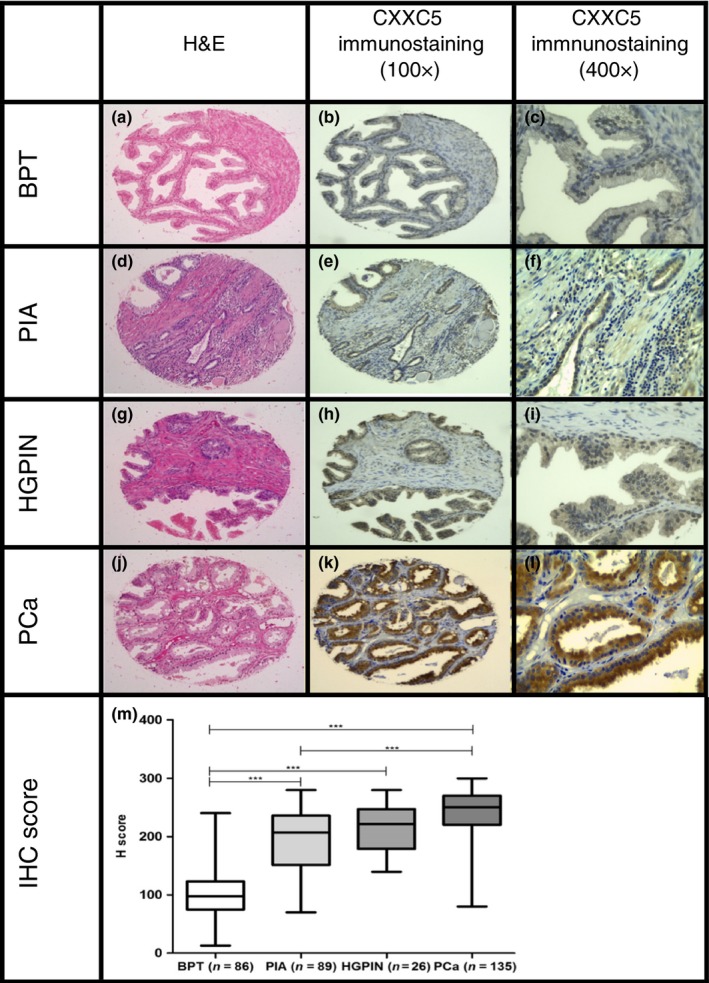
Immunohistochemical staining of CXXC5 in BPT, PIA, HGPIN and PCa in a human prostate tissue microarray. BPT in a prostatectomy tissue spot with H&E staining 100× (a), immunohistochemical staining of CXXC5 showing absent to mild staining in epithelial compartment (b,c). PIA in a prostatectomy tissue spot with H&E staining 100× (d), immunohistochemical staining of CXXC5 showing mild to moderate staining in epithelial compartment (e,f). HGPIN in a prostatectomy tissue spot with H&E staining 100× (g), immunohistochemical staining of CXXC5 showing mild to moderate staining in epithelial compartment for CXXC5 (h,i). PCa in a prostatectomy tissue spot with H&E staining 100× (j), immunohistochemical staining of CXXC5 showing strong staining in tumour compartment for CXXC5 (k,l). H‐score of IHC staining across tissue lesions (m). ***P < 0.0001. [Colour figure can be viewed at wileyonlinelibrary.com].
Comparison of CXXC5 mRNA and protein expressions in human prostate tissue microarray
CXXC5 expression was analysed in a TMA at the mRNA and protein levels. Protein expression levels determined by IHC positively correlated with transcript levels observed by CISH. To test this, we compared mRNA and protein abundance levels in each sample using the Spearman rank correlation; mRNA abundance was represented by CISH score, and protein abundance was represented by H‐score. A statistically significant, positive Spearman rank correlation coefficient was obtained (r s= 0.6098, P < 0.0001). We found that malignant prostate tissue expresses higher CXXC5 levels compared to benign tissue. Consistent with CXXC5 transcript levels, CXXC5 protein levels were gradually increasing across the lesions evaluated (Figure 6). Thus, our results provide evidence that benign and malignant prostate tissue differentially expresses CXXC5, with a positive correlation between higher levels of expression and malignancy.
Figure 6.
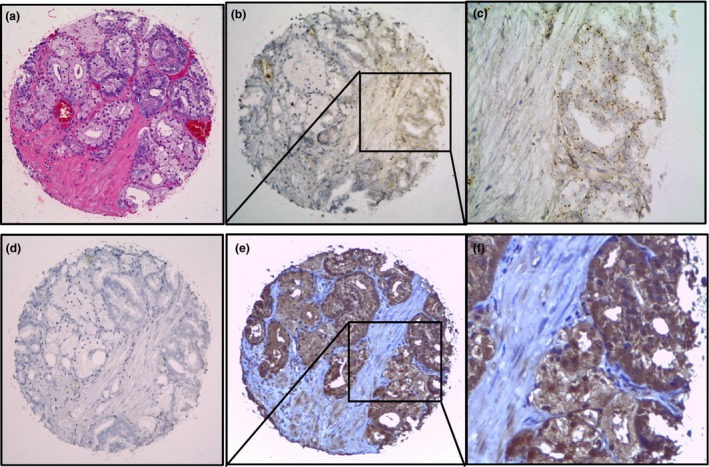
Comparison of RNA‐chromogenic in situ hybridization (CISH) and immunohistochemistry of CXXC5. Prostate cancer foci in a prostatectomy tissue spot with H&E staining (a), RNA‐CISH staining of CXXC5 at 100× (b) and 400× (c) showing that signal was located in tumour compartment in clustered pattern, CISH with negative staining for the negative control DapB (d), immunohistochemical staining of CXXC5 showing strong staining in tumour compartment at 100× (e) and 400× (f). [Colour figure can be viewed at wileyonlinelibrary.com].
Discussion
We have previously reported overexpression of CXXC5 in prostate cancer cell lines from animal and human origin (Reyes et al. 2007; Bettin et al. 2016). The goal of this study was to investigate the expression pattern of this gene in prostate cancer tissue and across different prostate lesions, namely PIA and HGPIN. Our results show that prostate cancer tissue significantly expresses higher mRNA and protein levels of CXXC5 compared to benign prostate tissue. Immunohistochemistry of prostate cancer tissue specimens revealed that CXXC5 expression was significantly stronger in epithelial cells in cancerous acini compared to epithelial cells in matched normal adjacent benign acini from the same patient. Compared to benign acini, evaluation of CXXC5 expression at the mRNA and protein levels across different prostate lesions confirmed that CXXC5 was not only upregulated in prostate adenocarcinoma, but also in HGPIN and PIA. Until now, HGPIN is the only recognized direct precursor for prostate adenocarcinoma (Bostwick et al. 2004). PIA has been considered a benign lesion with certain genetic instability that at times may develop into PIN or carcinoma when the balance between anti‐carcinogens and carcinogens is perturbed (Woenckhaus & Fenic 2008). A progression model linking the effects of chronic inflammation to the molecular and cellular modifications underlying the pathogenesis of prostate adenocarcinoma has been proposed. Such model includes focal atrophic lesions with an increased fraction of proliferating epithelial cells associated with chronic inflammation, or PIA (De Marzo et al. 1999, 2006). PIA lesions may arise in the setting of increased oxidative stress and may represent a precursor to high‐grade prostatic intra‐epithelial neoplasia (HGPIN) and prostate cancer (De Marzo et al. 2003, 2003 De Marzo et al. 2007; Nelson et al. 2003; Sfanos & De Marzo 2012). In the present study, we observed increasing CXXC5 expression across this proposed PCa progression model. Our findings may implicate the upregulation of this gene in prostate cancer progression. Overexpression of CXXC5 was previously reported by Knappskog et al. in breast carcinoma, malignant melanoma and papillary thyroid carcinoma (Knappskog et al. 2011); these authors found a significant overexpression of CXXC5 in malignant tissue compared to the non‐tumour tissue counterpart and reported CXXC5 as an unfavourable prognostic factor for breast cancer. Based on their findings, they postulated that high expression levels of CXXC5 could be related to the malignant potential of tumour cells and suggested that this gene may represent a potential biomarker for the diagnosis of these malignancies (Knappskog et al. 2011). Also, their finding that high levels of CXXC5 were associated with wild‐type TP53 may indicate that CXXC5 levels could substitute for TP53 mutations as a poor prognostic marker in breast cancer (Knappskog et al. 2011). Our results constitute a starting point for subsequent studies on the biological role and potential clinical implications of CXXC5 expression in prostate cancer. More detailed studies are needed to clarify the potential role of this gene in prostate cancer progression.
Conflicts of interest
The authors declare that they have no competing interests.
Funding source
This work was financially supported by the Administrative Department of Science, Technology and Innovation/Colciencias grant # 10745921483 and the University of Cartagena Res. 04379‐2014 Act # 021‐2015.
Acknowledgements
The authors are thankful to the Department of Pathology of the Hospital Universitario del Caribe for providing the tissue samples; to Alfonso Bettin for technical assistance in qPCR studies; to Dr. Angelo De Marzo from Johns Hopkins University School of Medicine, for all the support in TMA construction and processing.
Reference
- Andersson T., Sodersten E., Duckworth J.K. et al (2009) CXXC5 is a novel BMP4‐regulated modulator of Wnt signaling in neural stem cells. J. Biol. Chem. 284(6), 3672–3681. [DOI] [PubMed] [Google Scholar]
- Bettin A., Reyes I. & Reyes N. (2016) Gene expression profiling of prostate cancer‐associated genes identifies fibromodulin as potential novel biomarker for prostate cancer. Int. J. Biol. Markers 31(2), e153–e162. [DOI] [PubMed] [Google Scholar]
- Bostwick D.G., Liu L., Brawer M.K. & Qian J. (2004) High‐grade prostatic intraepithelial neoplasia. Rev. Urol. 6(4), 171–179. [PMC free article] [PubMed] [Google Scholar]
- Cierpicki T., Risner L.E., Grembecka J. et al (2010) Structure of the MLL CXXC domain‐DNA complex and its functional role in MLL‐AF9 leukemia. Nat. Struct. Mol. Biol. 17(1), 62–68. [DOI] [PMC free article] [PubMed] [Google Scholar]
- De Marzo A.M., Marchi V.L., Epstein J.I. & Nelson W.G. (1999) Proliferative inflammatory atrophy of the prostate: implications for prostatic carcinogenesis. Am. J. Pathol. 155(6), 1985–1992. [DOI] [PMC free article] [PubMed] [Google Scholar]
- De Marzo A.M., Meeker A.K., Zha S. et al (2003) Human prostate cancer precursors and pathobiology. Urology 62(5 Suppl 1), 55–62. [DOI] [PubMed] [Google Scholar]
- De Marzo A.M., Platz E.A., Epstein J.I. et al (2006) A working group classification of focal prostate atrophy lesions. Am. J. Surg. Pathol. 30(10), 1281–1291. [DOI] [PubMed] [Google Scholar]
- De Marzo A.M., Platz E.A., Sutcliffe S. et al (2007) Inflammation in prostate carcinogenesis. Nat. Rev. Cancer 7(4), 256–269. [DOI] [PMC free article] [PubMed] [Google Scholar]
- Devaney J.M., Wang S., Funda S. et al (2013) “Identification of novel DNA‐methylated genes that correlate with human prostate cancer and high‐grade prostatic intraepithelial neoplasia”. Prostate Cancer Prostatic Dis. 16(4), 292–300. [DOI] [PubMed] [Google Scholar]
- Fedor H.L. & De Marzo A.M. (2005) Practical methods for tissue microarray construction. Methods Mol. Med. 103, 89–101. [DOI] [PubMed] [Google Scholar]
- Ferlay J., Soerjomataram I., Dikshit R. et al (2015) Cancer incidence and mortality worldwide: sources, methods and major patterns in GLOBOCAN 2012. Int. J. Cancer 136(5), E359–E386. [DOI] [PubMed] [Google Scholar]
- Humphrey PA (2004) “Gleason grading and prognostic factors in carcinoma of the prostate”. Mod. Pathol. 17(3), 292–306. [DOI] [PubMed] [Google Scholar]
- Katoh M. (2004) Identification and characterization of human CXXC10 gene in silico. Int. J. Oncol. 25(4), 1193–1199. [PubMed] [Google Scholar]
- Knappskog S., Myklebust L.M., Busch C. et al (2011) RINF (CXXC5) is overexpressed in solid tumors and is an unfavorable prognostic factor in breast cancer. Ann. Oncol. 22(10), 2208–2215. [DOI] [PubMed] [Google Scholar]
- Nelson W.G., De Marzo A.M. & Isaacs W.B. (2003) Prostate cancer. New Eng. J. Med. 349(4), 366–381. [DOI] [PubMed] [Google Scholar]
- Pendino F., Nguyen E., Jonassen I. et al (2009) Functional involvement of RINF, retinoid‐inducible nuclear factor (CXXC5), in normal and tumoral human myelopoiesis. Blood 113(14), 3172–3181. [DOI] [PubMed] [Google Scholar]
- Reyes I., Tiwari R., Geliebter J. & Reyes N. (2007) DNA microarray analysis reveals metastasis‐associated genes in rat prostate cancer cell lines. Biomedica 27(2), 190–203. [PubMed] [Google Scholar]
- Sfanos K.S. & De Marzo A.M. (2012) Prostate cancer and inflammation: the evidence. Histopathology 60(1), 199–215. [DOI] [PMC free article] [PubMed] [Google Scholar]
- Woenckhaus J. & Fenic I. (2008) Proliferative inflammatory atrophy: a background lesion of prostate cancer? Andrologia 40(2), 134–137. [DOI] [PubMed] [Google Scholar]


