

Abstract
Increased deposition of β-amyloid (Aβ) protein is one of the typical characteristics of Alzheimer's disease (AD). Recent evidence has demonstrated that the microRNA let-7 family, which is highly expressed in the central nervous system, participates in the regulation of pathologic processes of AD. In the present study, the effect of let-7a overexpression on Aβ1-40-induced neurotoxicity was evaluated in PC12 and SK-N-SH cells. The results indicated that overexpression of let-7a enhanced the neurotoxicity induced by Aβ1–40 in PC12 and SK-N-SH cells. In addition, the apoptosis induced by Aβ1–40 in PC12 and SK-N-SH cells was increased by let-7a overexpression. Furthermore, Aβ1–40 treatment increased the protein levels of microtubule-associated protein 1A/1B-light chain 3 (LC3) and beclin-1 and increased the LC3 II/I ratio. The mRNA expression levels of beclin-1, autophagy protein 5 (Atg-5) and Atg-7 were also increased by Aβ1–40 treatment in PC12 cells. Let-7a overexpression further upregulated the above autophagy-related markers. Furthermore, the protein level of p62 was increased by Aβ1–40 treatment, and this was further enhanced by let-7a overexpression. Finally, the present results demonstrated that the phosphoinositide-3-kinase (PI3K)/Akt/mammalian target of rapamycin (mTOR) signaling pathway was involved in the autophagy regulation by let-7a. In conclusion, the present study demonstrates that the neurotoxicity induced by Aβ1–40 is augmented by let-7a overexpression via regulation of autophagy, and the PI3K/Akt/mTOR signaling pathway also serves a function in this process.
Keywords: let-7a, β-amyloid 1-40, Alzheimer's disease, autophagy, phosphoinositide-3-kinase/Akt/mammalian target of rapamycin
Introduction
Alzheimer's disease (AD) is the most prevalent disease of dementia, and is characterized as a chronic, progressive neurodegenerative disorder (1). With the accelerated trend of population aging, the incidence of AD is rising. Based on epidemiological data, by 2050, the number of patients with AD in the USA will be more than three times higher than in 2010 (2), and a similar trend may be seen in China (3). The primary pathological changes of AD are neurofibrillary tangles, senile plaque deposits and neuronal cell death. β-amyloid (Aβ) protein has been demonstrated to be a key component in senile plaques and tau protein hyperphosphorylation has been indicated to promote neurofibrillary tangles (4,5).
In recent decades, the role of autophagy in AD development has attracted widespread attention. Increasing evidence has suggested that autophagy is a double-edged sword in AD development (6). Although a great deal of research has demonstrated that autophagy has a beneficial effect against AD (7–9), abnormalities of autophagy may also be a major risk factor for AD (10). Aβ1–42 or Aβ1-40, and their precursor amyloid precursor protein (APP), and β-cleaved carboxyl-terminal domain of APP have been demonstrated to be enriched in autophagic vacuoles (AVs) that were accumulated in abnormalities of autophagy (11). In addition, some scholars have suggested that significant accumulations of immature AVs indicate the failure of AV transport and maturation to lysosomes in AD (12,13). The autophagic-lysosomal pathway dysfunction that results in AV accumulation and lysosomal proteolysis defects occurs in neurites throughout the AD brain (14). Cho et al (15) recently demonstrated that the vast accumulation of AVs was the cause for Aβ production in AD. Therefore, defective autophagy contributes to the course of AD.
The abnormal expression of microRNA (miRNA) is reported to be closely associated with the pathogenesis of AD. The let-7 miRNA family was first identified in Caenorhabditis elegans and is highly conserved in multiple species (16). Let-7 is known as a classical development regulator, which participates in the regulation of various physiological and pathological events such as cell proliferation, differentiation, apoptosis, immune response, tumorigenesis and metastasis (17). Dubinsky et al (18) recently reported that let-7 miRNA promoted autophagy in primary cortical neurons in vitro and in the brain in vivo. Furthermore, the expression of let-7a, let-7b and let-7e were upregulated in the progression of AD in a rabbit model (19). However, the expression of let-7d and let-7g was found to be downregulated in plasma samples of patients with AD (20). At present, the effect of let-7a on autophagy in the process of AD has yet to be determined.
In the present study, Aβ1-40-treated adrenal pheochromocytoma PC12 and human neuroblastoma SK-N-SH cell lines were used to establish AD models in vitro. The effect of let-7a on Aβ1-40-induced neurotoxicity was investigated. It was identified that overexpression of let-7a aggravated the Aβ1-40-induced injury in PC12 and SK-N-SH cells by regulating autophagy.
Materials and methods
Cell culture and treatment
PC12 and SK-N-SH cells were purchased from the Cell Bank of Type Culture Collection of Chinese Academy of Sciences, Shanghai, China. PC12 cells were maintained in RPMI-1640 (31800-014; Gibco; Thermo Fisher Scientific, Inc., Waltham, MA, USA) supplemented with 10% fetal bovine serum (FBS; SH30084.03; Hyclone; GE Healthcare Life Sciences; Logan, UT, USA) 100 U/ml penicillin and 100 U/ml streptomycin. SK-N-SH cells were maintained in minimum essential medium (MEM, 41500034, Gibco; Thermo Fisher Scientific, Inc.) supplemented with 10% FBS, 100 U/ml penicillin and 100 U/ml streptomycin. The two cell lines were cultured at 37°C under a humidified atmosphere of 5% CO2. Aβ1–40 (GL Biochem, Ltd., Shanghai, China) was dissolved in sterile PBS and incubated for 5 days at 37°C to induce aggregation prior to treatment. 4×10³ cells/well PC12 and SK-N-SH cells were seeded in 6-well plates and then treated with 500 nM Aβ1–40 for 7 days at 37°C to establish the AD model.
Transient transfection
The let-7a mimic and scrambled negative control miRNA (miR-NC) were obtained from Shanghai GenePharma Co., Ltd. (Shanghai, China). The sequences were as follows: let-7a mimic, 5′-UGAGGUAGUAGGUUGUAUAGUU-3′; miR-NC 5′-UUCUCCGAACGUGUCACGUTT-3′. Aβ1-40-treated PC12 and SK-N-SH cells were transfected with 100 pmol let-7a mimic or miR-NC using Lipofectamine 2000 (Invitrogen; Thermo Fisher Scientific, Inc.), following the manufacturer's protocol. The cells were divided into four groups: Control, Aβ1-40, Aβ1–40 + let-7a mimic and Aβ1–40 + miR NC. Cells were collected for various assays at 24 or 48 h after the transfection.
RNA extraction and reverse transcription-quantitative polymerase chain reaction (RT-qPCR)
At 24 h after the transfection, total RNA from PC12 cells and SK-N-SH cells was extracted using TRIzol reagent (Invitrogen; Thermo Fisher Scientific, Inc.) following the manufacturer's protocol. For mRNA analysis, cDNA was synthesized using a PrimeScript™ 1st strand cDNA Synthesis Kit (Takara Bio, Inc., Otsu, Japan) followed according to the manufacturer's protocol. For miRNA analysis, cDNA was synthesized using an miScript Reverse Transcription kit (Qiagen GmbH, Hilden, Germany) followed according to the manufacturer's protocol. Then, qPCR was performed using a SYBR Premix Ex Taq II kit (Takara Bio, Inc.) in a 7500 Real-Time PCR system (Applied Biosystems; Thermo Fisher Scientific, Inc.). The thermocycling conditions consisted of denaturation at 95°C for 10 min, 95°C for 10 sec, annealing at 60°C for 20 sec, extension at 72°C for 30 sec for 40 cycles. The primer sequences used are shown in Table I. In three repeated experiments, the mRNA and miRNA expression levels were normalized to internal controls β-actin and U6 using the 2−∆∆Cq method (21), respectively.
Table I.
Oligonucleotide primer sets for quantitative polymerase chain reaction.
| Name | Sequence (5′-3′) | Length (bp) |
|---|---|---|
| Beclin-1 | F: CAGCAGTTCAAAGAAGAGGTG | 21 |
| R: GAGGACACCCAAGCAAGAC | 19 | |
| Atg-5 | F: AGTGGAGGCAACAGAACCC | 19 |
| R: TCCGACCACCGTCACCTTA | 21 | |
| Atg-7 | F: GGGCTATTACTACAATGGTGAC | 22 |
| R: TCTCATTGGCTGACTGCTC | 19 | |
| Let-7a | F: GCGACGATGAGGTAGTAGGTTGT | 23 |
| R: GTGCAGGGTCCGAGGTATTC | 20 | |
| β-actin | F: GGAGATTACTGCCCTGGCTCCTAGC | 25 |
| R: GGCCGGACTCATCGTACTCCTGCTT | 25 | |
| U6 | F: CTCGCTTCGGCAGCACA | 17 |
| R: AACGCTTCACGAATTTGCGT | 20 |
F, forward; R, reverse; Atg, autophagy protein.
MTT assay
An MTT assay was performed to evaluate cell viability at 48 h after the transfection. Briefly, 3×10³ PC12 and SK-N-SH cells/well were seeded in 96-well plates and exposed to the aforementioned treatments. Subsequently, 20 µl MTT (Sigma-Aldrich; Merck KGaA, Darmstadt, Germany) at a concentration of 5 mg/ml was added into each well. Following incubation for 4 h at 37°C, the medium was discarded and 200 µl DMSO was added into each well. The formazan crystalline product was dissolved and optical density was measured at 490 nm using a microplate reader.
Hoechst 33342 staining
At 48 h after the transfection, Hoechst 33342 staining was performed to evaluate the morphological changes of apoptotic nuclei. 2×10⁶ PC12 and SK-N-SH cells/well were seeded into 6-well plates and subjected to the aforementioned treatments. The cells were fixed with 4% paraformaldehyde for 20 min at room temperature. Subsequently, the cells were washed with PBS and incubated with 10 µg/ml Hoechst 33342 for 5 min at 37°C. Following washing with PBS three times for 3 min each, the cells were observed under a fluorescence microscope at a magnification of ×400. The apoptotic nuclei appeared condensed or fragmented compared with normal nuclei.
Flow cytometry for cell apoptosis analysis
At 48 h after the transfection, the percentage of apoptosis in PC12 cells was quantified using the Annexin V-Fluorescein Isothiocyanate (FITC)/Propidium Iodide (PI) Apoptosis Detection kit (KGA106; KeyGen Biotech Co., Ltd., Nanjing, China), according to the manufacturer's protocol. Briefly, 2×10⁶ cells from different groups were washed with PBS, stained with Annexin V-FITC and PI for 15 min in the dark at room temperature. Then samples (10,000 cells/sample) were analyzed using a flow cytometer (BD Accuri C6; BD Biosciences, San Jose, CA, USA).
Western blot analysis
At 48 h after the transfection, western blot assay was performed. The following primary antibodies were used: Anti-phosphoinositide 3-kinase (PI3K) (1:500; WL02240; Wanleibio, Co., Ltd., Shenyang, China), anti-Akt (1:500; WL0003; Wanleibio, Co., Ltd.), anti-phosphorylated (p)-Akt (1:500; WLP001; Wanleibio, Co., Ltd.), anti-mammalian target of rapamycin (mTOR; 1:200; sc-101738; Santa Cruz Biotechnology, Inc., Dallas, TX, USA), anti-p-mTOR (sc-8319; 1:200; Santa Cruz Biotechnology, Inc.), anti-microtubule-associated protein 1A/1B-light chain 3 (LC3; 1:500; WL01506; Wanleibio, Co., Ltd.), anti-beclin-1 (1:500; WL02237; Wanleibio, Co., Ltd.), anti-p62 (1:500; WL02385; Wanleibio, Co., Ltd.), anti-β-actin (1:500; WL01845; Wanleibio, Co., Ltd.). Briefly, cells were lysed with RIPA lysis buffer (Beyotime Institute of Biotechnology, Haimen, China). Protein concentration was determined using the BCA method. Proteins from each sample (20 µg) were separated by 8, 10 or 13% SDS-PAGE and transferred to polyvinylidene fluoride membranes. The membranes were blocked with 5% dried skimmed milk for 1 h at room temperature and incubated with primary antibodies at 4°C overnight. Subsequently, IgG conjugated goat anti-rabbit (1:5,000; WLA023; Wanleibio Co., Ltd.) or IgG conjugated goat anti-mouse (1:5,000; WLA024; Wanleibio Co., Ltd.) secondary antibodies were added for 30 min at room temperature. Blots were developed using enhanced chemiluminescence detection reagent (Beyotime Institute of Biotechnology). Scanning densitometry using a Gel-Pro Analyzer 4 software (Media Cybernetics, Inc., Rockville, MD, USA) was used to assess the level of each target protein relative to β-actin in three repeated experiments.
Immunofluorescence staining
Briefly, at 48 h after the transfection, 2×10⁶ PC12 cells from different treatment groups were plated to slides and fixed with 4% paraformaldehyde for 15 min at room temperature. After washing with PBS three times for 5 min each, the cells were permeabilized with 0.1% Triton X-100 for 30 min at room temperature, followed by blocking with 10% normal goat serum (Beijing Solarbio Science and Technology Co., Ltd., Beijing, China) for 15 min at room temperature. Cells were subsequently incubated with primary antibody LC3 (WL01506; Wanleibio, Co., Ltd.) at a 1:200 dilution at 4°C overnight. After washing with PBS three times, the cells were incubated with Cy3-conjugated secondary antibody (dilution, 1:200; A0516; Beyotime Institute of Biotechnology) for 30 min. The nuclei of cells were stained with DAPI for 5 min at room temperature. Slides were viewed by immunofluorescence microscopy (BX53; Olympus Corp., Tokyo, Japan) at ×400 magnification.
Inhibition of autophagy in PC12 cells
To inhibit autophagy, PC12 cells (2×10⁶ cells/well) were incubated with the autophagy inhibitor 3-methyladenine (3-MA; 1 mM; Sigma-Aldrich; Merck KGaA) at 37°C for 1 h prior to transfection with let-7a mimic. The cells were divided into five groups: Control, Aβ1-40, Aβ1–40 + let-7a mimic, Aβ1–40 + miR-NC and Aβ1–40 + let-7a mimic + 3-MA.
Activation of the PI3K/Akt/mTOR pathway in PC12 cells
To induce activation of the PI3K/Akt/mTOR pathway, PC12 cells with different treatments were treated with 100 ng/ml insulin-like growth factor 1 (IGF-1; Bachem AG, Bubendorf, Switzerland prior to transfection for 48 h at 37°C. The cells were divided into five groups: Control, Aβ1-40, Aβ1–40 + let-7a mimic, Aβ1–40 + miR-NC and Aβ1–40 + let-7a mimic + IGF-1.
Statistical analysis
Data are expressed as the mean ± standard deviation. Differences among groups were evaluated by one-way analysis of variance followed by Bonferroni's multiple comparison test using GraphPad Prism 5 software (GraphPad Software, Inc., La Jolla, CA, USA). P<0.05 was considered to indicate a statistically significant difference.
Results
Expression of let-7a in PC12 and SK-N-SH cells
To investigate the role of let-7a in Aβ1-40-treated PC12 and SK-N-SH cells, the let-7a mimic was transfected into PC12 and SK-N-SH cells. The levels of let-7a in PC12 and SK-N-SH cells were subsequently detected by RT-qPCR. As shown in Fig. 1, in both cell types, the level of let-7a in the Aβ1–40 + let-7a mimic group was significantly higher compared with the Aβ1–40 group (P<0.001).
Figure 1.
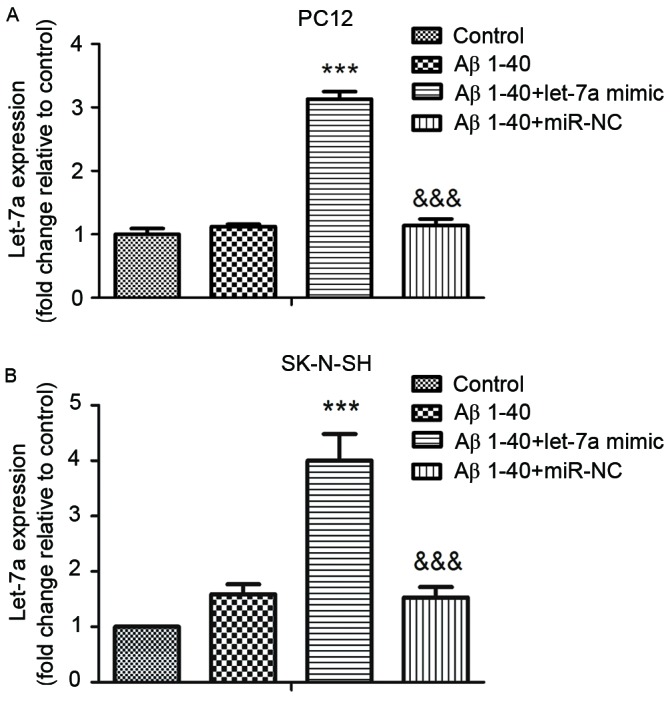
Effect of let-7a mimic transfection on let-7a expression in Aβ1-40-treated (A) PC12 and (B) SK-N-SH cells. The levels of let-7a were assessed by reverse transcription-quantitative polymerase chain reaction. Data are presented as the mean ± standard deviation (n=3). ***P<0.001 vs. Aβ1–40 group; &&&P<0.001 vs. Aβ1–40 + let-7a mimic group. Aβ, β-amyloid; miR-NC, negative control microRNA.
Effect of let-7a on cell viability in Aβ1-40-treated PC12 and SK-N-SH cells
After transfection for 24 h, cell viability was assessed by MTT assay. As shown in Fig. 2, Aβ1–40 treatment resulted in a significant decrease in cell viability compared with the control group in both cell lines (P<0.001). Furthermore, overexpression of let-7a significantly decreased the cell viability in PC12 and SK-N-SH cells compared with the Aβ1–40 group (P<0.05 and P<0.01, respectively).
Figure 2.
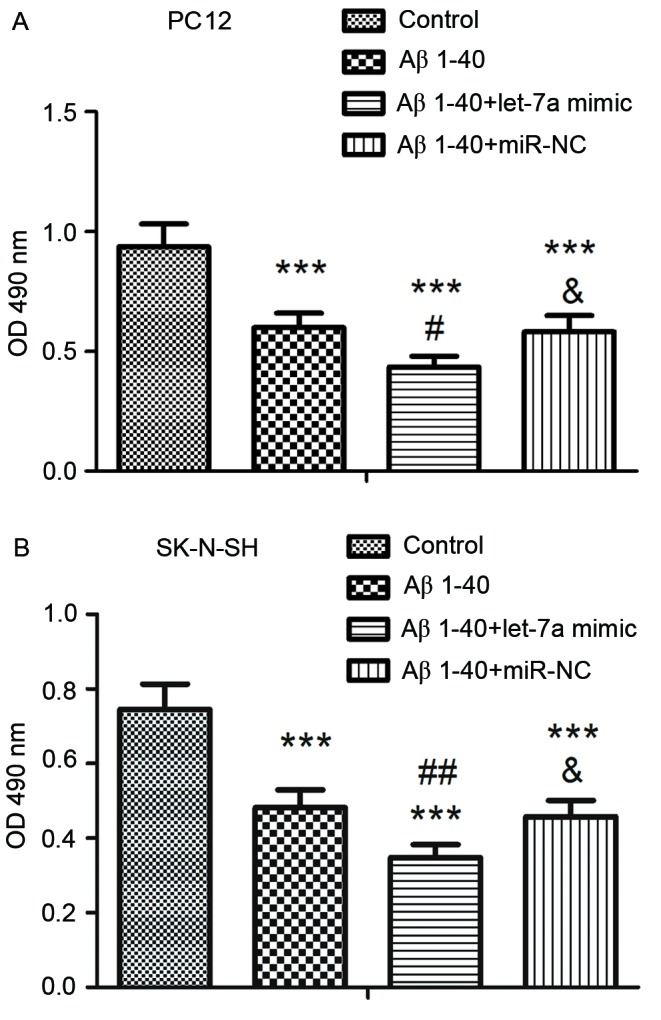
Effect of let-7a overexpression on cell viability in Aβ1-40-treated (A) PC12 and (B) SK-N-SH cells. Cell viability was determined by MTT assay. Data are presented as the mean ± standard deviation (n=5). ***P<0.001 vs. control group; #P<0.05, ##P<0.01 vs. Aβ1–40 group; &P<0.05 vs. Aβ1–40 + let-7a mimic group. Aβ, β-amyloid; miR-NC, negative control microRNA; OD, optical density.
Effect of let-7a on apoptosis in Aβ1-40-treated PC12 and SK-N-SH cells
The effect of let-7a on Aβ1-40-induced apoptosis in PC12 and SK-N-SH cells was determined by Annexin V-FITC/PI staining. As shown in Fig. 3A and B, after transfection for 24 h the percentage of apoptosis induced by Aβ1–40 was significantly increased by overexpression of let-7a in the two cell lines, compared with controls (P<0.001). Furthermore, the morphological changes of apoptotic nuclei were assessed by Hoechst 33342 staining and are presented in Fig. 3C. There were more condensed or fragmented apoptotic nuclei in the Aβ1–40 group in PC12 and SK-N-SH cells compared with the control, and let-7a overexpression markedly increased this phenomenon compared with the Aβ1–40 group.
Figure 3.

Overexpression of let-7a promoted the apoptosis of Aβ1-40-treated PC12 and SK-N-SH cells. Annexin-V/PI staining by flow cytometry was used to determine the apoptosis rate of (A) PC12 and (B) SK-N-SH cells. The percentages of apoptotic cells in the UR and LR quadrants are presented in the column charts. (C) Morphological changes of the nuclei in PC12 and SK-N-SH cells were assessed by Hoechst 33342 staining and representative images are shown (magnification, ×400). Data are presented as the mean ± standard deviation (n=3). *P<0.05, **P<0.01, ***P<0.001 vs. control group; ###P<0.001 vs. Aβ1–40 group; &&P<0.01, &&&P<0.001 vs. Aβ1–40 + let-7a mimic group. UR, upper right; LR, lower right; Aβ, β-amyloid; miR-NC, negative control microRNA.
Effect of let-7a on autophagy in Aβ1-40-treated PC12 and SK-N-SH cells
To elucidate the role of let-7a in the regulation of autophagy, the expression of LC3 among different groups of PC12 cells was determined by immunofluorescence staining. As shown in Fig. 4A, Aβ1–40 induced a marked increase in LC3 expression compared with control, and let-7a overexpression further increased LC3 expression induced by Aβ1–40 treatment. Furthermore, the levels of LC3 I, LC3 II, beclin-1 and p62 were assessed by western blotting (Fig. 4B-E). The ratio of LC3 II/I and the levels of beclin-1 and p62 were significantly upregulated by Aβ1–40 treatment in PC12 cells compared with the control (all P<0.05). These results were further increased by let-7a overexpression in PC12 cells (P<0.05, P<0.05 and P<0.001, respectively). Likewise, in SK-N-SH cells the ratio of LC3 II/I induced by Aβ1–40 was significantly upregulated by let-7a overexpression (Fig. 4F and G; P<0.01).
Figure 4.

Effect of let-7a overexpression on LC3, beclin-1 and p62 protein expression in Aβ1-40-treated PC12 and SK-H-SN cells. (A) Expression of LC3 in PC12 cells was evaluated by immunofluorescence staining. (B) Protein levels of LC3 I, LC3 II, beclin-1 and p62 in PC12 cells were assessed by western blot analysis. β-actin was used as a loading control. (C-E) Densitometric analysis of each protein band. (F) Protein levels of LC3 I and LC3 II in SK-H-SN cells were assessed by western blot analysis. β-actin was used as a loading control. (G) Densitometric analysis of each protein band. Data are presented as the mean ± standard deviation (n=3). *P<0.05, ***P<0.001 vs. control group; #P<0.05, ##P<0.01, ###P<0.001 vs. Aβ1–40 group; &P<0.05, &&P<0.01, &&&P<0.001 vs. Aβ1–40 + let-7a mimic group. Aβ, β-amyloid; miR-NC, negative control microRNA; LC3, microtubule-associated protein 1A/1B-light chain 3.
As shown in Fig. 5A-C, the mRNA expression levels of beclin-1, Atg-5 and Atg-7 were determined by RT-qPCR. The results indicated that the expression levels of beclin-1, Atg-5 and Atg-7 in Aβ1-40-treated PC12 cells were increased significantly compared with the control group (all P<0.001). Overexpression of let-7a led to higher levels of beclin-1, Atg-5 and Atg-7 expression compared with the Aβ1–40 group (P<0.001 for all). Furthermore, treatment with autophagy inhibitor 3-MA was able to restrain the morphological changes of apoptotic nuclei aggravated by let-7a overexpression in the context of Aβ1-40-treated PC12 cells (Fig. 5D). The apoptosis rate increased by let-7a overexpression was also significantly inhibited by 3-MA in Aβ1-40-treated PC12 cells (Fig. 5E; P<0.001). The results indicated that let-7a overexpression aggravated Aβ1-40-induced apoptosis, at least in part, via activating autophagy.
Figure 5.

Effect of let-7a overexpression on beclin-1, Atg-5 and Atg-7 mRNA expression in Aβ1-40-treated PC12 cells. (A-C) mRNA expression of beclin-1, Atg-5 and Atg-7 in PC12 cells was assessed by reverse transcription-quantitative polymerase chain reaction. (D) Representative pictures of the morphological changes of nuclei in PC12 cells stained by Hoechst 33342 (magnification, ×400). (E) Annexin-V/PI staining by flow cytometry was used to determine the apoptosis rate of PC12 cells. The percentages of apoptotic cells in the UR & LR quadrants are presented in the column charts. Data are presented as the mean ± standard deviation (n=3). ***P<0.001 vs. control group; ###P<0.001 vs. Aβ1–40 group; &&&P<0.001 vs. Aβ1–40 + let-7a mimic group; $P<0.05, $$$P<0.001 as indicated. UR, upper right; LR, lower right; Aβ, β-amyloid; miR-NC, negative control microRNA; Atg, autophagy protein; 3-MA, 3-methyladenine.
Effect of let-7a on the PI3K/Akt/mTOR signaling pathway
As the activation of PI3K/AKT/mTOR pathway has been reported to block autophagy (22), the role of let-7a in the regulation of PI3K/AKT/mTOR pathway was investigated in the current study in PC12 cells. The results of western blot analysis (Fig. 6) indicated significant decreases in the levels of PI3K, p-Akt and p-mTOR in the Aβ1–40 treatment group compared with the control group (all P<0.01), which were further decreased by let-7a overexpression (all P<0.05). Furthermore, the PI3K/AKT pathway was activated by treatment with IGF-1 and the changes in apoptosis and autophagy were evaluated in PC12 cells. As shown in Fig. 7A-C, the levels of PI3K and p-AKT were significantly upregulated by IGF-1 compared with the let-7a overexpression group (P<0.001 and P<0.05, respectively). The increased apoptosis rate induced by let-7a overexpression was restrained by IGF-1 in Aβ1-40-treated PC12 cells (P<0.001; Fig. 7D and E). The morphological changes of apoptotic nuclei aggravated by let-7a overexpression were alleviated by IGF-1 in Aβ1-40-treated PC12 cells (Fig. 7F). Furthermore, the ratio of LC3 II/I promoted by let-7a overexpression was significantly reduced by IGF-1 in Aβ1-40-treated PC12 cells (P<0.01; Fig. 7G and H). These results suggested that inhibition of the PI3K/Akt/mTOR signaling pathway is involved in the regulation of autophagy by let-7a overexpression, which strengthens Aβ1-40-induced neurotoxicity.
Figure 6.

Effect of let-7a overexpression on the PI3K/Akt/mTOR signaling pathway. (A) The protein levels of PI3K, p-Akt, Akt, p-mTOR and mTOR were detected by western blot analysis. β-actin was used as a loading control. (B-D) Densitometric analysis of each protein band. Data are presented as the mean ± standard deviation (n=3). **P<0.01, ***P<0.001 vs. control group; #P<0.05 vs. Aβ1–40 group; &P<0.05, &&P<0.01 vs. Aβ1–40 + let-7a mimic group. Aβ, β-amyloid; miR-NC, negative control microRNA; PI3K, phosphoinositide-3-kinase; p-, phosphorylated; mTOR, mammalian target of rapamycin.
Figure 7.

Effect of PI3K/Akt pathway activation on apoptosis and autophagy. (A) The protein levels of PI3K, p-Akt and Akt in PC12 cells were detected by western blot analysis. β-actin was used as a loading control. (B and C) Densitometric analysis of each protein band. (D) The apoptosis rate in PC12 cells was determined by flow cytometry. (E) The percentages of apoptosis cells in the UR & LR quadrants are presented in the column charts. (F) Representative images of the morphological changes of nuclei in PC12 cells stained by Hoechst 33342 (magnification, ×400). (G) Protein levels of LC3 I and LC3 II were detected by western blot analysis. β-actin was used as a loading control. (H) Densitometric analysis of each protein band. Data are presented as the mean ± standard deviation (n=3). *P<0.05, **P<0.01, ***P<0.001 as indicated. UR, upper right; LR, lower right; Aβ, β-amyloid; miR-NC, negative control microRNA; LC3, microtubule-associated protein 1A/1B-light chain 3; PI3K, phosphoinositide-3-kinase; IGF-1, insulin-like growth factor 1.
Discussion
The current study provides new insight into the effect of let-7a on autophagy in AD models in vitro. Aβ1-40-induced PC12 and SK-N-SH cells were used as the in vitro AD models in the present study, which have been adopted as models of neurotoxicity in previous research (23,24). In the present study, it was demonstrated that overexpression of let-7a promoted impaired autophagy and exacerbated neurotoxicity in Aβ1-40-induced PC12 and SK-N-SH cells.
The excessive accumulation of Aβ may result in senile plaque formation, which is considered to be the characteristic pathology change of AD (25). Increasing evidence has suggested that the abnormal accumulation of Aβ may induce marked cytotoxicity in neurons and is a key pathogenic factor of AD (26–28). In the present study, an Aβ peptide, Aβ1-40, was used to investigate the mechanism of Aβ neurotoxicity. According to the results, Aβ1-40-treated cells exhibited a notable decrease in cell viability and a higher apoptosis rate compared with the control group, which was consistent with previous studies (23,24). Furthermore, overexpression of let-7a was able to further decrease cell viability and enhance the level of apoptosis compared with the Aβ1–40 treatment group. The above results suggested that overexpression of let-7a enhanced Aβ1-40-induced neurotoxicity in vitro.
The role of autophagy in AD is complicated and may be regarded as a double-edged sword. On the one hand, autophagy has been reported to result in Aβ production, and inhibition of autophagy could reduce the accumulation of Aβ (29). For example, galanthamine, the drug typically used for treating AD, has been identified to have the potential to inhibit autophagy (30). Conversely, the activation of autophagy was indicated to improve cognitive function and decrease senile plaque production in a mouse model of AD (31). Currently, the leading view is that in the early stage of AD, autophagy is beneficial in clearing Aβ accumulation. With the progress of AD, autophagic-lysosomal pathway dysfunction results in the accumulation of immature AVs, which promotes Aβ production (32). LC3 is recognized as a specific marker for autophagy. LC3-I and LC3-II are two key subtypes of LC3 and the conversion of LC3-I to LC3-II indicates autophagy activation (33). Beclin-1 is an autophagy regulatory protein and is able to control the onset of autophagy (34). The level of beclin-1 has previously been demonstrated to be increased in NG108-15 neural cells of Aβ 25–35-treated mice (35). The present data indicated that autophagy was activated by Aβ1–40 treatment via promoting the conversion of LC3-I to LC3-II and increasing the level of beclin-1, which was enhanced by overexpression of let-7a. Atg-5 and Atg-7 serve a function in the membrane-expansion process in autophagosome formation, and overexpression of Atg-5 and Atg-7 may facilitate the activation of autophagy (36). The present results were consistent with this and indicated that let-7a overexpression further promoted the increased levels of Atg-5 and Atg-7 induced by Aβ1-40. However, the above results only reflected the upstream processes of autophagy. The level of p62 protein is inversely proportional to the downstream processes of autophagy activation. An increased level of p62 indicates suppression of the autophagy-lysosomal pathway, which leads to impaired autophagy (37,38). If autophagic-lysosomal dysfunction occurs, a large number of AVs may be accumulated, contributing to the course of AD (39). In the present study, the level of p62 was increased in Aβ1-40-treated PC12 cells compared with the control, and was further upregulated by let-7a overexpression, indicating that let-7a overexpression aggravated the autophagic-lysosomal dysfunction. Furthermore, inhibition of autophagy by 3-MA significantly suppressed the apoptosis induced by let-7a overexpression. The above results suggested that autophagy regulation was associated with Aβ1-40-induced neurotoxicity in vitro and overexpression of let-7a exacerbated neurotoxicity via inducing impaired autophagy.
Autophagy is regulated by various signaling pathways. The mTOR kinase pathway is a key regulator of autophagy, which is controlled by its upstream PI3K/Akt pathway (40). mTOR has a negative feedback effect on autophagy and inhibition of the PI3K/Akt/mTOR pathway can activate autophagy (41,42). In the present study, it was demonstrated that the levels of PI3K, p-Akt and p-mTOR were downregulated by Aβ1–40 treatment compared with the control. Furthermore, let-7a overexpression was able to further decrease the expression levels of these proteins compared with the Aβ1–40 treatment group. Activation of the PI3K/Akt pathway by IGF-1 also inhibited the autophagy and apoptosis induced by let-7a overexpression in Aβ1-40-treated PC12 cells. The above results suggested that let-7a overexpression promotes impaired autophagy induced by Aβ1–40 via inhibition of the PI3K/Akt/mTOR signaling pathway in vitro.
In conclusion, the present study demonstrated that Aβ1–40 could induce neurotoxicity in PC12 and SK-N-SH cells. Furthermore, let-7a overexpression was indicated to increase the neurotoxic effects of Aβ1–40 by inducing impaired autophagy. In addition, the PI3K/Akt/mTOR signaling pathway was demonstrated to be associated with the autophagy regulation of let-7a. Although the related mechanisms require further investigation, the present results suggest that let-7a may serve as a promising tool for the study of AD.
References
- 1.Choi SH, Kim YH, Hebisch M, Sliwinski C, Lee S, D'Avanzo C, Chen H, Hooli B, Asselin C, Muffat J, et al. A three-dimensional human neural cell culture model of Alzheimer's disease. Nature. 2014;515:274–278. doi: 10.1038/nature13800. [DOI] [PMC free article] [PubMed] [Google Scholar]
- 2.Hebert LE, Weuve J, Scherr PA, Evans DA. Alzheimer disease in the United States (2010–2050) estimated using the 2010 census. Neurology. 2013;80:1778–1783. doi: 10.1212/WNL.0b013e31828726f5. [DOI] [PMC free article] [PubMed] [Google Scholar]
- 3.Keogh-Brown MR, Jensen HT, Arrighi HM, Smith RD. The impact of Alzheimer's disease on the Chinese economy. EBioMedicine. 2015;4:184–190. doi: 10.1016/j.ebiom.2015.12.019. [DOI] [PMC free article] [PubMed] [Google Scholar]
- 4.Saiz-Sanchez D, De la Rosa-Prieto C, Ubeda-Banon I, Martinez-Marcos A. Interneurons, tau and amyloid-β in the piriform cortex in Alzheimer's disease. Brain Struct Funct. 2015;220:2011–2025. doi: 10.1007/s00429-014-0771-3. [DOI] [PubMed] [Google Scholar]
- 5.Pamphlett R, Jew Kum S. Different populations of human locus ceruleus neurons contain heavy metals or hyperphosphorylated tau: Implications for amyloid-β and tau pathology in Alzheimer's disease. J Alzheimers Dis. 2015;45:437–447. doi: 10.3233/JAD-142445. [DOI] [PubMed] [Google Scholar]
- 6.Tung YT, Wang BJ, Hu MK, Hsu WM, Lee H, Huang WP, Liao YF. Autophagy: A double-edged sword in Alzheimer's disease. J Biosci. 2012;37:157–165. doi: 10.1007/s12038-011-9176-0. [DOI] [PubMed] [Google Scholar]
- 7.Dai R, Zhang S, Duan W, Wei R, Chen H, Cai W, Yang L, Wang Q. Enhanced autophagy contributes to protective effects of GM1 ganglioside against Aβ1-42-induced neurotoxicity and cognitive deficits. Neurochem Res. 2017 May 12; doi: 10.1007/s11064-017-2266-0. (Epub ahead of print) [DOI] [PubMed] [Google Scholar]
- 8.Singh AK, Bissoyi A, Kashyap MP, Patra PK, Rizvi SI. Autophagy activation alleviates amyloid-β-induced oxidative stress, apoptosis and neurotoxicity in human neuroblastoma SH-SY5Y cells. Neurotox Res. 2017 May 8; doi: 10.1007/s12640-017-9746-5. (Epub ahead of print) [DOI] [PubMed] [Google Scholar]
- 9.Fan Y, Wang N, Rocchi A, Zhang W, Vassar R, Zhou Y, He C. Identification of natural products with neuronal and metabolic benefits through autophagy induction. Autophagy. 2017;13:41–56. doi: 10.1080/15548627.2016.1240855. [DOI] [PMC free article] [PubMed] [Google Scholar]
- 10.Bordi M, Berg MJ, Mohan PS, Peterhoff CM, Alldred MJ, Che S, Ginsberg SD, Nixon RA. Autophagy flux in CA1 neurons of Alzheimer hippocampus: Increased induction overburdens failing lysosomes to propel neuritic dystrophy. Autophagy. 2016;12:2467–2483. doi: 10.1080/15548627.2016.1239003. [DOI] [PMC free article] [PubMed] [Google Scholar]
- 11.Yu WH, Kumar A, Peterhoff C, Kulnane Shapiro L, Uchiyama Y, Lamb BT, Cuervo AM, Nixon RA. Autophagic vacuoles are enriched in amyloid precursor protein-secretase activities: Implications for beta-amyloid peptide over-production and localization in Alzheimer's disease. Int J Biochem Cell Biol. 2004;36:2531–2540. doi: 10.1016/j.biocel.2004.05.010. [DOI] [PubMed] [Google Scholar]
- 12.Nixon RA, Wegiel J, Kumar A, Yu WH, Peterhoff C, Cataldo A, Cuervo AM. Extensive involvement of autophagy in Alzheimer disease: An immuno-electron microscopy study. J Neuropathol Exp Neurol. 2005;64:113–122. doi: 10.1093/jnen/64.2.113. [DOI] [PubMed] [Google Scholar]
- 13.Rubinsztein DC, DiFiglia M, Heintz N, Nixon RA, Qin ZH, Ravikumar B, Stefanis L, Tolkovsky A. Autophagy and its possible roles in nervous system diseases, damage and repair. Autophagy. 2005;1:11–22. doi: 10.4161/auto.1.1.1513. [DOI] [PubMed] [Google Scholar]
- 14.Yang DS, Stavrides P, Mohan PS, Kaushik S, Kumar A, Ohno M, Schmidt SD, Wesson DW, Bandyopadhyay U, Jiang Y, et al. Therapeutic effects of remediating autophagy failure in a mouse model of Alzheimer disease by enhancing lysosomal proteolysis. Autophagy. 2011;7:788–789. doi: 10.4161/auto.7.7.15596. [DOI] [PMC free article] [PubMed] [Google Scholar]
- 15.Cho SJ, Yun SM, Jo C, Lee DH, Choi KJ, Song JC, Park SI, Kim YJ, Koh YH. SUMO1 promotes Aβ production via the modulation of autophagy. Autophagy. 2015;11:100–112. doi: 10.4161/15548627.2014.984283. [DOI] [PMC free article] [PubMed] [Google Scholar]
- 16.Lee H, Han S, Kwon CS, Lee D. Biogenesis and regulation of the let-7 miRNAs and their functional implications. Protein Cell. 2016;7:100–113. doi: 10.1007/s13238-015-0212-y. [DOI] [PMC free article] [PubMed] [Google Scholar]
- 17.Thornton JE, Gregory RI. How does Lin28 let-7 control development and disease? Trends Cell Biol. 2012;22:474–482. doi: 10.1016/j.tcb.2012.06.001. [DOI] [PMC free article] [PubMed] [Google Scholar]
- 18.Dubinsky AN, Dastidar SG, Hsu CL, Zahra R, Djakovic SN, Duarte S, Esau CC, Spencer B, Ashe TD, Fischer KM, et al. Let-7 coordinately suppresses components of the amino acid sensing pathway to repress mTORC1 and induce autophagy. Cell Metab. 2014;20:626–638. doi: 10.1016/j.cmet.2014.09.001. [DOI] [PMC free article] [PubMed] [Google Scholar]
- 19.Liu QY, Chang MN, Lei JX, Koukiekolo R, Smith B, Zhang D, Ghribi O. Identification of microRNAs involved in Alzheimer's progression using a rabbit model of the disease. Am J Neurodegener Dis. 2014;3:33–44. [PMC free article] [PubMed] [Google Scholar]
- 20.Kumar P, Dezso Z, MacKenzie C, Oestreicher J, Agoulnik S, Byrne M, Bernier F, Yanagimachi M, Aoshima K, Oda Y. Circulating miRNA biomarkers for Alzheimer's disease. PLoS One. 2013;8:e69807. doi: 10.1371/journal.pone.0069807. [DOI] [PMC free article] [PubMed] [Google Scholar]
- 21.Livak KJ, Schmittgen TD. Analysis of relative gene expression data using real-time quantitative PCR and the 2(−Delta Delta C(T)) method. Methods. 2001;25:402–408. doi: 10.1006/meth.2001.1262. [DOI] [PubMed] [Google Scholar]
- 22.Li TT, Zhu D, Mou T, Guo Z, Pu JL, Chen QS, Wei XF, Wu ZJ. IL-37 induces autophagy in hepatocellular carcinoma cells by inhibiting the PI3K/AKT/mTOR pathway. Mol Immunol. 2017;87:132–140. doi: 10.1016/j.molimm.2017.04.010. [DOI] [PubMed] [Google Scholar]
- 23.Muñoz FJ, Inestrosa NC. Neurotoxicity of acetylcholinesterase amyloid beta-peptide aggregates is dependent on the type of Abeta peptide and the AChE concentration present in the complexes. FEBS Lett. 1999;450:205–209. doi: 10.1016/S0014-5793(99)00468-8. [DOI] [PubMed] [Google Scholar]
- 24.Tomiyama T, Shoji A, Kataoka K, Suwa Y, Asano S, Kaneko H, Endo N. Inhibition of amyloid beta protein aggregation and neurotoxicity by rifampicin. Its possible function as a hydroxyl radical scavenger. J Biol Chem. 1996;271:6839–6844. doi: 10.1074/jbc.271.12.6839. [DOI] [PubMed] [Google Scholar]
- 25.Takahashi RH, Nagao T, Gouras GK. Plaque formation and the intraneuronal accumulation of β-amyloid in Alzheimer's disease. Pathol Int. 2017;67:185–193. doi: 10.1111/pin.12520. [DOI] [PubMed] [Google Scholar]
- 26.Kong Y, Li K, Fu T, Wan C, Zhang D, Song H, Zhang Y, Liu N, Gan Z, Yuan L. Quercetin ameliorates Aβ toxicity in Drosophila AD model by modulating cell cycle-related protein expression. Oncotarget. 2016;7:67716–67731. doi: 10.18632/oncotarget.11963. [DOI] [PMC free article] [PubMed] [Google Scholar]
- 27.Rajmohan R, Reddy PH. Amyloid-beta and phosphorylated tau accumulations cause abnormalities at synapses of Alzheimer's disease neurons. J Alzheimers Dis. 2017;57:975–999. doi: 10.3233/JAD-160612. [DOI] [PMC free article] [PubMed] [Google Scholar]
- 28.Gupta VK, Chitranshi N, Gupta VB, Golzan M, Dheer Y, Wall RV, Georgevsky D, King AE, Vickers JC, Chung R, Graham S. Amyloid beta accumulation and inner retinal degenerative changes in Alzheimer's disease transgenic mouse. Neurosci Lett. 2016;623:52–56. doi: 10.1016/j.neulet.2016.04.059. [DOI] [PubMed] [Google Scholar]
- 29.Nixon RA. Autophagy, amyloidogenesis and Alzheimer disease. J Cell Sci. 2007;120:4081–4091. doi: 10.1242/jcs.019265. [DOI] [PubMed] [Google Scholar]
- 30.Lipinski MM, Zheng B, Lu T, Yan Z, Py BF, Ng A, Xavier RJ, Li C, Yankner BA, Scherzer CR, Yuan J. Genome-wide analysis reveals mechanisms modulating autophagy in normal brain aging and in Alzheimer's disease. Proc Natl Acad Sci USA. 2010;107:14164–14169. doi: 10.1073/pnas.1009485107. [DOI] [PMC free article] [PubMed] [Google Scholar]
- 31.Spilman P, Podlutskaya N, Hart MJ, Debnath J, Gorostiza O, Bredesen D, Richardson A, Strong R, Galvan V. Inhibition of mTOR by rapamycin abolishes cognitive deficits and reduces amyloid-beta levels in a mouse model of Alzheimer's disease. PLoS One. 2010;5:e9979. doi: 10.1371/journal.pone.0009979. [DOI] [PMC free article] [PubMed] [Google Scholar]
- 32.Kiriyama Y, Nochi H. The function of autophagy in neurodegenerative diseases. Int J Mol Sci. 2015;16:26797–26812. doi: 10.3390/ijms161125990. [DOI] [PMC free article] [PubMed] [Google Scholar]
- 33.Kabeya Y, Mizushima N, Ueno T, Yamamoto A, Kirisako T, Noda T, Kominami E, Ohsumi Y, Yoshimori T. LC3, a mammalian homologue of yeast Apg8p, is localized in autophagosome membranes after processing. EMBO J. 2000;19:5720–5728. doi: 10.1093/emboj/19.21.5720. [DOI] [PMC free article] [PubMed] [Google Scholar]
- 34.Salminen A, Kaarniranta K, Kauppinen A, Ojala J, Haapasalo A, Soininen H, Hiltunen M. Impaired autophagy and APP processing in Alzheimer's disease: The potential role of Beclin 1 interactome. Prog Neurobiol. 2013;106–107:33–54. doi: 10.1016/j.pneurobio.2013.06.002. [DOI] [PubMed] [Google Scholar]
- 35.Du B, Zhang Z, Li N. Madecassoside prevents Aβ(25–35)-induced inflammatory responses and autophagy in neuronal cells through the class III PI3K/Beclin-1/Bcl-2 pathway. Int Immunopharmacol. 2014;20:221–228. doi: 10.1016/j.intimp.2014.02.036. [DOI] [PubMed] [Google Scholar]
- 36.Song F, Kou R, Zou C, Gao Y, Zeng T, Xie K. Involvement of autophagy in tri-ortho-cresyl phosphate- induced delayed neuropathy in hens. Neurochem Int. 2014;64:1–8. doi: 10.1016/j.neuint.2013.10.017. [DOI] [PubMed] [Google Scholar]
- 37.Komatsu M, Waguri S, Koike M, Sou YS, Ueno T, Hara T, Mizushima N, Iwata J, Ezaki J, Murata S, et al. Homeostatic levels of p62 control cytoplasmic inclusion body formation in autophagy-deficient mice. Cell. 2007;131:1149–1163. doi: 10.1016/j.cell.2007.10.035. [DOI] [PubMed] [Google Scholar]
- 38.Waguri S, Komatsu M. Biochemical and morphological detection of inclusion bodies in autophagy-deficient mice. Methods Enzymol. 2009;453:181–196. doi: 10.1016/S0076-6879(08)04009-3. [DOI] [PubMed] [Google Scholar]
- 39.Ihara Y, Morishima-Kawashima M, Nixon R. The ubiquitin-proteasome system and the autophagic-lysosomal system in Alzheimer disease. Cold Spring Harb Perspect Med. 2012;2 doi: 10.1101/cshperspect.a006361. pii: a006361. [DOI] [PMC free article] [PubMed] [Google Scholar]
- 40.Petiot A, Ogier-Denis E, Blommaart EF, Meijer AJ, Codogno P. Distinct classes of phosphatidylinositol 3′-kinases are involved in signaling pathways that control macroautophagy in HT-29 cells. J Biol Chem. 2000;275:992–998. doi: 10.1074/jbc.275.2.992. [DOI] [PubMed] [Google Scholar]
- 41.Wang P, Guo QS, Wang ZW, Qian HX. HBx induces HepG-2 cells autophagy through PI3K/Akt-mTOR pathway. Mol Cell Biochem. 2013;372:161–168. doi: 10.1007/s11010-012-1457-x. [DOI] [PubMed] [Google Scholar]
- 42.Liu J, Hu XJ, Jin B, Qu XJ, Hou KZ, Liu YP. β-Elemene induces apoptosis as well as protective autophagy in human non-small-cell lung cancer A549 cells. J Pharm Pharmacol. 2012;64:146–153. doi: 10.1111/j.2042-7158.2011.01371.x. [DOI] [PubMed] [Google Scholar]