

SUMMARY
The systematic sequencing of the cancer genome has led to the identification of numerous genetic alterations in cancer. However, a deeper understanding of the functional consequences of these alterations is necessary to guide appropriate therapeutic strategies. Here, we describe Onco-GPS (OncoGenic Positioning System), a data-driven analysis framework to organize individual tumor samples with shared oncogenic alterations onto a reference map defined by their underlying cellular states. We applied the methodology to the RAS pathway and identified nine distinct components that reflect transcriptional activities downstream of RAS and defined several functional states associated with patterns of transcriptional component activation that associates with genomic hallmarks and response to genetic and pharmacological perturbations. These results show that the Onco-GPS is an effective approach to explore the complex landscape of oncogenic cellular states across cancers, and an analytic framework to summarize knowledge, establish relationships, and generate more effective disease models for research or as part of individualized precision medicine paradigms.
In Brief
Assessing the functional consequences of oncogene activation is critical for subsequently characterizing disease in a patient and devising effective therapeutic strategies. We describe Onco-GPS, a data-driven analysis framework to summarize, visualize, and discover new associations that may guide therapeutic strategies involving existing or new targets as part of individualized precision medicine paradigms.
INTRODUCTION
An accurate molecular classification of cancers is essential to achieve effective disease management and intervention. The systematic sequencing of cancer genomes has provided a rich catalog of somatic genetic alterations, knowledge of which has begun to inform treatment options, especially in cases where the lesions can be directly targeted with available therapeutic agents, such as cancers with mutations in BRAF, EGFR, ALK, etc. (Lynch et al., 2004; Flaherty et al., 2010; Kwak et al., 2010). However, it is increasingly clear that mutational status alone is insufficient to unambiguously determine the oncogenic state of a given cancer sample and fully inform the appropriate therapeutic choice(s). This problem is relevant to the variability of response observed among highly selected groups of patient with so-called “actionable” mutations (Prahallad et al., 2012; Konieczkowski et al., 2014; Hyman et al., 2015). For example, a large clinical trial across a cohort of non-melanoma patients with BRAF mutant cancers showed highly variable responses to the selective BRAF inhibitor Vemurafenib (Hyman et al., 2015). These and other observations underscore the need for analytical methodologies that better delineate cellular states and help predict clinical responses to targeted agents.
Recent studies have shown that tumor heterogeneity may underlie variability in sensitivity to targeted agents (Singh et al., 2009; Prahallad et al., 2012; Konieczkowski et al., 2014; Zhu et al., 2014). For example, in BRAF mutant melanoma, reciprocal levels of the receptor tyrosine kinase (RTK) AXL and the transcription factor MITF correlate with sensitivity to BRAF inhibitors in a mutually exclusive manner (Konieczkowski et al., 2014). This cell-state dichotomy generalizes to the state of individual melanoma single cells in vivo, as recently reported (Tirosh et al., 2016). In cancers with mutations in KRAS, the epithelial-mesenchymal transition (EMT) program has been shown to underlie variability in response to genetic depletion of KRAS in some cells (Singh et al., 2009). While these findings suggest that transcriptional activities may underlie variability in cell responses to direct inhibition, knowing how this variability relates to the activity of the oncogene, and how to translate this information systematically into effective therapeutic strategies in a prospective manner, remains a challenge.
Experimental gene expression signatures derived from an activated oncogene have been used to predict its activation status across individual samples (Bild et al., 2006). Although this approach enables the identification of overall transcriptional changes driven by an oncogene, its effectiveness is limited by not knowing in advance the degree of heterogeneity of the transcriptional profiles due to the complex relationships between the activated oncogene and its multiple downstream effectors, as well as other cellular and genetic contexts that impinge on the fate of the final output. As such, an analytical methodology that embraces this complexity, e.g., by capturing the consequences of an activated driver oncogene and their corresponding multiple end states, will be valuable for further disease characterization and management.
Here, we introduce Onco-GPS (OncoGenic Positioning System), a data-driven analysis framework and associated experimental and computational methodology that makes uses of an oncogenic activation signature to identify multiple cellular states associated with oncogene activation, and apply it to explore cancers with altered RAS/MAPK signaling. The Onco-GPS method decomposes that signature into its constituent components in such a way that the context dependencies and different modalities of oncogenic activation are explicitly included. Once characterized and annotated, these components are used to deconstruct and define cellular states, and to map individual samples onto a novel visual paradigm: a two-dimensional Onco-GPS “map.” This resulting model facilitates further molecular characterization and provides an effective analysis and summarization tool that can be applied to explore complex oncogenic states.
RESULTS
Onco-GPS: Method Overview
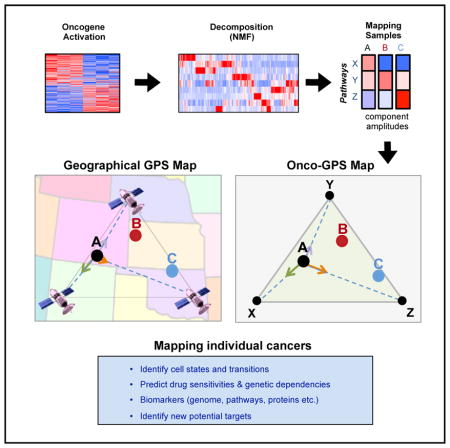
The Onco-GPS approach is executed in three modular steps shown in Figure 1. Step I involves the experimental generation of a representative gene expression signature reflecting the activation of an oncogene of interest (Figure 1, panel I). In step II, the resulting signature is decomposed into a set of coherent transcriptional components using a large reference dataset representing multiple cellular states relevant to the oncogene of interest (Figure 1, panel II). These components are also biologically annotated and characterized through further analysis and experimental validation. In step III, a representative subset of samples and components are selected to define cellular states using a clustering procedure. The selected components are also used as transcriptional coordinates to generate a two-dimensional map where the selected individual samples are projected relative to these transcriptional coordinates in analogy to a geographical GPS system (Figure 1, panel III) (Hofmann-Wellenhof et al., 2007). For example, the “ternary plot” Onco-GPS shown in Figure 1, panel III, makes use of three components to represent a defined population of cellular states and samples. More complex “global” Onco-GPS maps, can involve larger subsets of components if necessary (Figure S1; STAR Methods). Once an Onco-GPS map has been created, samples from independent test datasets can also be projected onto and displayed within the same Onco-GPS map, and their states predicted using a probabilistic classifier (STAR Methods). The Onco-GPS map can also be used to display the association of samples with various genomic features, such as genetic lesions, pathway activation, individual gene expression, genetic dependencies, and drug sensitivities. In the next sections, we will use the Onco-GPS approach to explore the complex functional landscape of cancer cell lines with alterations in the RAS/MAPK pathway. Details of the approach can be found in the STAR Methods.
Figure 1. Schematic Diagram of the Onco-GPS Analysis Framework and Methodology.

(I) Oncogenic activation signature is generated by experimentally expressing the oncogene of interest in an isogenic cell system. (II) The signature is decomposed using non-negative matrix factorization (NMF) using a reference dataset in order to generate transcriptional components. The components are optionally clustered or sub-selected to represent a specific sample population (e.g., KRAS mutants). (III) Cellular states are defined by clustering and an Onco-GPS map is generated. Samples are then projected onto the Onco-GPS map and further characterized by associating them to diverse genomic features.
Step I. Generate RAS/MAPK Oncogenic Signatures
To generate transcriptional signatures reflective of RAS/MAPK activation across multiple cellular contexts, we explored signature-based models that predict the oncogenic activation of BRAF and KRAS in a large panel of cancer cell lines representing multiple lineages. In Figure 2A, we show the profile of an isogenic signature of BRAF activation that we generated by introducing mutant BRAF V600E into immortalized human cells (see the STAR Methods for details) (Elenbaas et al., 2001; Lundberg et al., 2002; Garraway and Lander, 2013). This signature profile associated significantly with the mutational status of BRAF in cancer cell lines (Figure 2A), and allowed us to generate an accurate probabilistic model to infer the activation status of BRAF based on the expression (mRNA) of the genes in the signature (Figure 2B). When this model is compared against another signature that we generated by the overexpression of ETV1, a transcription factor known to be downstream of BRAF/MAPK, we found a significant overlap in both the number of samples that are predicted in the active state, and the number of overlapping genes in both signatures (Figure 2C). These observations suggest that the primary output of oncogenic BRAF involves transcriptional programs regulated by ETV1. In contrast, when we analyzed a KRAS activation signature generated by introducing an activating KRAS allele (G12V) in immortalized human lung cells, the corresponding profile only modestly aligned with the mutational status of KRAS (Figure 2D). If we compare the samples predicted to be active by this signature and three other independent KRAS signatures from the literature (Figure 2E), we observed greater differences and much less overlap than in the case of BRAF (Figure 2F). This transcriptional complexity, consistent with our current understanding that the activation of RAS operates in a non-linear fashion and engages multiple downstream effectors and programs (Chang et al., 2009), implies that there are important limitations to delineate oncogenic states using transcriptional signatures for oncogenes that display more complex, heterogeneous, and context-dependent behavior. This motivated us to develop a signature decomposition strategy (step II) to derive higher-resolution RAS activation profiles (see STAR Methods for details).
Figure 2. Analysis of Signature-Based Models that Predict the Oncogenic Activation of BRAF and KRAS.

(A) Profile of an isogenic signature of BRAF activation and BRAF mutation status in hundreds of cancer cell lines.
(B) Probabilistic model to infer the activation status of BRAF based on the mRNA values of the BRAF signature genes. Activation status of cell lines according to the BRAF model and an additional model based on an ETV1 isogenic signature.
(C) Overlap in the number of samples that are predicted in the active state, and the number of overlapping genes in both signatures.
(D) Analysis of signature-based models that predict the oncogenic activation of KRAS.
(E) Probabilistic model to infer the activation status of KRAS based on the mRNA values of the KRAS signature genes. Activation status of cell lines according to the KRAS model and three additional models based on three KRAS signature from the Molecular Signatures Database (MSigDB, STAR Methods).
(F) Overlap in the number of samples that are predicted in the active state, and the number of overlapping genes in the four KRAS signatures.
Step II. Decompose the KRAS Signature and Generate Transcriptional Components
We used the top 1,000 differentially expressed genes from the KRAS activation signature generated from RNA-sequencing profiles, and decomposed them into components using 750 samples from the Broad-Novartis Cancer Cell Line Encyclopedia (CCLE) (Barretina et al., 2012), corresponding to 25 lineages of solid tumors as a reference dataset. Restricting the decomposition process to the signature genes allowed us to emphasize the most relevant oncogene-driven transcriptional space and limit the effects of other transcriptional differences. The decomposition is based on a non-negative matrix factorization algorithm (Brunet et al., 2004; Tamayo et al., 2007), which decomposes the KRAS signature into nine distinct components (C1–C9) showing significant changes across the reference dataset (Figure 3) that were numerically stable (Figure S2D; STAR Methods). These transcriptional components, hereafter referred to as “components,” represent summaries of the most coherent gene expression patterns, relevant to the KRAS signature genes across the wide variety of cellular states and contexts represented in the reference dataset (Tables S1 and S2).
Figure 3. Generation of KRAS Components from the KRAS Signature.
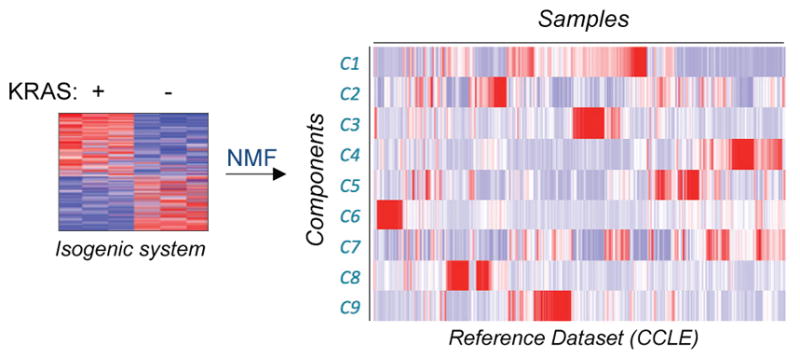
Schematic depiction of lung KRAS signature (left) being decomposed into W and H matrices (right, only H matrix shown).
Analyze and Annotate the Transcriptional Components
To characterize and annotate the KRAS components, we associated each component profile against several genomic data-sets including mutations and copy number alterations, protein and gene expression, pathway activity (Barretina et al., 2012), gene dependency (Cowley et al., 2014), and drug sensitivity (Cancer Therapeutics Response Portal [CTRP] dataset, CCLE pharmacological profiling dataset) (Seashore-Ludlow et al., 2015). To quantify the degree of association, we used the information coefficient (IC), an information-theoretic measure (Kim et al., 2016), and an empirical permutation test to assess the statistical significance of the top hits (STAR Methods).
KRAS Components Map to a KRAS “Core” and MAPK Pathways
The association analysis shows that one of the nine components (hereafter, C3) associates with KRAS mutation status, the top-matching feature out of 37,276 genomic alterations (IC = 0.424, p = 3.19 × 10⁻⁷, false discovery rate [FDR] = 1.06 × 10⁻⁷) (Figure 4A). Moreover, this association was stronger than any other KRAS signature, either from our prior studies or from the literature (step I). This observation suggests that the decomposition strategy extracted a “core” KRAS signal from the initial KRAS signature. Interestingly, in addition to KRAS mutation, C3 is also associated with both a KRAS dependency signature (IC = 0.603, p = 1.31 × 10⁻⁶, FDR = 2.87 × 10⁻⁵) (Molecular Signature Database; Singh et al., 2009) and a profile of KRAS RNAi dependency from Project Achilles (IC = −0.605, p = 1.19 ×10⁻⁶, FDR = 2.00 × 10⁻³) (Cheung et al., 2011; Cowley et al., 2014). These findings suggest that the transcriptional activity of KRAS represented by C3 may be relevant to the KRAS dependence phenotype. This observation may also explain why KRAS mutant cancers with low C3 scores, i.e., samples on the right side of the top heatmap in Figure 4A, may be less dependent on KRAS for their survival. We also found similar genomic associations in several independent tumor datasets including the pan-cancer12 (PanCan12) TCGA (The Cancer Genome Atlas) dataset (Figures 4B and S3) (Seo et al., 2012; Hoadley et al., 2014; Kirzin et al., 2014). Furthermore, we observed that both RNAi-mediated suppression of KRAS in HCT116, a KRAS mutant colorectal cancer cell line, as well as withdrawal of KRAS expression in a transgenic mouse model driven by inducible KRAS, significantly attenuated C3 scores, suggesting that C3 scores track with KRAS activity, both in vitro and in vivo (Figures 4C and 4D) (Ying et al., 2012; Shao et al., 2014). Moreover, rescue of KRAS expression had modest effect in C3, suggesting that this observation is specific for KRAS (Figure 4C). Taken together, these observations suggest that C3 represents a core KRAS transcriptional program that underlies the KRAS dependency phenotype.
Figure 4. Characterization of the KRAS Transcriptional Components C3 and C6 Against genomic features.

(A) selected KRAS features associated with component C3 in the CCLE and Achilles datasets; (B) selected KRAS features associated with component C3 in the TCGA PanCan12 dataset. Dot plot depicting changes in component C3 scores upon genetic suppression of KRAS (C) in vitro and (D) in vivo. (E) WNT features associated with component C3 in the CCLE and Achilles dataset and in (F) the PanCan12 TCGA dataset. (G) Selected features associated with component C6 in the CCLE and CTRP datasets. Dot plots depict changes in component C6 scores upon treatment with MEK inhibitor (H) in vitro and (I) in vivo.
We also observed that C3 was significantly associated with mutations in key components of the WNT pathway, namely β-catenin and APC (Chamorro et al., 2005), as well as dependency on β-catenin (Figures 4E and 4F), suggesting this component may also impinge on the WNT/β-catenin pathway (Singh et al., 2012).
Next, we analyzed whether other component profiles were also associated with other known alterations downstream of the RAS/MAPK pathway, a well-established downstream effector of KRAS where RAF is the key effector known to activate the pathway. In this case, BRAF mutation was the top hit associated with component C6 out of 37,276 genomic alterations (Figure 4G; IC = 0.422, p = 3.19 ×10⁻⁷, FDR = 7.35 ×10⁻⁵). We also independently generated a BRAF V600E activation signature (Figure 2A; STAR Methods) and compared its enrichment profile against component C6 and observed a significant association (IC = 0.639, p = 2.62 × 10⁻⁶, FDR = 1.50 × 10⁻⁵). We also observed a significant association of C6 with a signature of ETV1 activation (IC = 0.694, p = 2.62 × 10⁻⁶, FDR = 1.5 × 10⁻⁵, respectively) (Figures 2B and 4G). ETV1 is a well-established transcription factor, downstream of the MAPK pathway, and further suggests that C6 reflects a transcriptional program associated with MAPK activation.
We also assessed if the C6 profile predicted sensitivity to MAPK pathway inhibition. Indeed, we observed a significant association between C6 profiles with sensitivities to known clinical inhibitors of the MAPK pathway, including PLX4720 (Figure 4G; IC = −0.622, 4.16 ×10⁻⁵, FDR = 1.00 × 10⁻²). Finally, using previously published datasets (Pratilas et al., 2009; Prahallad et al., 2012), we tested if inhibition of the BRAF/MAPK pathway could be detected by C6, and found that C6 enrichment scores were significantly attenuated by MEK inhibitors in BRAF V600E melanomas, both in vitro and in vivo (Figures 4H and 4I). As BRAF/MAPK is a well-established effector pathway downstream of KRAS, these observations provide evidence that the unbiased Onco-GPS strategy can effectively extract and identify known transcriptional events downstream of KRAS.
Additional KRAS Components Map to NF-κB, MYC/E2F, ZEB1/EMT, and HNF1/PAX8 Pathways
We further assessed which transcriptional regulators were associated with the remaining KRAS components. We found that C7 was significantly associated with features representing nuclear factor κB (NF-κB), a well-established pathway downstream of KRAS (Zhu et al. 2014). These included: (1) a gene set representing the NF-κB motif (Figure 5A) (IC = 0.573, p = 2.31 × 10⁻⁵, FDR = 1.64 × 10⁻³), (2) an independent gene set representing p50/p65 (IC = 0.682, p = 2.62 × 10⁻⁶, FDR = 5.66 × 10⁻⁸), and (3) a profile of NF-κB protein expression (IC = 0.398, p = 8.66 ×10⁻⁵, FDR = 8.33 × 10⁻⁴) (Hopewell et al., 2013). Furthermore, we observed corresponding changes in C7 scores upon introduction of a known activator or repressor of the NF-κB pathway, consistent with C7 representing activity of the NF-κB pathway (Figure 5B).
Figure 5. Characterization of the KRAS Transcriptional Components C2, C4, and C7 against Key Molecular Features.

(A) Selected features associated with component C7 in the CCLE dataset; (B) component C7 is modulated by the targeted modulation of NF-κB top; (C) association of component C7 with FOSL1 mRNA in CCLE and TCGA PanCan12 dataset; (D) CRISPR-CAS9-mediated deletion of FOSL1/FRA1 and JUN led to attenuation of C7, but not suppression of FOS or control; (E) associations of component C4 in the CCLE dataset; (F) suppression of E2F1 attenuates component C2; (G) associations of component C2 in the CCLE dataset; and (H) suppression of ZEB1 attenuates component C2.
Among the genes most significantly associated with C7 was FOSL1 (FRA1) (IC = 0.770, p = 1.35 × 10⁻⁵, FDR = 6.06 × 10⁻²) (Figure 5C), a member of the AP-1 transcription factor family. This component was significantly associated with both higher mRNA and protein levels of FOSL1 (IC = 0.553, p = 1.24 × 10⁻⁵, FDR = 2.22 × 10⁻⁴) in both CCLE cancer cell lines, as well as in PanCan12 TCGA tumor samples (Figure 5C). AP-1 transcription factors are well-known downstream transcriptional regulators of KRAS. To investigate whether FOSL1 was specifically involved in regulating the C7/NF-κB pathway, we utilized CRISPR-CAS9-mediated gene editing to knockout FOSL1 in YAPC, a KRAS mutant cell line with elevated component C7 score (Figure S4), and assessed the transcriptional consequences by mRNA profiling. Consistent with FOSL1 associations with C7, deletion of FOSL1 led to attenuation of C7, as predicted, but not in the negative controls. Interestingly, targeting FOS, another member of the AP-1 transcription factor complex (Figure 5D) did not change the levels of C7. Notably, the change in C7 was observed with deletion of JUN (Figure 5D), a dimerization unit of AP-1, suggesting that the AP-1 complex containing specifically FOSL1, but not FOS, may regulate the activity of component C7 downstream of KRAS.
We also observed significant associations between components C2 and C4 with E2F/MYC and ZEB1/EMT, respectively (Figures 5E–5H). To further validate these associations, we used CRISPR-CAS9 to delete E2F1 and ZEB1 in two KRAS mutant lines, YAPC and HCC44, with moderate/high activation of components C2 and C4, respectively. We observed significant attenuation of the respective components upon deletion of ZEB1 and E2F1 using three independent gRNAs relative to control gRNAs (Figures 5F and 5H), suggesting that these may indeed regulate the proposed pathways. Finally, Component C5 was associated with patterns of overexpression and dependency of HNF1 and PAX8 across multiple cancer types including subsets of ovary (Cheung et al., 2011), kidney, endometrial, and liver (Figure S5).
Similar analyses were applied to the other components and the results are summarized in Table S3. The complete set of component genomic annotations are provided as Supplemental Information. In summary, these observations show that Onco-GPS effectively decomposes KRAS signatures into transcriptional components that reflect previously known and novel events associated with KRAS.
Step III. Define Cellular States and Generate Onco-GPS Map
KRAS Mutant Cancers Map onto Four Distinct Cellular States
Once the nine KRAS components were annotated and validated, we used them to determine what cellular states were consistent with the behavior of these components across KRAS mutant cancers. Interestingly, while the profiles of the nine components (C1–C9) are rather distinct across the entire set of CCLE cancer cell lines as expected (Figures 3, 6A, and S6A), when we restricted the scope to only the KRAS mutant samples, we observed that the components clustered into three major groups: (1) ERBB3/PI3K – WNT/KRAS core – AP1 (C1-C3-C9), (2) E2F – MAPK – EMT – MYC (C2-C6-C4-C8), and (3) PAX8/HNF1B – NF-κB (C5–C7) (Figure 6B). For example, many KRAS mutant cancers with component representing PAX8/HNF1B (C5) also aligned with the component representing NF-κB (C7), while most of the core KRAS/WNT component (C3) aligned with the ERBB3/PI3K component (C1). These observations suggest that, in KRAS mutant cancers, the patterns of pathway co-activation, as represented by the components, reflect specific synergies and patterns of cooperation among these pathways. Based on these clustering patterns, the components C1-C7-C2 were selected as representative of the KRAS mutant cancers and were used to cluster KRAS mutant samples in the reference dataset using Hierarchical Consensus Clustering (Monti et al., 2003) with the IC as similarity metric. This resulted in four clusters representing cellular states: S1–S4 (Figure 6C, top).
Figure 6. Generation of Onco-GPS Map for KRAS Mutant Cancers.

(A and B) Association matrix of the nine KRAS components (C1–C9) with each other according to the information coefficient (IC) in (A) all CCLE samples, (B) the KRAS mutant samples. Components highlighted in red depict components that were chosen as representative components for subsequent analysis.
(C–E) Generation of Onco-GPS Map for CCLE KRAS mutant cancers from components C1-C7-C2 and their corresponding states S1–S4 (C). KRAS mutant samples color coded according to ZEB1 targets gene set (D) and NF-κβ gene set (E).
(F) Validation of drug combination prediction in a subset of Onco-GPS samples across three cancer cell lines representing state S4 versus other states.
(G) The each heatmaps show relative cell viability measured by CellTiter-Glo Assay (blue to viable red: decreased viability) upon combined treatment of Lapatinib and PD-0325901. Horizontal gray triangles represent seven increasing doses of PD-0325901 ranging from 0 to 500 nM, vertical great triangles represent nine increasing doses of Lapatnib from 0 to 33 μM). All relative viability values represented in the heatmaps were normalized to DMSO control (red, cell enrichment; blue, cell depletion).
(H) Summary of key genomic features associated with each of the 4 KRAS mutant Onco-GPS states S1–S4.
Projecting KRAS Mutant Cancers onto the Onco-GPS Map
To facilitate the visualization and integrated analysis of components, samples, and cellular states, we devised a novel visualization/analysis paradigm that we call Onco-GPS map. In this map, the transcriptional components are represented by nodes connected by straight lines (Figure 6C, bottom and S1B). The location of these nodes on the map derive from a projection algorithm (Sammon map) that makes the two-dimensional geometric distances between nodes approximate the “informational” distances between the components across the KRAS mutant samples in the reference dataset (STAR Methods). Once the location of the component nodes are known, the location of an individual sample can be found by calculating a vector sum of the components’ locations weighted by their component amplitudes for that sample. Using a physical analogy, this corresponds to calculating the equilibrium location of a mass being pulled by multiple strings (Figure 1, panel III); or, using a geographical GPS analogy, it corresponds to deriving the location of an object by estimating its proximity to a set of reference satellites (Figures 6C, bottom and S1C). In this way, samples with relatively high amplitude of a given component, with respect to the rest, will be projected near the location of that dominant component’s node (Figure 1, panel III). Finally, the states can be represented using background contour lines and colors in such way that a “region” of the map corresponds to samples sharing the same cellular state membership (Figures 6C, bottom and S1D; see STAR Methods for details).
One powerful feature of the Onco-GPS map is that once a group of samples has been projected onto it, they can be color coded to represent sample-specific, molecular features or phenotypes of interest. For example, we can specify the tissue representation of individual KRAS mutant cancers associated with each cell state depicted on the Onco-GPS map (Figure S6). Moreover, in the Onco-GPS maps shown in Figures 6D and 6E, we color coded the samples to represent the activities of ZEB1 and NF-κB pathways using two independent signatures (Hinata et al., 2003; Aigner et al., 2007). In Figure S7, we color coded the samples to show the amplitude of each component. This allows a direct visual assessment of how each sample associates with specific features and biological phenotypes of interest, as well as enabling tracking of dynamic changes in the cell state of individual samples. We can also use the Onco-GPS to support high-level probabilistic inferential models or networks to predict functional phenotypes such as drug responses (see STAR Methods for details).
Analyzing the Onco-GPS KRAS Mutant Cellular States
We analyzed the top features associated with each of the four KRAS mutant states (S1–S4) and found that numerous gene sets representing EMT markers were enriched in states S1 and S2, and NF-κB gene sets were enriched in states S2 and S3 (Figures 6D and 6E). This clearly delineates two major “axes” on the KRAS Onco-GPS: a vertical axis associated with the EMT, and a horizontal axis representing NF-κB activity. This observation confirms previous studies that suggested that EMT underlies the KRAS dependency phenotype (Singh et al., 2009), but also suggests the existence of additional, more refined states that can be explained by NF-κB activation status. To confirm these observations, we analyzed the expression of specific proteins and pathways in representative cancer cells in each subgroup. In agreement with the Onco-GPS predictions, we found that representative markers of epithelial (E-cadherin expression) and EMT (ZEB1 expression), as well as activation of NF-κB (p65 Ser536), were associated with samples in each of these major cell states (Figure S8).
Notably, we also observed significant association of these cell states with expression of specific RTKs (Figures S9A–S9E). For example, expression of ERBB3 was significantly associated with state S4, defined by the core KRAS/WNT component (C3) and the ERBB/PI3K component (C1), while AXL/EGFR and MET were more dominant in states S2 and S3, respectively. As these states were defined purely by unbiased transcriptional analysis, their association with specific RTKs suggests that these either (1) play a direct role in defining these states, or (2) they reflect downstream transcriptional consequences of KRAS activation in those states. Indeed, prior studies have shown that expression patterns of certain RTKs are important in determining phenotypic outcomes among KRAS-driven cancers (Salt et al., 2014; Sun et al., 2014; Manchado et al., 2016).
State S1 KRAS Mutant Samples Are Sensitive to the Lapatinib and PD-0325901 Combination
We hypothesized that knowledge of the state for a given group of samples could be used to predict their chemical sensitivities to single agents or combinations that target the corresponding co-activated components. To assess the potential of this approach, we measured the associations between drug-sensitivity profiles and component activity across the reference dataset. Because only two components, C1 and C3, were enriched in state S4 relative to the remaining states, we inferred that these would be sensitive to the combined inhibition of these two components (Figure S7; Table S4). The initial analysis of those components found that they were indeed independently sensitive to Lapatinib and PD-0325901, respectively (Table S5). We therefore performed a set of experiments to assess the sensitivity of a group of KRAS mutant cell lines to these two drugs as single agents and in combination. We choose three samples in state S4, high in the relevant components, C1 and C3, and a lineage-matched group of three samples representing the other states as controls (Figure 6F). As predicted, we found significant sensitivity to the compound combination in KRAS mutant cancers in state S4 (Figure 6G, bottom row) but not in the control group (Figure 6G, top row). These results indicate that KRAS mutant cancers associated with Onco-GPS cell states share chemical sensitivity phenotypes and demonstrate that this approach can be used effectively to predict drug combinations.
Collectively, these observations suggest that this approach can help to devise strategies to more effectively characterize KRAS mutant cancers, as well as identify potential biomarkers to infer disease states, and to guide the choice of pharmacological or immunological therapeutic agents. A summary of features associated with each KRAS transcriptional states (S1–S4) can be found in Figure 6H and Table S4.
An Onco-GPS for BRAF Mutants
We also used the Onco-GPS approach to explore cancers with mutations in BRAF using their most relevant subset of KRAS components: C6-C7-C3 (Figure S10). In this case, the Onco-GPS clustering of BRAF mutant cancers produced three states (Figure S11) delineated by two major axes: BRAF/MAPK and NF-κB activation (Figure 7A). In the BRAF Onco-GPS map, the majority of BRAF mutant melanomas span states S1 and S2 proximal to C6 (the BRAF/MAPK component) (Figure S12). The most resistant BRAF mutant cancers were mapped either on state S2, close to C7 (NF-κB/FOSL1 component), or on state S3 close to C3 (RAS/WNT component) (Figure 7A). Then we analyzed the response of those BRAF mutant samples to two selective BRAF inhibitors, Vemurafenib and PLX4620. Samples in state S1 show significant sensitivity to these agents consistent with having higher amplitude of C6 (Figures 7B and 7C). In a similar manner to the KRAS mutant cancers, we also found significant associations of these states with overexpression of specific RTKs, namely, AXL and EGFR in state S2, as well as transcription regulators MITF and SOX10 in state S1 (Figure S13). This heterogeneity in the response to BRAF inhibition, and the identification of associated genomic hallmarks, is consistent with prior studies that identified the activation of NF-κB and AXL/EGFR as intrinsic BRAF inhibitor resistance mechanisms in both BRAF mutant melanomas and colorectal cancers (Wood et al., 2012; Garraway and Lander, 2013, Konieczkowski et al., 2014). We also found that this relationship generalizes to an independent dataset of non-overlapping BRAF mutant cancer cells (Sanger Cell Lines Project) for which a different MAPK inhibitor was used (PD-0325901) (Figure S14) (Garnett et al., 2012). Furthermore, we show that more sophisticated models for predicting MAPK inhibition response can be implemented, e.g., using a Bayesian predictor based on the BRAF Onco-GPS amplitudes of C6, C7 and the mutation status of NRAS, KRAS, and EGFR (Figures S15 and 16; STAR Methods).
Figure 7. Onco-GPS Map for BRAF Mutant Cancers.

(A) BRAF mutant cancers divided into three states are depicted on the Onco-GPS map and their corresponding states S1–S3.
(B and C) Drug sensitivities to (B) BRAF inhibitor Vemurafenib (p = 0.001) and (C) PLX4720 in the CCLE dataset (p = 0.001).
(D) Summary of genomic features associated with each of the BRAF mutant Onco-GPS states S1–S3.
Finally, the three states defined by the BRAF mutant Onco-GPS were also recapitulated by de novo Onco-GPS maps generated by replacing the KRAS components with selected pathways or proteins informed by each of the C6, C7, and C3 components, suggesting that these states are robust and can be identified using their relevant marker features (Figure S17).
A summary of features associated with each BRAF transcriptional state can be found in Figure 7D and Table S6.
DISCUSSION
In this study, we introduce Onco-GPS as a general methodology and framework to decompose transcriptional signatures to delineate oncogenic cellular states. These states explicitly take into account context dependencies, heterogeneity, and the complexities associated with oncogenic activation. It is a fully data-driven approach and serves as a powerful device to establish relationships among features that are informative in strategizing therapy against cancers which otherwise share common oncogenic lesions.
Generation of informative Onco-GPS maps to explore genomic events or pathways will require derivation of accurate transcriptional profiles reflecting oncogenic activities in the relevant cellular contexts, as well as the ability to characterize and validate the resulting components and Onco-GPS cell states. The Onco-GPS decomposition makes use of signatures from isogenic systems of several different cellular backgrounds that provide clean and direct transcriptional information relevant to the oncogene; while at the same time incorporating diverse regulatory circuits inherently represented across multiple cellular contexts in the reference dataset. This approach deconvolves the functional consequences of oncogene activation in a more direct and unambiguous way. As we have shown, the resulting components offer many advantages as building blocks to define cellular states, compared with traditional signatures of oncogenic activation.
The nine KRAS components unveiled by the Onco-GPS analysis provide an intriguing view into RAS biology. It is remarkable that these components identify and summarize a surprisingly large number of known results in a systematic and unbiased manner. The components represent many well-known RAS-related pathways and processes that are induced synergistically with a less familiar combinatorial logic. For example, C6 clearly recapitulates changes associated with BRAF/MEK activation but it does not appear to be the “core” signal downstream of KRAS most associated with KRAS dependency. Instead, component C3, represents a combined RAS/WNT activation that associates more strongly with the KRAS dependency phenotype. Another key observation is that C3 and C6 profiles are associated with the variability in sensitivity to KRAS and BRAF inhibition. Previous studies have shown that the EMT program, through the ZEB1 transcription factor activity, underlies KRAS independence (Singh et al., 2009); and that the transition between MAPK inhibition-sensitive and -resistant states in BRAF mutant melanoma is associated with the interplay between MITF and NF-κB/AXL (Konieczkowski et al., 2014; Zhu et al., 2014). Our observations confirm these results and propose a causal link between default transcriptional activation of KRAS and BRAF (i.e., C3, C6), lineage-specific transcriptional program, and oncogene addiction/dependency. In this model, attenuation of the default transcriptional activity, and the consequent loss of oncogene dependency, is substituted by the activation of NF-κB/AXL and/or EMT programs. This in turn defines boundaries between oncogenic states associated with activation/repression of specific “transition circuits.” In this transition between two oncogenic states with different properties, the relevant synergies or incompatibilities of different oncogenic circuits become explicit and impinge on the overall viability and pathway activation profiles at both sides of the transition. These transitional hallmarks are reminiscent of the “order parameters,” e.g., in a physical phase transition between different phases of a complex material (Sethna, 2011; Fultz, 2014), and suggest that the specific changes across the Onco-GPS states can provide a way to identify the most salient cellular circuits associated with resistance mechanisms. In addition, the fact that these two related but distinct oncogenic events display common pattern(s) of functional cooperation between the oncogene- and lineage-specific transcription factors (i.e., MITF, HNF4α/CDX2 versus HNF1B/PAX8, epithelial/EMT cell states, respectively), suggests that the lineage-specific transcriptional program and the de-differentiation program may also participate in the defining cell states that are relevant for therapeutic strategies. The observation that resistant states, for both KRAS and BRAF mutant cancers, lie next to each other in the C7/NF-κB “phase,” suggests an intriguing functional convergence of resistance mechanisms that deserves further study.
The Onco-GPS results for both KRAS and BRAF mutant cancers strongly suggest that the mutation status alone is not a good proxy for the true “functional” oncogenic state. Indeed recent work indicates that tumors that harbor KRAS mutations are heterogeneous and that cell lineage and other genetic alterations differentiate subtypes of KRAS-driven cancers. Despite their underlying complexities, however, these cancers can be effectively categorized (Prahallad et al., 2012; Konieczkowski et al., 2014; Skoulidis et al., 2015). The divergent transcriptional states and associated features represented on the respective Onco-GPS maps, also suggest an interplay between oncogene activation and additional molecular events that ultimately drive cancers into a few, genetically complex but functionally similar, viable end states. Knowledge of these cooperating molecular events, or “genetic modifiers” may be critical in understanding their role vis-à-vis oncogenic states. For example, in non-small-cell lung carcinoma cancers mutational changes in TP53 and LKB1 have been shown to be enriched in differential gene expression changes in KRAS mutant cancers (Skoulidis et al., 2015). Moreover, we observed significant enrichment of genomic aberrations in WNT components associated with KRAS mutant cancers in state S4. However, in examining the broader contributions across a large group of states associated with both KRAS and BRAF mutant cancers, no single event shows perfect one-to-one association with the Onco-GPS cellular states. In this situation, the functional role of those events may only be elucidated based on their complementarity and joint association against functional profiles, such as those provided by the Onco-GPS components or states (e.g., Kim et al., 2016). Another possibility, not necessarily exclusive of the previous one, is that the tissue of origin upon which the oncogene was activated also plays an important role in determining the viable states. This is supported by the differences we observed between the isogenic systems (data not shown), and the observation that certain tissues were more enriched in one state than the other in both the KRAS and BRAF Onco-GPS maps. However, it is unlikely that this may be the sole contributor as we also observe many exceptions. Another plausible explanation is that epigenetic events may also cooperate with the oncogenes in determining the induced states. Epigenetic landscapes have been shown to underlie developmental programs, and perhaps provide a more molecularly tractable definition of how all of the aforementioned events might converge (Dawson and Kouzarides, 2012; Pott and Lieb, 2015). Indeed, the interplay of activated RAS with the PRC2 complex has recently been associated with an EMT-associated phenotype (De Raedt et al., 2014; Serresi et al., 2016). The diversity of oncogenic states induced by KRAS may also help explain the striking lack of overlap of the many RAS synthetic lethality lists published over the last decade (Downward, 2015).
We also showed that Onco-GPS can be used to predict the response of individual samples to single agents or combinations that target states by ablating their corresponding components for cancers with well-defined oncogenic lesions, but divergent response profiles. While this presents a powerful approach to infer combinatorial drug strategies, a key rate-limiting step is the lack of drug representation in some of the pathways or components. For example, there are only few drugs that target components C7, C2, and C4, which represent NF-κB, MYC/E2F, and EMT nodes, respectively. This may simply be due to lack of appropriate agents against these pathways or lack of chemical diversity in the available datasets. It is also possible that these states are intrinsically more robust, and consequently require the joint targeting of multiple pathways, or multiple entry points in the same pathway, to elicit a more significant effect on cell viability. This would be consistent with our prior observation that no single inhibitor appears to effectively target the entire NF-κB network in a KRAS oncogenic context (Barbie et al., 2014; Zhu et al., 2014). An interesting feature exclusively associated with state S3 was the overexpression of PDL-1 (Figure S9E). PDL-1 is known to play an inhibitory role against the immune system, and our results suggest that S3 KRAS mutant cancers may be configured to induce an immune evasion strategy through cell autonomous expression of PDL-1. This also suggests that Onco-GPS maps may serve as a guide to identify cancers that may benefit from the use of specific immunological interventions.
The Onco-GPS approach as a whole can serve as a framework to begin to explore other oncogenic events and pathways that can be tailored to accommodate differences in the biological complexities in each scenario. Further, individual steps involved in the generation of Onco-GPS (steps I to IV) can also facilitate analysis of relevant questions of interest. For example, the Onco-GPS map provides an effective analysis and visual paradigm for the development of network and inferential models that make explicit use of cellular states and other molecular hallmarks (i.e., cell state markers and biomarkers), to delineate differences or similarities and guide effective therapeutics strategies. Furthermore, Onco-GPS visualization facilitates depiction and tracking of dynamic changes in cell states of individual samples, rather than display them as static entities. The inferred oncogenic states can also be used as part of a high-level description and as input to models where they can mediate the statistical dependencies between genomic hallmarks and functional cellular phenotypes such as responses to pharmacological or immunological agents (see, e.g., Figures S15 and S16). The Onco-GPS approach can serve as a foundation for more comprehensive, flexible, and effective disease models for research purposes and as part of individualized precision medicine paradigms.
The analysis steps of the Onco-GPS method will be made available as a collection of Jupyter notebooks available at https://github.com/UCSD-CCAL/onco-gps-paper-analysis.
STAR★METHODS
KEY RESOURCES TABLE
| REAGENT or RESOURCE | SOURCE | IDENTIFIER |
|---|---|---|
| Antibodies | ||
| p-NF-KB | Cell Signaling | Cat #: 3033 |
| FRA1 | Cell Signaling | Cat #: 5281 |
| ZEB1 | Santa Cruz Technologies | Cat #:25388 |
| E-cadherin | BD Biosciences | Cat #:BDB610181 |
| B-actin | Santa Cruz Technologies | Cat #:47778 |
| Chemicals, Peptides, and Recombinant Proteins | ||
| Lapatinib | Selleck Chemicals | Cat #: S1028 |
| PD-032521 | Selleck Chemicals | Cat #: S1036 |
| Critical Commercial Assays | ||
| Cell-titer-glo | Promega | G7572 |
| IRDye® 800CW Goat anti-Mouse IgG | LI-COR | P/N 925-32211 |
| IRDye® 800CW Goat anti-Mouse IgG | LI-COR | P/N 925-68021 |
| RNeasy Plus Mini Kit | QIAGEN | Cat#: 74134 |
| Pierce BCA Protein Assay Kit | Thermo Scientific | Cat#: 23225 |
| Deposited Data | ||
| Raw data files for RNA sequencing for KRAS signatures | NCBI Gene Expression Omnibus | GEO: GSE94937 |
| Raw data files for RNA sequencing for CRISPR-Cas9 Experiments | NCBI Gene Expression Omnibus | GEO: GSE84706 |
| BRAF signature (L1000) | Supplemental Information | #5 |
| ETV1 L1000 | Supplemental Information | #5 |
| Experimental Models: Cell Lines | ||
| HCC44 | DSMZ | Cat#: ACC 534 |
| YAPC | DSMZ | Cat#: ACC 382 |
| LS513 | ATCC | CRL-2134 |
| HCT15 | ATCC | CCL-225 |
| AGS | ATCC | CRL-1739 |
| NCI-H2009 | ATCC | CRL-5911 |
| NCI-H358 | ATCC | CRL-5807 |
| MIAPACA2 | ATCC | CRL-1420 |
| KP4 | RIKEN | RCB1005 |
| CALU1 | ATCC | HTB-54 |
| RKN | Health Science Research Resources Bank (HSRRB) | IFO50317 |
| SALE | Lundberg et al., 2002 | N/A |
| HMLE | Elenbaas et al., 2001 | N/A |
| PMEL | Garraway and Lander, 2013 | N/A |
| Recombinant DNA | ||
| KRAS G12V plx304 | Shao et al., 2014 | N/A |
| BRAF V600E plx304 | Jané-Valbuena et al., 2010 | N/A |
| ETV1 plx304 | Jané-Valbuena et al., 2010 | N/A |
| GFP pdonr223 | Addgene | # 25899 |
| lentiCas9-Blast | Addgene | #52962 |
| lentiGuide-Puro | Addgene | # 52963 |
| Sequence-Based Reagents | ||
| Primer for CRISPR-Cas9 gRNA | Supplemental Information | #6 |
| Software and Algorithms | ||
| PICARD | https://broadinstitute.github.io/picard/ | |
| PRADA | Torres-García et al., 2014 | |
| Cufflinks | http://cole-trapnell-lab.github.io/cufflinks/ | |
| ssGSEA | www.Genepattern.org | |
| Other | ||
| Melanoma samples with MEKi treatment | NCBI Gene Expression Omnibus | GSE51115 |
| Rescue of KRAS suppression in HCT116 colon cancer cell line | NCBI Gene Expression Omnibus | GSE55942 |
| Inducible KRAS model of mouse pancreatic cancer | NCBI Gene Expression Omnibus | GSE32277 |
| Melanoma patient samples before and after MEKi treatment | NCBI Gene Expression Omnibus | GSE50535 |
| NSCLC cell lines with NF-KB modulations | NCBI Gene Expression Omnibus | GSE33322 |
| Primary Colorectal Tumors | NCBI Gene Expression Omnibus | GSE39084 |
| Lung Adenocarcinoma | NCBI Gene Expression Omnibus | GSE40419 |
| PanCan TCGA datasets (PanCan12) | Hoadley et al., 2014 | Synapse.org |
| Achilles | www.broadinstitute.org/achilles | V2.20.1 |
| CTD2 | www.broadinstitute.org/ctrp (Seashore-Ludlow et al., 2015) | CTRPv2.2 |
| CCLE | www.broadinstitute.org/CCLE | V2 |
| Gene sets | www.msigdb.org | C1, C2, C7 collection |
| OncoGPS | This study. | https://github.com/UCSD-CCAL/onco-gps-paper-analysis |
CONTACT FOR REAGENT AND RESOURCE SHARING
Further information and requests for resources and reagents should be directed to and will be fulfilled by the Lead Contact Pablo Tamayo (ptamayo@ucsd.edu).
EXPERIMENTAL MODEL AND SUBJECT DETAILS
Isogenic Cell Lines
Immortalized lung (SALE) were obtained and propagated as previously described (Lundberg et al., 2002). Briefly, SALE cells were grown in SABM medium (CC-3119, Lonza) containing SingleQuot Kit Supplement and Growth Factors (CC-4124). HMLE cells were grown in MEBM medium (Lonza - CC-3151) supplemented with SingleQuot Kit Supplement and Growth Factors (CC-4136). PMEL cells were grown in TICVA medium containing −100 μM isobutylmethylxanthine IBMX (Sigma), 50 ng/ml 12-O-tetradeca-noyl-phorbol-13-acetate TPA (Sigma), 1 μM sodium vanadate Na3VO4, 1 mM N6, 2′-O-dibutyryladenosine 3:5-cyclic monophosphate dbcAMP (Sigma). All cells were incubated at 37 °C in 5% CO2.
KRAS Mutant Cancer Cell Lines
HCC44, YAPC, LS513, HCT15, AGS, NCI-H2009, NCI-H358, MIAPACA2, KP4, CALU1, RKN were cultured in either DMEM or RPMI supplemented with 10% FBS. All cells were incubated at 37 °C in 5% CO2.
Authentication of Cell Lines Used
The cancer cell lines were obtained from the Cancer Cell Line Encyclopedia (https://portals.broadinstitute.org/ccle/home). All cell lines were fingerprinted multiple times using one of two genotyping platforms, Sequenom or Fluidigm. Sex of the cell lines are as follows; Male: YAPC, LS513, HCT15, NCI-H358, MIAPACA2, KP4, CALU1, Female: HCC44, AGS, NCI-H2009, RKN.
METHOD DETAILS
Plasmids and Cloning Constructs
For the generation of the CRISPR-Cas9 gRNAs, we used lentiGuide-Puro (Addgene) vector as a backbone. Single stranded oligos were ordered through IDT and annealed. LentiGuide-Puro were linearized using BsmBI restriction enzyme (NEB). Complementary single-stranded DNA oligos were annealed and the resulting double-stranded oligos were ligated into the linearized vector, followed by transformation in the Stbl3 (Invitrogen) competent cells for subsequent positive colony screening and propagation of the plasmid.
Lentivirus Generation
293T cells were transfected with respective lentiviral vector along with packaging plasmids (delta8.9 and VSV-G) using TransIT transfection reagents (Mirus Bio) and Optimem reduced serum media (Thermo Scientific). Viruses were collected 48 hours after infection in DMEM supplemented with 20% FBS. All virus production and infections were carried out in BL2+ designated area by strictly following biohazard safety regulations.
Experimental Oncogenic Signature Generation
For the generation of the mRNA profile of KRAS, BRAF and ETV1 activation, HMLE, SALE or PMEL cells were infected with lentiviral constructs in plx304 vector expressing Open Reading Frame (ORFs) KRAS G12V, BRAF V600E, ETV1 or GFP in duplicates, supplemented with 8 μg/ml polybrene. Cells were either harvested 24 hours after infection, or selected with blasticidin (10 μg/mL). For the generation of KRAS signature, three independent experiments were carried using one of the two KRAS G12V expression vector plx304 or plx302, which expresses selectable marker for blasticidin (10 μg/mL) and puromycin (2ug/mL), respectively. They cells were harvested after stable cell lines have been established and growth was resumed after 1–2 weeks post infection. For harvesting, the cells were washed three times in ice cold PBS, and lysed, and harvested using the RNeasy mini kit according to the manufacturer’s protocols (Qiagen).
CRISPR-Cas9 Experiments
CRISPR-Cas9 experiments were carried out by first infecting HCC44 and YAPC cells with CAS9 using plx311 vector and selecting with blasticidin (10 μg/mL) to obtain stable CAS9 expressing cell lines. gRNAs were generated in pxr001 vector by cloning gRNAs against ZEB1, FOSL1, FOS, JUN and E2F1, as well as GFP, RFP and random gRNA controls. Three independent sequences for each gRNAs were used for experimentation (1 of 3 FOSL1 gRNA used for RNAseq experiment was flagged after quality control). These gRNAs were then infected and selected with puromycin (1ug/mL) 1 day after infection. Cells were harvested and RNA was extracted after 5 days infection using RNeasy mini kit (Qiagen).
Generation of BRAF V600E and ETV1 Signatures Using L1000
The mRNA profiles for BRAF B600E and ETV1 were obtained using the Broad Institute’s Luminex L1000 gene expression profiling platform (Peck et al., 2006). L1000 is a multiplexed gene expression assay that uses ligation mediated amplification (LMA) of RNA sequence specific probes combined with Luminex based detection to generate expression profiles of 978 genes (landmark genes) per sample in a 384 well format using Luminex FlexMap flow cytometry-based scanner. The resulting readout is a measure of mean fluorescent intensity (MFI) for each landmark gene. The raw expression data are log2-scaled, quantile normalized, and z-scored, such that a differential expression value is achieved for each gene in each well. Ectopic expression of BRAF V600E and ETV1 was confirmed by immunoblotting with V5 antibody (Life Technologies) prior to harvesting, or by examining the expression of individual transcript levels in the mRNA profiles.
RNAseq Library Preparation and Sequencing
mRNA profiles for the generation of KRAS signature and the CRISPR perturbation profiles were carried out by RNAseq profiling approaches. Libraries were prepared using Illumina TruSeq Stranded mRNA sample preparation kits from 500ng of purified total RNA according to the manufacturer’s protocol. The finished dsDNA libraries were quantified by Qubit fluorometer, Agilent TapeStation 2200, and RT-qPCR using the Kapa Biosystems library quantification kit according to manufacturer’s protocols. Uniquely indexed libraries were pooled in equimolar ratios and sequenced on an Illumina NextSeq500 with single-end 75bp reads by the Dana-Farber Cancer Institute Molecular Biology Core Facilities.
RNAseq Data Processing
FASTQ files were processed into BAM files using picard, a set of command line tools for manipulating high-throughput sequencing data using Homo Sapiens genome assembly 19 as the reference genome (McKenna et al., 2010) http://broadinstitute.github.io/picard/. These files were subsequently processed through the Broad Institute’s firehose RNASeq pipeline by using the following modules; PRADA - BAM to FASTQ for RNA-Seq (version 27), Align RNA Fastq (version 32), Mark Duplicates for RNA-Seq (version 25), Recalibrate RNA-Seq Bam Erase Intermediate Files for RNA-Seq (version 28). RPKM values were derived from processing through the Cufflinks (version 12).
Immunoblots
KRAS mutant Cancer cell lines, were grown in RPMI or DMEM supplemented with 10% FBS. Cells were harvested by removing the media and washing twice in ice cold Phosphate Buffered Saline (PBS), followed by cell lysis with Radioimmunoprecipitation assay buffer (RIPA). The resulting lysate was centrifuged at maximum speed for 30 minutes and supernatant was resolved on a 4–12% Tris-Glycine gel using SDS-Page electrophoresis. Proteins were transferred to PVDF membrane and incubated overnight at 4 degrees with following antibodies; p-NF-KB - Ser536 (3033) (Cell Signaling), FRA1 (D80B4) (Cell Signaling). ZEB1 (Santa Cruz Technologies) E-cadherin (Santa Cruz Technologies) and B-actin (Santa Cruz Technologies). The membranes were further washed in PBS supplemented with 0.01% Tween and imaged on a LI-COR system.
Drug Sensitivity Experiments
DV90 (250 cells/well), LOVO (250 cells/well), NCI-H2122 (250 cells/well), NCI-H1792 (250 cells/well), NCI-H23 (500 cells/well) and SW620 (1000 cells/well) were plated at optimized cell densities in media (30 uL) in 384 well plates and incubated for 24 hours in standard cell culture conditions. Lapatinib and PD-032501 were dissolved in DMSO and added as a single agent or combination in serial dilution ranging from concentration (6 dilutions ranging from 0 to 0.5uM for PD-032521 and 9 dilutions ranging from 0 to 33uM for Lapatinib). After 72 hours, Celltiter-Glo (Promega) diluted 1:2 with PBS was added to each well (30 uL) and incubated at room temperature for 10 minutes. Luminescence was measured using the EnVision plate reader (Perkin-Elmer). Cell viability was normalized to the appropriate no treatment control. All experiments were carried out in triplicates on independent days. The data points are averages of % viability in quadruplicates normalized to cells alone and plotted on a log scale.
QUANTIFICATION AND STATISTICAL ANALYSIS
Generation of Oncogenic Signatures
The BRAF and ETV1 signatures shown in Figure 2 were generated using consensus signatures combining the top 50 differentially expressed genes between isogenic cells controls and those infected with lentiviral constructs of BRAF V600, and wild-type ETV1 vs. controls in HMLE (breast), PMEL (skin) and SALE (lung) epithelial cell lines (see Isogenic Cell Lines above).
The KRAS I signature was generated using lentiviral constructs of KRAS G12V in lung SALE epithelial cell lines. The cell lines were immortalized by the introduction of TERT, and transformed by SV40 early region (Large-T and small-t antigen) and the relevant oncogene. These samples have been harvested post 24 hours after infection for early time point, and 2–3 weeks after infection to capture the activity of these oncogenes at a later time point. The mRNA profiles for BRAF B600E and ETV1 were obtained using the Broad Institute’s Luminex L1000 gene expression profiling platform (Peck et al., 2006). mRNA profile for KRAS signature was generated using Illumina NextSeq500 with single-end 75bp reads to generate RNAseq reads. The other 3 KRAS signatures (KRAS II-IV) correspond to the following gene sets:
KRAS II: gene set “CHIARADONNA_NEOPLASTIC_TRANSFORMATION_KRAS_UP” from MSigDB 5.1 sub-collection C2 (www.msigdb.org).
KRAS III: gene set “KRAS.LUNG.BREAST_UP.V1_UP” from MSigDB 5.1 sub-collection C6 (www.msigdb.org).
KRAS IV: gene set “SWEET_KRAS_ONCOGENIC_SIGNATURE” from MSigDB 5.1 sub-collection C2 (www.msigdb.org).
The signatures profiles shown in the heatmaps were obtained using single-sample GSEA (Barbie et al., 2009). The heatmaps in Figures 2A and 2B correspond to the skin, lung, pancreas and ovary cancer cell lines in the CCLE dataset (Barretina et al., 2012), and the heatmaps in Figures 2D and 2E correspond to the lung, pancreas, ovary, large intestine and breast cancer cell lines from the same dataset. The mutation status of BRAF and KRAS used in those heatmaps, and for model fitting, was part of the mutation dataset part of the CCLE (Barretina et al., 2012). The models to predict activation are logistic generalized linear models (R function glm, Venables and Ripley, 2002) fitted to the mutations status of BRAF or KRAS using as input the ssGSEA score for the relevant signature. The threshold for activation was set at 50% probability (Figures 2B and 2E). For the signature used in the decomposition step of the Onco-GPS method we generated a higher-resolution KRAS signature based on RNASeq profiling of lentiviral constructs of KRAS G12 vs. controls in lung SALE epithelial cell lines. We also performed pilot experiments to identify optimal set of conditions (time, viral titer) to carry out the main experiments as well as to confirm the expression of these genes in the cell lines described above (Figure S2). This signature contains the 1,000 most differentially expressed genes (top 500/bottom 500) according to the Information Coefficient (IC) (Kim et al., 2016). We have also repeated the analysis using different number of genes from 500 to 2,000 and found very similar results indicating that the exact number of genes is not critical and the results are robust in general as long as the selected number of genes is not too small or too large. In other applications of the Onco-GPS methodology e.g. to new datasets, if the number of samples is enough, one can alternatively select the signature genes using a threshold on the The FDRs are computed from empirical p-values using the standard Benjamini-Hochberg procedure. The empirical p-values are obtained from an empirical permutation test where the target profile is randomly permuted to generate a null distribution for the Information Coefficient values. Discovery Rates (FDR) on both sides (up-regulated and down-regulated) of the gene list. In the case of the KRAS isogenic samples presented in the manuscript their number is rather small and as consequence the FDR estimates are not very reliable and we opted to use the gene-number threshold of 1,000. This threshold is roughly equivalent to an FDR of about 0.05.
Decompose Signature and Generate Transcriptional Components
The oncogenic signature defined above is decomposed using Non-Negative Matrix Factorization (NMF) (Brunet et al., 2004; Tamayo et al., 2007) in the Broad-Novartis Cell Line Encyclopedia Reference Dataset (CCLE)(Barretina et al., 2012). This dataset, hereafter denoted as An×m, contains n rows (oncogenic signature) and m samples representing many instances of the cellular states of interest. In the KRAS example featured in the main text n = 1,000 and m = 750. The procedure is performed as follows:
Generate Onco-GPS Transcriptional Components
Normalize the input matrix An×m by replacing each gene expression entry by its column rank and obtain matrix .
-
Perform a standard non-negative matrix factorization (NMF) (Cichocki et al., 2008; Brunet et al., 2004) of matrix ,
(Equation 1) where the resulting matrices Wn×k and Hk×m have lower rank than the original matrix An×m (k ≪ n,m).
Find an optimal number of components kC based on the numerical stability of multiple projections using different random seeds following the procedure from (Brunet et al., 2004). The peaks of the cophenetic coefficient represent the more stable decompositions and in our KRAS example we found an optimal solution at kC = 9 (Figure S2D).
Notice that Matrix Hk×m has the same number of samples as An×m but a smaller number of rows and can be interpreted as a summarized version of the original dataset, i.e., one described in the space of the most salient transcriptional programs (components) rather than the original variables (genes). In the KRAS example this procedure produces the 9 transcriptional components C1–C9 described in the main text.
Analyze and Annotate the Transcriptional Components
In this step we perform a detailed analysis of the transcriptional components produced by the NMF decomposition in order to assign a biological interpretation to each component. The analysis consists of the following steps:
Define a target profile for each component in the CCLE Reference Dataset using the amplitudes of the Hk×m matrix. This matrix represents the intensity of each NMF component per sample.
-
Using the Information Coefficient (IC) (Kim et al., 2016) estimate the degree of association of each component target profile and the following genomic features:
Mutations and Copy Number Alterations (CNA). CCLE mutation and copy number datasets, www.broadinstitute.org/ccle (Barretina et al., 2012). (The CCLE and Achilles datasets used in this analysis are preliminary versions of official releases that will become publicly available in 2016.)
Gene expression. CCLE RNA Seq dataset*, www.broadinstitute.org/ccle (Barretina et al., 2012).
-
Pathway expression (single sample GSEA of MSigDB gene sets) MSigDB v5.1 sub-collections c2, c5, c6 and h www.msigdb.org (Liberzon et al., 2011, 2015) and a few additional gene sets (Table S7):
TAUBE_EMT_UP/DN, EMT gene set (Taube et al., 2010).
GROGER_EMT_UP/DN, EMT gene set (Groger et al., 2012).
-
Isogenic cell lines signatures (see Isogenic Cell Lines and Generation of Oncogenic Signatures sections above):
BRAF_UP/DN (BRAF/V600 consensus signature in SALE, HMLE and PMEL),
ETVI_UP/DN (ETV1 consensus signature in SALE, HMLE and PMEL),
KRAS.Lung_SALE.Weeks_UP/DN (KRAS mut G12 signature in SALE),
KRAS.Breast_HMLE.Weeks_UP/DN (KRAS mut G12 signature in HMLE).
KRAS.Skin_PMEL.Weeks_UP/DN (KRAS mut G12 signature in PMEL).
TF and master regulators expression (single sample GSEA of gene sets) MSigDB v5.1, (Liberzon et al., 2011) www.msigdb.org, sub-collection c3 and 1,598 IPA gene sets, http://www.ingenuity.com.
Protein expression. CCLE Reverse Phased Protein Array (RPPA) dataset*, www.broadinstitute.org/ccle (Barretina et al., 2012).
Drug sensitivity1. CTRP dataset, www.broadinstitute.org/ctrp (Seashore-Ludlow et al., 2015).
Drug sensitivity2. CCLE pharmacological profiling, www.broadinstitute.org/CCLE (Barretina et al., 2012)
Gene dependency. RNAi Achilles dataset*, www.broadinstitute.org/achilles, (Cowley et al., 2014).
The Information Coefficient (IC) (Linfoot, 1957; Joe, 1989; Kim et al., 2016) used for this task is a normalized version of the mutual information defined as,
| (Equation 2) |
where I(x,y) is the differential mutual information between x e.g. one of the component profiles (i.e. a row of the Hk×m matrix), and y e.g. a genomic feature such as, e.g., the mRNA profile of a gene. This quantity is easier to interpret than the mutual information because it lies in the range [−1, 1], in analogy with the correlation coefficient. The sign of the correlation coefficient ρ(x,y) is used to provide directionality to the association measure. The differential mutual Information I(x,y) is a function of the ratio of joint and marginal probabilities,
| (Equation 3) |
Estimating this quantity using the component profiles and the genomic features requires the empirical approximation of continuous probability density distributions using kernel density estimators (Sheather, 2004). Our implementation is based on the R packages MASS (Venables and Ripley, 2002), misc3d (Feng and Tierney, 2008), and bcv (Scott, 1997; Venables and Ripley, 2002). When y is a binary variable, e.g. a mutation of copy number alteration status, the mutual information between them becomes the Jensen-Shannon divergence between the two continuous target distributions indexed by the summary variable (Lin, 1991).
We selected top scoring features that match the profile of each component and based on those we propose a biological interpretation for each component. Examples of the results of this analysis are shown in Figures 4, 5, 6, S3, and S5, for components C3, C6, C7, C2, C4 and C5. A summary of the biological interpretation of all the components is shown in Table S3. The complete set of top scoring genomic features for each component is included in Supplemental Information.
Define Oncogenic States
As described in the main text the clustering of the selected subset of the Hk×m matrix samples and components is achieved by a Hierarchical Consensus Clustering algorithm (Monti et al., 2003) using as similarity metric the Information Coefficient (IC) described above between columns of the Hk×m matrix. The procedure is as follows:
Define Onco-GPS States
Standardize the rows of the Hk×m matrix. The standardized values above/below a threshold (3.25/−3.25) are set to that threshold to avoid extreme values.
Rescale the standardized-thresholded rows of the Hk×m matrix to the interval [0, 1].
Implement a consensus clustering procedure by bootstrap re-sampling of the columns of the Hk×m matrix and by clustering them using hierarchical clustering (Ward agglomeration method, R function hclust) (Hartigan, 1975). The pairwise distance between columns of the H-matrix is computed using one minus the Information Coefficient (IC).
Repeat the re-sampling 50 times for number-of-clusters/states values between a minimum and maximum (2 and 10 for the KRAS example) and generate a membership matrix for each of the number-of-clusters values.
Compute the cophenetic coefficient of the membership matrices and use it to choose an optimal value kS for the number of clusters/states (Monti et al., 2003).
Generate a final consensus clustering membership table for each of the number-of-clusters values.
Train a multi-class support vector machine (SVM) classifier using as inputs the component amplitudes to predict each of the states (clusters). This is implemented using the svm function (C-classification mode) from R package e1071 (Fan et al., 2005). This classifier will be useful to assign states to samples from independent test datasets.
When this procedure is applied in the case of the KRAS mutant cancers, using components C1–C7–C2, an optimal solution corresponding to kS = 4 clusters/states was chosen (S1–S4). The corresponding heatmap is shown in Figure 7C.
A similar annotation analysis as the one performed for the components is performed for the KRAS mutant S1–S4 states using the state membership as a putative phenotype. For example, in order to annotate component S1 we define a binary vector where the samples that belong to S1 are assigned 1’s and the rest are assigned 0’s. This target vector is used to estimate the degree of association of each state and the same collection of genomic features described in section 5.3 above. The complete set of top scoring genomic features for each of the 4 states (S1–S4) is included in Supplemental Information.
Generate Onco-GPS Map
The generation of the Onco-GPS map requires as input the subset of the Hk×m matrix and the state membership computed above, and consists of three main steps:
Generating the Onco-GPS layout.
Projecting samples onto of the Onco-GPS layout.
Generating the Onco-GPS contour lines and state-membership background colors.
We will describe each of those steps in detail. The layout is generated by defining component “nodes” on a ternary diagram as e.g. was done for the KRAS C1–C7–C2 components featured in Figure 6C. The procedure is as follows:
Generate Onco-GPS layout
- Compute and the location of each component node, ( ) with j = 1, 2, 3 (corresponding to C1, C2 and C7 in the KRAS example), as the vertices of an equilateral triangle (ternary diagram or Gibbs triangle),
(Equation 4) Plot a blue circle symbol and a text label representing the component node.
Plot straight lines connecting the component nodes.
Once the components layout is defined this way the samples are placed on the map according to their component amplitudes. The procedure is as follows:
Project Samples on Top of the Onco-GPS Layout
- Compute the location for each sample as a vectorial sum of the components’ locations ( ) weighted by the normalized component amplitudes raised to an exponent α,
(Equation 5) The exponent α provides a free parameter to tune the projection in such way that the samples are placed in appropriate locations, e.g., not too close or far away from the component nodes. This a global parameter that can be tuned for each problem.
Plot a circle symbol (and optional sample label) on the Onco-GPS using the corresponding color of the sample’s state (e.g. in Figure 6C: S1=purple, S2=blue, S3=red and S4=green).
This projection procedure is shown in Figure 1, panel III, for three representative samples. Once the layout, i.e., components nodes, of the Onco-GPS has been computed, and the samples have been placed on their corresponding locations as described above, it is useful to add an additional element to the Onco-GPS map: contour lines and color background to represent the states. These background colors and contours (S1=purple, S2=blue, S3=red and S4=green) can be seen at the bottom of Figure 6C. These graphical elements are computed following this procedure:
Generate Onco-GPS Contour Lines and Background Colors
Define a square lattice Lab, typically 200 x 200 or larger, on top of the Onco-GPS layout.
Use the state membership to subdivide samples into mutually exclusive state-groups and define a probability density on each lattice point for each of them using kernel density estimation (R function kde2d).
- Compute the winning state for each point in the lattice according to the largest state-group probability, and define a corresponding winning state probability ,
(Equation 6) Define contour lines and background colors using the winning state probability (R function contourLines) and plot them to form the background of the Onco-GPS map.
An independent test dataset can also be projected on top of the Onco-GPS by following the following procedure:
Project Independent test samples onto the Onco-GPS
Normalize the test dataset by replacing each gene expression value by its column rank.
- Obtain the component amplitudes for the test samples by projecting them onto the space of the NMF components (Hk×m matrix space) using the Moore-Penrose pseudo-inverse of the Wn×k matrix (Tamayo et al., 2007),
(Equation 7) Normalize the matrix by standardization, thresholding and rescaling in the same way as was done with the Hk×m when the Onco-GPS was first generated.
Compute the Onco-GPS location of the samples by using Equation 5 with instead of Hk×m
Use the svm classifier described above to provide predicted putative states to the test samples.
Plot the samples onto the Onco-GPS using colors corresponding to the predicted states.
This completes the description of the basic Onco-GPS used in the main text. In some cases one is interested in generating an Onco-GPS using all the NMF components or a subset of more than 3 component nodes. This can be accomplished using a generalization of the procedure outlined above using all the relevant components nodes. In order to generate this general Onco-GPS layout there is an additional component-projection step. Instead of using the equilateral triangle of Equation 4, location of the component nodes ( ) is obtained by a multidimensional scaling projection of the rows of the Hk×m matrix. This is necessary to be able to generate a layout that includes all the desired components, e.g., from kC down to 2-dimensional space. The component-projection procedure is as follows,
Generate General Onco-GPS layout
Compute the location of the component nodes ( ) by performing a multi-dimensional scaling projection of the H-matrix from kC to 2-dimensions. We implement this step using a Sammon map projection (function gx.2dproj from R package rgr). Other multidimensional scaling projection algorithms, such as PCA or tSNE, can also be used. Figure S1A shows the example of this projection for all the 9 KRAS components.
To facilitate the visualization of the component nodes in the general Onco-GPS we add lines connecting each of them with its neighbors on the layout. This is implemented using a Delaunay triangulation procedure on the components nodes 2D coordinates (R function delaunay from package spatstat). Figure S1B shows these resulting lines connecting the projected KRAS component nodes.
The projection of the samples on this general Onco-GPS layout can then proceed in the same way as described by Equation 5 but using all the component nodes in the vectorial sums. Figure S1C shows the resulting projection of the samples on top of the 9-node Onco-GPS.
The contours lines and color background are also generated as in the original ternary Onco-GPS described above. Figure S1D shows the final 9-component Onco-GPS and its corresponding 17 states (S1–S17) obtained when applying the procedure from section 5.4 using all the samples and all the components.
Applications of the Onco-GPS
Original or independent test samples that have been projected on top of the Onco-GPS map can be color coded to represent specific characteristics of molecular features. This can be simply done by using color maps that map e.g. discrete feature values onto distinct colors. Continuous values can be mapped to rainbow palettes as in show for example in Figures 6D–7E, S6, S7, S9, and S12–A15. In addition one can generate matching scores to assess the degree of association between the feature of interest and the state membership using box plots and Information Coefficients (IC) as shown in Figures 7B–C, S9, and S13B–S13D.
Inferential Models Based on the Onco-GPS
Besides representing primary characteristics of the samples, the Onco-GPS can also be used to develop inferential models based on specific component, states, relevant sample characteristics or a combination of all of them, in order to predict a quantity of interest. For example, in Figure S15 we show this application modality using the Onco-GPS BRAF example. We developed a probabilistic predictor of drug response based on the amplitude of two specific components and three complementary genomic features. The drug sensitivity target variable is defined were from the PLX-4720 BRAF inhibitor responses of the BRAF mutant samples in the CTRP v2 dataset (www.broadinstitute.org/ctrp, Seashore-Ludlow et al., 2015). In Figure S15A, we show the Onco-GPS for BRAF mutant samples where the samples are color-coded to represent their observed sensitivity to BRAF inhibition (blue=sensitive, red=resistance). We then define a sensitivity target binary variable equal to 1, if the sample is sensitivity and equal to 0 if it is resistant, using as threshold the mean sensitivity over all samples. We fit a Bayesian cumulative log odds model (Tamayo et al., 2011) (Mozina et al., 2004) to estimate the posterior probability of response conditional to the 3 model inputs,
x1: component amplitude of C6 (BRAF/MAPK),
x2: component amplitude of C7 (NFκB), and,
x3: combined mutation status of NRAS, EGFR and KRAS,
| (Equation 8) |
where d̄ = 1 − d and each term in the sum represents the amount of evidence that each variable provides to the model (Good, 1985). Each conditional probability is estimated using a single-variable logistic regression model. In this case these features were chosen based on prior knowledge of the MAPK-MITF/NFκB cell state distinction that influences sensitivity to MAPK pathway inhibitors (Konieczkowski et al., 2014). In other more general cases appropriate features for the model can be derived from other relevant prior knowledge and/or from a targeted feature selection process. The probabilistic model is then used to predict the samples in the same training set achieving a very significant model fit (Figure S15B, AUC ROC: 0.943 p-val: 8.17x10⁻⁹) indicating that those variables indeed have high information content with respect to BRAF inhibition sensitivity. The p-values associated with the area under the ROC values were computed using a Wilcoxon test as part of the functionality provided by the R package verification (release 1.2). We test the model in an independent dataset of BRAF mutants cell lines (Sanger dataset) (Yang et al., 2013). As there are some cell lines represented in both datasets we removed them from the training set before fitting the model. The inferential model is effective at predicting sensitivity to BRAF inhibition (SB590885) in this independent test dataset (Figure S15C, AUC ROC: 0.735, p-val: 0.00237). The model not only provides a prediction for each sample but it also produces a Bayesian nomogram that summarizes the amount of evidence that each variable contributes to the final prediction (Figure S15D). This demonstrates that the Onco-GPS provides a suitable framework for implementing high-level probabilistic or graphical inferential models or networks that can be used to predict functional characteristics, such as drug response.
Onco-GPS States and the Statistical Dependence between Gene Expression and Drug Response
The strong correlation between component C1/state S4 activity and sensitivity to drugs lapatnib and PD-0325901 suggests that oncogenic states can be effective latent variables that mediate the statistical dependence, e.g., between gene expression and functional cellular phenotypes such as drug response. To investigate this possibility we identified 50 genes and 50 drugs relevant to KRAS mutant cancers, and verified whether the Onco-GPS state membership labels could mediate the statistical dependency between those two sets of features. We define X = {x1,x2,x3,…,x50}, a collection of random variables corresponding to the set of 50 representative gene expression profiles, and Y = {y1,y2,y3,…,y50}, a collection of random variables corresponding to the representative 50 profiles of drug response, and z a random variable representing Onco-GPS state membership labels (S1–S4). Variable z can completely capture the statistical dependence between X and Y if these are conditionally independent given z. However, since X and Y are continuous random variables and z is a discrete random variable, canonical models depicting conditional independence, such as Bayesian networks or Markov random fields, would have an overly complex structure. Instead, we quantified the level of conditional independence with a normalized conditional mutual information score (NCMI),
| (Equation 9) |
where the numerator is the mutual information between a (gene expression, drug response) pair conditioned on the oncogenic state label z, and the denominator is the mutual information between the same pair without conditioning. NCMI(xi; yj|z) = N if xi and yi are conditionally independent given z. Generally a small NCMI(xi; yj|z) indicates a strong capability of the Onco-GPS states to mediate the dependency between gene expression and drug response.
We selected gene expression-drug response pairs whose mutual information is equal or greater than 0.05 and calculated the distribution of their NCMI scores. To assess its statistical significance, we randomly permuted the Onco-GPS state membership labels 1,000 times, calculated the NCMI score distribution for each random trial, and compared the empirical NCMI score distribution with the top-ranking NCMI score distributions from the randomly-permuted data. Figure S16 shows the NCMI score distributions of observed and permuted data for the 4-state KRAS Onco-GPS data. The observed NCMI score distribution is within 1% of the corresponding distribution for permuted data, in terms of their capacity to explain the dependency between gene expression and drug response. This suggests that the 4 Onco-GPS states (S1–S4) effectively mediate a significant fraction of the statistical dependence between gene expression and drug response for KRAS mutant samples. This suggest that a coarse-grained network, generated using the components as latent variables or “master hubs,” can be used to model the most salient relationships between genomic variables, clinical and biological phenotypes etc. We will explore this possibility in a future publication.
DATA AND SOFTWARE AVAILABILITY
Raw data files for RNA sequencing for KRAS signatures have been deposited to NCBI Gene Expression Omnibus accession number GSE94937. Raw data files for RNA sequencing for CRISPR-Cas9 Experiments have been deposited to NCBI Gene Expression Omnibus accession number GSE84706. The different analysis steps of the Onco-GPS method will be made available as a collection of Jupyter notebooks available at ccal.ucsd.edu (https://github.com/UCSD-CCAL/onco-gps-paper-analysis).
Supplementary Material
Highlights.
Functional oncogene activation can be broken down into several distinct programs
Onco-GPS is a discovery tool to identify genomic features, i.e., drug responses
Onco-GPS map is a visualization tool to depict cancers, cell states, and transitions
Acknowledgments
This project was supported by NIH grants R01CA154480, R01CA121941, R01CA109467, R01CA130988, U01CA176058, U01CA199253, U24CA194107, and U01HG008699. We would like to thank Dr. Stuart Schreiber and his group for sharing the CTRP dataset and for discussions; and the Broad Institute’s CCLE, Achilles, and TCGA project team members for assistance and useful recommendations.
Footnotes
Supplemental Information includes 17 figures and 8 tables and can be found with this article online at http://dx.doi.org/10.1016/j.cels.2017.08.002.
AUTHOR CONTRIBUTIONS
J.W.K., R.W.J., D.A.B., J.S.B., W.C.H., J.P.M., and P.T. designed and conceptualized the method. J.W.K., O.O.A., J.L., C.H.Y., and P.T. implemented the algorithm. J.W.K., O.O.A., J.L., E.D., M.S., and J.D. executed the experiments. J.W.K., O.O.A., J.L., E.D., M.S., J.S.B., W.C.H., J.P.M., and P.T. analyzed and interpreted results. E.M.V., O.C., J.M., M.G., A.L., B.A.W., G.A., A.T., A.S., P.C., J.P.M., and P.T. provided expertise or work on algorithmic approaches and data analysis. J.D., S.K., D.J.K., M.G., D.T., P.C., F.V., B.A.W., A.J.A., and L.A.G. provided work on data preparation and data resources, validation datasets, T.C., H.Y., K.M.-E., S.T., and C.M. provided work on programming, development, and documentation of the Jupyter notebooks. J.W.K., W.C.H., J.P.M., and P.T wrote the manuscript.
References
- Aigner K, Dampier B, Descovich L, Mikula M, Sultan A, Schreiber M, Mikulits W, Brabletz T, Strand D, Obrist P, et al. The transcription factor ZEB1 (deltaEF1) promotes tumour cell dedifferentiation by repressing master regulators of epithelial polarity. Oncogene. 2007;26:6979–6988. doi: 10.1038/sj.onc.1210508. [DOI] [PMC free article] [PubMed] [Google Scholar]
- Barbie DA, Tamayo P, Boehm JS, Kim SY, Moody SE, Dunn IF, Schinzel AC, Sandy P, Meylan E, Scholl C, et al. Systematic RNA interference reveals that oncogenic KRAS-driven cancers require TBK1. Nature. 2009;462:108–112. doi: 10.1038/nature08460. [DOI] [PMC free article] [PubMed] [Google Scholar]
- Barbie TU, Alexe G, Aref AR, Li S, Zhu Z, Zhang X, Imamura Y, Thai TC, Huang Y, Bowden M, et al. Targeting an IKBKE cytokine network impairs triple-negative breast cancer growth. J Clin Invest. 2014;124:5411–5423. doi: 10.1172/JCI75661. [DOI] [PMC free article] [PubMed] [Google Scholar]
- Barretina J, Caponigro G, Stransky N, Venkatesan K, Margolin AA, Kim S, Wilson CJ, Lehar J, Kryukov GV, Sonkin D, et al. The Cancer Cell Line Encyclopedia enables predictive modelling of anticancer drug sensitivity. Nature. 2012;483:603–607. doi: 10.1038/nature11003. [DOI] [PMC free article] [PubMed] [Google Scholar]
- Bild AH, Yao G, Chang JT, Wang Q, Potti A, Chasse D, Joshi MB, Harpole D, Lancaster JM, Berchuck A, et al. Oncogenic pathway signatures in human cancers as a guide to targeted therapies. Nature. 2006;439:353–357. doi: 10.1038/nature04296. [DOI] [PubMed] [Google Scholar]
- Brunet JP, Tamayo P, Golub TR, Mesirov JP. Metagenes and molecular pattern discovery using matrix factorization. Proc Natl Acad Sci USA. 2004;101:4164–4169. doi: 10.1073/pnas.0308531101. [DOI] [PMC free article] [PubMed] [Google Scholar]
- Chamorro MN, Schwartz DR, Vonica A, Brivanlou AH, Cho KR, Varmus HE. FGF-20 and DKK1 are transcriptional targets of beta-catenin and FGF-20 is implicated in cancer and development. EMBO J. 2005;24:73–84. doi: 10.1038/sj.emboj.7600460. [DOI] [PMC free article] [PubMed] [Google Scholar]
- Chang JT, Carvalho C, Mori S, Bild AH, Gatza ML, Wang Q, Lucas JE, Potti A, Febbo PG, West M, et al. A genomic strategy to elucidate modules of oncogenic pathway signaling networks. Mol Cell. 2009;34:104–114. doi: 10.1016/j.molcel.2009.02.030. [DOI] [PMC free article] [PubMed] [Google Scholar]
- Cheung HW, Cowley GS, Weir BA, Boehm JS, Rusin S, Scott JA, East A, Ali LD, Lizotte PH, Wong TC, et al. Systematic investigation of genetic vulnerabilities across cancer cell lines reveals lineage-specific dependencies in ovarian cancer. Proc Natl Acad Sci USA. 2011;108:12372–12377. doi: 10.1073/pnas.1109363108. [DOI] [PMC free article] [PubMed] [Google Scholar]
- Cichocki A, Zdunek R, Amari S. Nonnegative Matrix and Tensor Factorization. IEEE Signal Processing Magazine; 2008. pp. 142–145. [Google Scholar]
- Cowley GS, Weir BA, Vazquez F, Tamayo P, Scott JA, Rusin S, East-Seletsky A, Ali LD, Gerath WF, Pantel SE, et al. Parallel genome-scale loss of function screens in 216 cancer cell lines for the identification of context-specific genetic dependencies. Sci Data. 2014;1:140035. doi: 10.1038/sdata.2014.35. [DOI] [PMC free article] [PubMed] [Google Scholar]
- Dawson MA, Kouzarides T. Cancer epigenetics: from mechanism to therapy. Cell. 2012;150:12–27. doi: 10.1016/j.cell.2012.06.013. [DOI] [PubMed] [Google Scholar]
- De Raedt T, Beert E, Pasmant E, Luscan A, Brems H, Ortonne N, Helin K, Hornick JL, Mautner V, Kehrer-Sawatzki H, et al. PRC2 loss amplifies Ras-driven transcription and confers sensitivity to BRD4-based therapies. Nature. 2014;514:247–251. doi: 10.1038/nature13561. [DOI] [PubMed] [Google Scholar]
- Downward J. RAS synthetic lethal screens revisited: still seeking the elusive prize? Clin. Cancer Res. 2015;21:1802–1809. doi: 10.1158/1078-0432.CCR-14-2180. [DOI] [PMC free article] [PubMed] [Google Scholar]
- Elenbaas B, Spirio L, Koerner F, Fleming MD, Zimonjic DB, Donaher JL, Popescu NC, Hahn WC, Weinberg RA. Human breast cancer cells generated by oncogenic transformation of primary mammary epithelial cells. Genes Dev. 2001;15:50–65. doi: 10.1101/gad.828901. [DOI] [PMC free article] [PubMed] [Google Scholar]
- Fan RE, Chen PH, Lin CJ. Working set selection using second order information for training support vector machines. J Mach Learn Res. 2005;6:1889–1918. [Google Scholar]
- Feng D, Tierney L. Computing and displaying isosurfaces in R. J Stat Softw. 2008;28:1–24. [Google Scholar]
- Flaherty KT, Puzanov I, Kim KB, Ribas A, McArthur GA, Sosman JA, O’Dwyer PJ, Lee RJ, Grippo JF, Nolop K, et al. Inhibition of mutated, activated BRAF in metastatic melanoma. N Engl J Med. 2010;363:809–819. doi: 10.1056/NEJMoa1002011. [DOI] [PMC free article] [PubMed] [Google Scholar]
- Fultz B. Phase Transitions in Materials. Cambridge University Press; 2014. [Google Scholar]
- Garnett MJ, Edelman EJ, Heidorn SJ, Greenman CD, Dastur A, Lau KW, Greninger P, Thompson IR, Luo X, Soares J, et al. Systematic identification of genomic markers of drug sensitivity in cancer cells. Nature. 2012;483:570–575. doi: 10.1038/nature11005. [DOI] [PMC free article] [PubMed] [Google Scholar]
- Garraway LA, Lander ES. Lessons from the cancer genome. Cell. 2013;153:17–37. doi: 10.1016/j.cell.2013.03.002. [DOI] [PubMed] [Google Scholar]
- Good IJ. Weight of evidence: a brief survey. Bayesian Stat. 1985;2:249–270. [Google Scholar]
- Groger CJ, Grubinger M, Waldhor T, Vierlinger K, Mikulits W. Meta-analysis of gene expression signatures defining the epithelial to mesenchymal transition during cancer progression. PLoS One. 2012;7:e51136. doi: 10.1371/journal.pone.0051136. [DOI] [PMC free article] [PubMed] [Google Scholar]
- Hartigan JA. Clustering algorithms. In: Bradley RA, Kendall DG, Hunter JS, Watson GS, editors. Information Retrieval: Data Structures and Algorithms. Vol. 2. John Wiley & Sons; 1975. pp. 419–442. [Google Scholar]
- Hinata K, Gervin AM, Jennifer Zhang Y, Khavari PA. Divergent gene regulation and growth effects by NF-kappa B in epithelial and mesenchymal cells of human skin. Oncogene. 2003;22:1955–1964. doi: 10.1038/sj.onc.1206198. [DOI] [PubMed] [Google Scholar]
- Hoadley KA, Yau C, Wolf DM, Cherniack AD, Tamborero D, Ng S, Leiserson MD, Niu B, McLellan MD, Uzunangelov V, et al. Multiplatform analysis of 12 cancer types reveals molecular classification within and across tissues of origin. Cell. 2014;158:929–944. doi: 10.1016/j.cell.2014.06.049. [DOI] [PMC free article] [PubMed] [Google Scholar]
- Hofmann-Wellenhof B, Lichtenegger H, Wasle E. GNSS – Global Navigation Satellite Systems – GPS, GLONASS, Galileo, etc. 2007. [Google Scholar]
- Hopewell EL, Zhao W, Fulp WJ, Bronk CC, Lopez AS, Massengill M, Antonia S, Celis E, Haura EB, Enkemann SA, et al. Lung tumor NF-kappaB signaling promotes T cell-mediated immune surveillance. J Clin Invest. 2013;123:2509–2522. doi: 10.1172/JCI67250. [DOI] [PMC free article] [PubMed] [Google Scholar]
- Hyman DM, Puzanov I, Subbiah V, Faris JE, Chau I, Blay JY, Wolf J, Raje NS, Diamond EL, Hollebecque A, et al. Vemurafenib in multiple nonmelanoma cancers with BRAF V600 mutations. N Engl J Med. 2015;373:726–736. doi: 10.1056/NEJMoa1502309. [DOI] [PMC free article] [PubMed] [Google Scholar]
- Jané-Valbuena J, Widlund HR, Perner S, Johnson LA, Dibner AC, Lin WM, Baker AC, Nazarian RM, Vijayendran KG, Sellers WR, et al. An oncogenic role for ETV1 in melanoma. Cancer Res. 2010;70:2075–2084. doi: 10.1158/0008-5472.CAN-09-3092. [DOI] [PMC free article] [PubMed] [Google Scholar]
- Joe H. Relative entropy measures of multivariate dependence. J Am Stat Assoc. 1989;84:157–164. [Google Scholar]
- Kim JW, Botvinnik OB, Abudayyeh O, Birger C, Rosenbluh J, Shrestha Y, Abazeed ME, Hammerman PS, DiCara D, Konieczkowski DJ, et al. Characterizing genomic alterations in cancer by complementary functional associations. Nat Biotechnol. 2016;34:539–546. doi: 10.1038/nbt.3527. [DOI] [PMC free article] [PubMed] [Google Scholar]
- Kirzin S, Marisa L, Guimbaud R, De Reynies A, Legrain M, Laurent-Puig P, Cordelier P, Pradere B, Bonnet D, Meggetto F, et al. Sporadic early-onset colorectal cancer is a specific sub-type of cancer: a morphological, molecular and genetics study. PLoS One. 2014;9:e103159. doi: 10.1371/journal.pone.0103159. [DOI] [PMC free article] [PubMed] [Google Scholar]
- Konieczkowski DJ, Johannessen CM, Abudayyeh O, Kim JW, Cooper ZA, Piris A, Frederick DT, Barzily-Rokni M, Straussman R, Haq R, et al. A melanoma cell state distinction influences sensitivity to MAPK pathway inhibitors. Cancer Discov. 2014;4:816–827. doi: 10.1158/2159-8290.CD-13-0424. [DOI] [PMC free article] [PubMed] [Google Scholar]
- Kwak EL, Bang YJ, Camidge DR, Shaw AT, Solomon B, Maki RG, Ou SH, Dezube BJ, Janne PA, Costa DB, et al. Anaplastic lymphoma kinase inhibition in non-small-cell lung cancer. N Engl J Med. 2010;363:1693–1703. doi: 10.1056/NEJMoa1006448. [DOI] [PMC free article] [PubMed] [Google Scholar]
- Liberzon A, Birger C, Thorvaldsdottir H, Ghandi M, Mesirov JP, Tamayo P. The Molecular Signatures Database (MSigDB) hallmark gene set collection. Cell Syst. 2015;1:417–425. doi: 10.1016/j.cels.2015.12.004. [DOI] [PMC free article] [PubMed] [Google Scholar]
- Liberzon A, Subramanian A, Pinchback R, Thorvaldsdottir H, Tamayo P, Mesirov JP. Molecular Signatures Database (MSigDB) 3.0. Bioinformatics. 2011;27:1739–1740. doi: 10.1093/bioinformatics/btr260. [DOI] [PMC free article] [PubMed] [Google Scholar]
- Lin J. Divergence measures based on the Shannon entropy. IEEE Trans Inform Theor. 1991;37:145–151. [Google Scholar]
- Linfoot EH. An informational measure of correlation. Inf Control. 1957;1:85–89. [Google Scholar]
- Lundberg AS, Randell SH, Stewart SA, Elenbaas B, Hartwell KA, Brooks MW, Fleming MD, Olsen JC, Miller SW, Weinberg RA, et al. Immortalization and transformation of primary human airway epithelial cells by gene transfer. Oncogene. 2002;21:4577–4586. doi: 10.1038/sj.onc.1205550. [DOI] [PubMed] [Google Scholar]
- Lynch TJ, Bell DW, Sordella R, Gurubhagavatula S, Okimoto RA, Brannigan BW, Harris PL, Haserlat SM, Supko JG, Haluska FG, et al. Activating mutations in the epidermal growth factor receptor underlying responsiveness of non-small-cell lung cancer to gefitinib. N Engl J Med. 2004;350:2129–2139. doi: 10.1056/NEJMoa040938. [DOI] [PubMed] [Google Scholar]
- Manchado E, Weissmueller S, Morris JP, 4th, Chen CC, Wullenkord R, Lujambio A, de Stanchina E, Poirier JT, Gainor JF, Corcoran RB, et al. A combinatorial strategy for treating KRAS-mutant lung cancer. Nature. 2016;534:647–651. doi: 10.1038/nature18600. [DOI] [PMC free article] [PubMed] [Google Scholar]
- McKenna A, Hanna M, Banks E, Sivachenko A, Cibulskis K, Kernytsky A, Garimella K, Altshuler D, Gabriel S, Daly M, et al. The Genome Analysis Toolkit: a MapReduce framework for analyzing next-generation DNA sequencing data. Genome Res. 2010;20:1297–1303. doi: 10.1101/gr.107524.110. [DOI] [PMC free article] [PubMed] [Google Scholar]
- Monti S, Tamayo P, Mesirov J, Golub TR. Consensus clustering: a resampling-based method for class discovery and visualization of gene expression microarray data. Machine Learn. 2003;52:91–118. [Google Scholar]
- Mozina M, Demšar J, Kattan M, Zutan B. Nomograms for visualization of naive Bayesian classifier. Lect Notes Comput Sci. 2004;3202:337–348. [Google Scholar]
- Peck D, Crawford ED, Ross KN, Stegmaier K, Golub TR, Lamb J. A method for high-throughput gene expression signature analysis. Genome Biol. 2006;7:R61. doi: 10.1186/gb-2006-7-7-r61. [DOI] [PMC free article] [PubMed] [Google Scholar]
- Pott S, Lieb JD. What are super-enhancers? Nat. Genet. 2015;47:8–12. doi: 10.1038/ng.3167. [DOI] [PubMed] [Google Scholar]
- Prahallad A, Sun C, Huang S, Di Nicolantonio F, Salazar R, Zecchin D, Beijersbergen RL, Bardelli A, Bernards R. Unresponsiveness of colon cancer to BRAF(V600E) inhibition through feedback activation of EGFR. Nature. 2012;483:100–103. doi: 10.1038/nature10868. [DOI] [PubMed] [Google Scholar]
- Pratilas CA, Taylor BS, Ye Q, Viale A, Sander C, Solit DB, Rosen N. (V600E)BRAF is associated with disabled feedback inhibition of RAF-MEK signaling and elevated transcriptional output of the pathway. Proc Natl Acad Sci USA. 2009;106:4519–4524. doi: 10.1073/pnas.0900780106. [DOI] [PMC free article] [PubMed] [Google Scholar]
- Salt MB, Bandyopadhyay S, McCormick F. Epithelial-to-mesenchymal transition rewires the molecular path to PI3K-dependent proliferation. Cancer Discov. 2014;4:186–199. doi: 10.1158/2159-8290.CD-13-0520. [DOI] [PubMed] [Google Scholar]
- Scott DW. Mortality. Rice University; 1997. Multivariate Density Estimation; pp. 1–11. [Google Scholar]
- Seashore-Ludlow B, Rees MG, Cheah JH, Cokol M, Price EV, Coletti ME, Jones V, Bodycombe NE, Soule CK, Gould J, et al. Harnessing connectivity in a large-scale small-molecule sensitivity dataset. Cancer Discov. 2015;5:1210–1223. doi: 10.1158/2159-8290.CD-15-0235. [DOI] [PMC free article] [PubMed] [Google Scholar]
- Seo JS, Ju YS, Lee WC, Shin JY, Lee JK, Bleazard T, Lee J, Jung YJ, Kim JO, Shin JY, et al. The transcriptional landscape and mutational profile of lung adenocarcinoma. Genome Res. 2012;22:2109–2119. doi: 10.1101/gr.145144.112. [DOI] [PMC free article] [PubMed] [Google Scholar]
- Serresi M, Gargiulo G, Proost N, Siteur B, Cesaroni M, Koppens M, Xie H, Sutherland KD, Hulsman D, Citterio E, et al. Polycomb repressive complex 2 is a barrier to KRAS-driven inflammation and epithelial-mesenchymal transition in non-small-cell lung cancer. Cancer Cell. 2016;29:17–31. doi: 10.1016/j.ccell.2015.12.006. [DOI] [PubMed] [Google Scholar]
- Sethna JP. Complexity. Oxford University Press; 2011. Entropy, Order Parameters and Complexity; p. 376. [Google Scholar]
- Shao DD, Xue W, Krall EB, Bhutkar A, Piccioni F, Wang X, Schinzel AC, Sood S, Rosenbluh J, Kim JW, et al. KRAS and YAP1 converge to regulate EMT and tumor survival. Cell. 2014;158:171–184. doi: 10.1016/j.cell.2014.06.004. [DOI] [PMC free article] [PubMed] [Google Scholar]
- Sheather SJ. Density estimation. Stat Sci. 2004;19:588–597. [Google Scholar]
- Singh A, Greninger P, Rhodes D, Koopman L, Violette S, Bardeesy N, Settleman J. A gene expression signature associated with “K-Ras addiction” reveals regulators of EMT and tumor cell survival. Cancer Cell. 2009;15:489–500. doi: 10.1016/j.ccr.2009.03.022. [DOI] [PMC free article] [PubMed] [Google Scholar]
- Singh A, Sweeney MF, Yu M, Burger A, Greninger P, Benes C, Haber DA, Settleman J. TAK1 inhibition promotes apoptosis in KRAS-dependent colon cancers. Cell. 2012;148:639–650. doi: 10.1016/j.cell.2011.12.033. [DOI] [PMC free article] [PubMed] [Google Scholar]
- Skoulidis F, Byers LA, Diao L, Papadimitrakopoulou VA, Tong P, Izzo J, Behrens C, Kadara H, Parra ER, Canales JR, et al. Co-occurring genomic alterations define major subsets of KRAS-mutant lung adenocarcinoma with distinct biology, immune profiles, and therapeutic vulnerabilities. Cancer Discov. 2015;5:860–877. doi: 10.1158/2159-8290.CD-14-1236. [DOI] [PMC free article] [PubMed] [Google Scholar]
- Sun C, Hobor S, Bertotti A, Zecchin D, Huang S, Galimi F, Cottino F, Prahallad A, Grernrum W, Tzani A, et al. Intrinsic resistance to MEK inhibition in KRAS mutant lung and colon cancer through transcriptional induction of ERBB3. Cell Rep. 2014;7:86–93. doi: 10.1016/j.celrep.2014.02.045. [DOI] [PubMed] [Google Scholar]
- Tamayo P, Cho YJ, Tsherniak A, Greulich H, Ambrogio L, Schouten-van Meeteren N, Zhou T, Buxton A, Kool M, Meyerson M, et al. Predicting relapse in patients with medulloblastoma by integrating evidence from clinical and genomic features. J Clin Oncol. 2011;29:1415–1423. doi: 10.1200/JCO.2010.28.1675. [DOI] [PMC free article] [PubMed] [Google Scholar]
- Tamayo P, Scanfeld D, Ebert BL, Gillette MA, Roberts CW, Mesirov JP. Metagene projection for cross-platform, cross-species characterization of global transcriptional states. Proc Natl Acad Sci USA. 2007;104:5959–5964. doi: 10.1073/pnas.0701068104. [DOI] [PMC free article] [PubMed] [Google Scholar]
- Taube JH, Herschkowitz JI, Komurov K, Zhou AY, Gupta S, Yang J, Hartwell K, Onder TT, Gupta PB, Evans KW, et al. Core epithelial-to-mesenchymal transition interactome gene-expression signature is associated with claudin-low and metaplastic breast cancer subtypes. Proc Natl Acad Sci USA. 2010;107:15449–15454. doi: 10.1073/pnas.1004900107. [DOI] [PMC free article] [PubMed] [Google Scholar]
- Tirosh I, Izar B, Prakadan SM, Wadsworth MH, 2nd, Treacy D, Trombetta JJ, Rotem A, Rodman C, Lian C, Murphy G, et al. Dissecting the multicellular ecosystem of metastatic melanoma by single-cell RNA-seq. Science. 2016;352:189–196. doi: 10.1126/science.aad0501. [DOI] [PMC free article] [PubMed] [Google Scholar]
- Torres-García W, Zheng S, Sivachenko A, Vegesna R, Wang Q, Yao R, Berger MF, Weinstein JN, Getz G, Verhaak RG. PRADA: pipeline for RNA sequencing data analysis. Bioinformatics. 2014;30:2224–2226. doi: 10.1093/bioinformatics/btu169. [DOI] [PMC free article] [PubMed] [Google Scholar]
- Venables WN, Ripley BD. Issues of Accuracy and Scale. Springer; 2002. Modern Applied Statistics with S; p. 868. [Google Scholar]
- Wood KC, Konieczkowski DJ, Johannessen CM, Boehm JS, Tamayo P, Botvinnik OB, Mesirov JP, Hahn WC, Root DE, Garraway LA, et al. MicroSCALE screening reveals genetic modifiers of therapeutic response in melanoma. Sci Signal. 2012;5:rs4. doi: 10.1126/scisignal.2002612. [DOI] [PMC free article] [PubMed] [Google Scholar]
- Yang W, Soares J, Greninger P, Edelman EJ, Lightfoot H, Forbes S, Bindal N, Beare D, Smith JA, Thompson IR, et al. Genomics of drug sensitivity in cancer (GDSC): a resource for therapeutic biomarker discovery in cancer cells. Nucleic Acids Res. 2013;41(Database issue):D955–D961. doi: 10.1093/nar/gks1111. [DOI] [PMC free article] [PubMed] [Google Scholar]
- Ying H, Kimmelman AC, Lyssiotis CA, Hua S, Chu GC, Fletcher-Sananikone E, Locasale JW, Son J, Zhang H, Coloff JL, et al. Oncogenic Kras maintains pancreatic tumors through regulation of anabolic glucose metabolism. Cell. 2012;149:656–670. doi: 10.1016/j.cell.2012.01.058. [DOI] [PMC free article] [PubMed] [Google Scholar]
- Zhu Z, Aref AR, Cohoon TJ, Barbie TU, Imamura Y, Yang S, Moody SE, Shen RR, Schinzel AC, Thai TC, et al. Inhibition of KRAS-driven tumorigenicity by interruption of an autocrine cytokine circuit. Cancer Discov. 2014;4:452–465. doi: 10.1158/2159-8290.CD-13-0646. [DOI] [PMC free article] [PubMed] [Google Scholar]
Associated Data
This section collects any data citations, data availability statements, or supplementary materials included in this article.