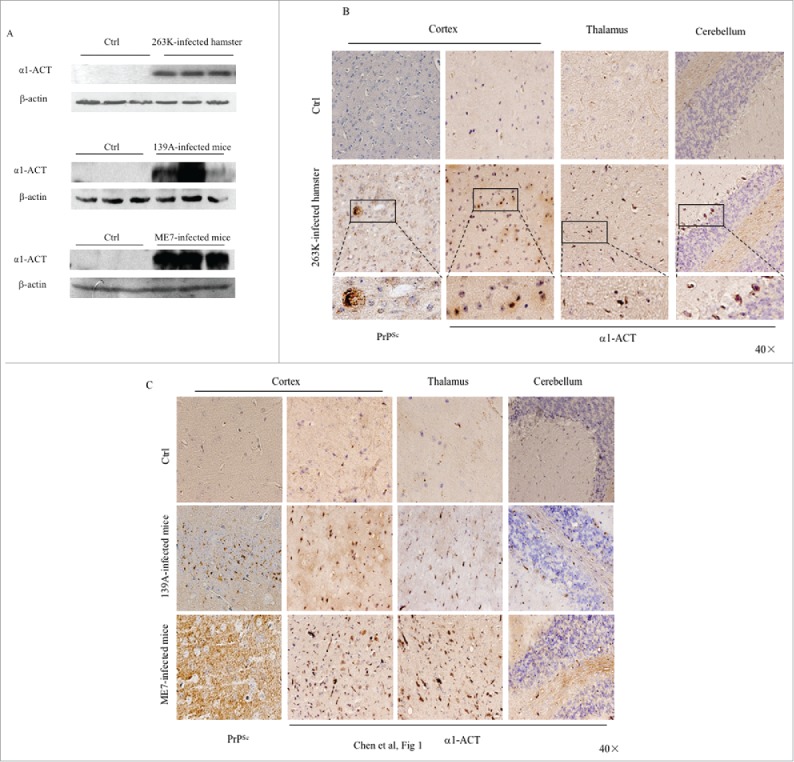
FIGURE 1.

Comparative analyses of the levels of α1-ACT in the brains of the scrapie-infected rodent models. a Western blots of the brain homogenates of various scrapie-infected rodent models at the terminal stage and the individual age-matched normal ones. Each group contains three individual animals. The scrapie strains are indicated on the top of each graph and the quantitative assays of the various blots normalized with the data of β-actin are indicated on the left. b Representative IHC assays of α1-ACT in the sections of various brain regions of 263K-infected hamsters at terminal stage, including the cortex, thalamus and cerebellum (presenting on the top side). The relevant brain sections of normal hamsters are used as control (40 ×). The magnified images are shown under each picture. c Representative IHC analyses of α1-ACT in the sections of various brain regions of 139A-infected (upper panel) and ME7-infected (lower panel) mice at terminal stage (40 ×).
