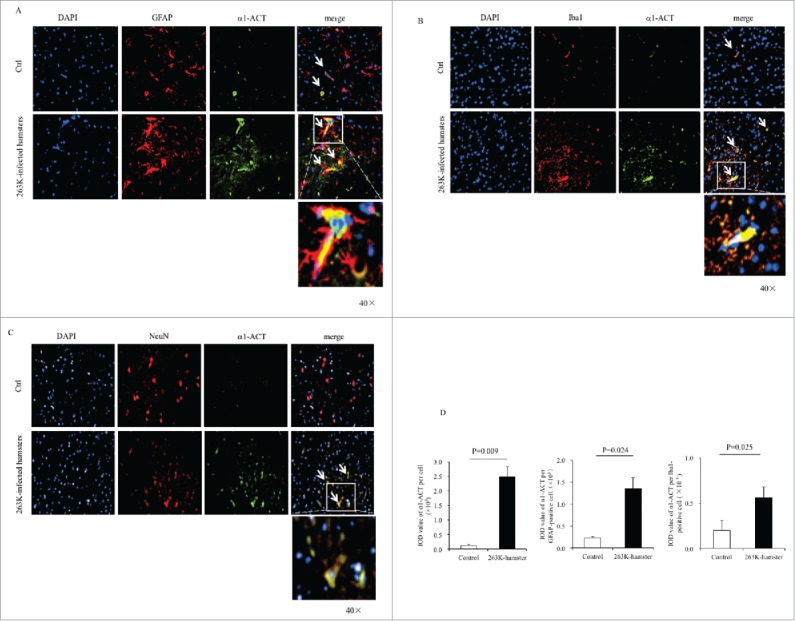
FIGURE 3.

Immunofluorescent analyses of the relationships of α1-ACT with various sorts of cells in the brains of 263K-infected hamsters at the end of disease and the age-matched normal hamsters as control. a-c Representative images of the hamsters' brains double-immunostained with the antibodies of α1-ACT (green) and GFAP, (red) (a), Iba1 (red) (b), or NeuN (red) (c) (100 ×). The zoomed-in pictures are shown on the bottom. d Analyses of the IOD values with the software in Operatta. The average IOD values of α1-ACT per cell (× 105) (left panel), per GFAP-positive cell (× 105) (middle panel) as well as per Iba1-positive cell (× 105) (right panel). Statistical differences between infected and normal animals are indicated above.
