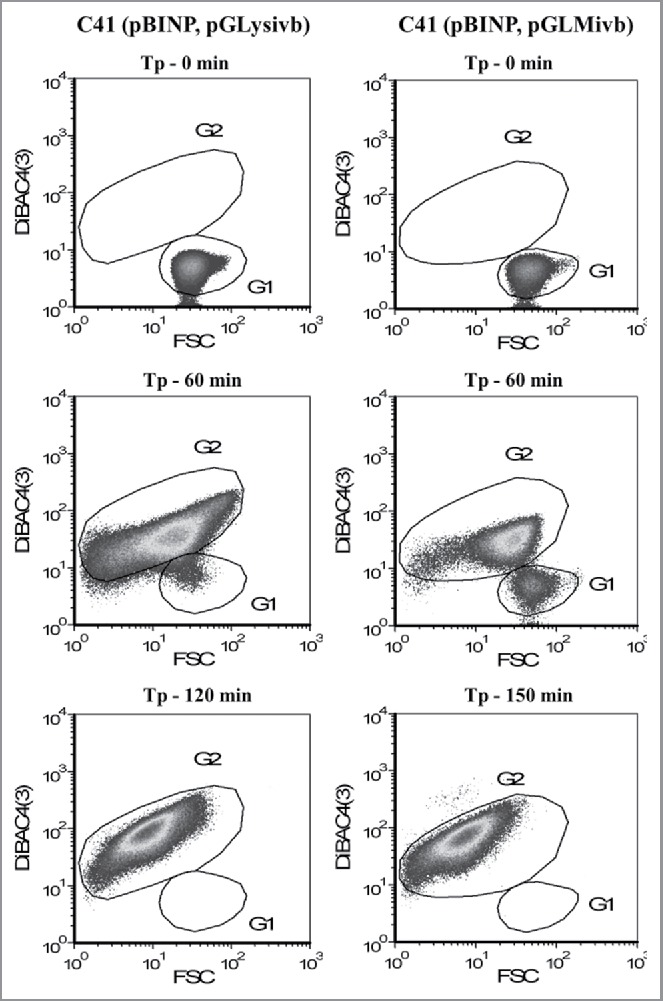
Figure 4.

Flow cytometry density dot plots showing E-lysis process of E. coli C41 (pBINP, pGLysivb) and E. coli C41 (pBINP, pGLMivb) strains. Illustrated populations are discriminated from non-cellular background via Rh414 staining. Dot plots illustrate fluorescence intensity with Dibac4(3) vs. FSC–forward scatter; G1: living cells, G2: BGs. Tp - 0 min: indicates time point of lysis induction; Tp - 60 min: 60 min after lysis induction; Tp - 120 min: end of lysis phase for E. coli C41 (pBINP, pGLysivb); Tp - 150 min: end of lysis phase for E. coli C41 (pBINP, pGLMivb).
