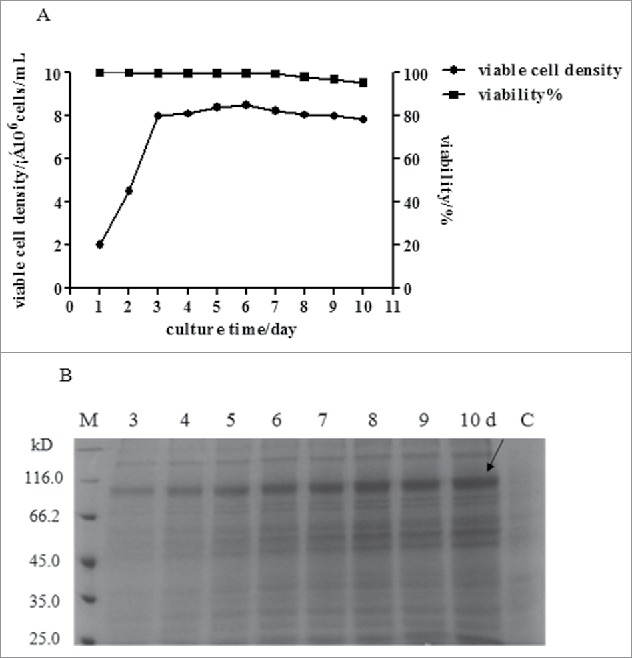
Figure 3.

Cell growth and HSA-eTGFBR2 expression of in serum-free suspension fed-batch culture. (A) The growth curve of CHO cells in serum-free suspension fed batch culture; (B) The SDS-PAGE analysis of recombinant protein in fed batch culture, C: fed-batch culture of non-transferred CHO cells.
