

Abstract
Rationale
People with CF treated with IV antibiotics for a pulmonary exacerbation (PEx) frequently fail to recover to baseline FEV1. The long-term impact of these events has not been studied.
Objectives
To determine if a patient’s spirometric recovery after a PEx is associated with time to next PEx within 1 year, the spirometric recovery after the next PEx, and/or the number of PEx episodes in the next 3 years.
Methods
We used data from the CF Foundation Patient Registry from 2004–2011. We randomly selected one PEx per patient that met inclusion/exclusion criteria. Patients were defined as Non-Responders if their best FEV1 (in liters) recorded in the 3 months after the PEx was <90% of the best FEV1 (in liters) in the 6 months before the PEx. We compared Responders and Non-Responders using multivariable regression models.
Results
We randomly chose 13,954 PEx episodes that met inclusion/exclusion criteria. 2,762 (19.8%) patients were classified as Non-Responders. Non-Responders had a shorter median time to the next PEx, 235 (95% CI 218, 252) days, versus >365 days for Responders. Thirty-four percent of Non-Responders at the initial PEx were also Non-Reponders at the next PEx, versus 20% of Responders at the initial PEx. Non-Responders had more PEx episodes over the next 3 years, 4.99 (95% CI 4.84, 5.13), than Responders, 3.46 (95% CI 3.41, 3.51).
Conclusions
Poor recovery after a PEx is associated with a shorter time to the next PEx, increased risk of poor recovery at a second PEx, and more frequent subsequent PEx treatments.
Keywords: FEV1, risk factors, modeling
INTRODUCTION
People with cystic fibrosis (CF) experience periodic pulmonary exacerbations (PEx) that are characterized by worsening signs and symptoms of respiratory and overall health.1 PEx episodes treated with IV antibiotics are associated with worsening lung function, poorer quality of life, increased healthcare costs, and mortality.2–5 Several studies have demonstrated that recovery to spirometric baseline does not occur for a substantial proportion of patients following treatment with IV antibiotics for a PEx.6–10
This change in baseline lung function may be associated with further adverse outcomes, as patients with lower lung function have higher rates of PEx treatments, lower quality of life, and increased risk of death.2,11,12 A previous analysis found that 58% of patients who initially had poor spirometric recovery, defined as the best forced expiratory volume in 1 second (FEV1) % predicted in the 3 months after a PEx that was less than 90% of the best FEV1 % predicted in the 6 months before the PEx, did not recover to the pre-exacerbation baseline in the 12 months after the PEx.7 In addition, patients treated with one or more courses of IV antibiotics for a PEx are at-risk for a shorter time to the next PEx,13 although it is unknown if the lack of spirometric recovery after a PEx is associated with further shortening of the time to the next PEx. Understanding this relationship is important in identifying patients most at-risk for future PEx treatments and their associated adverse outcomes.
We hypothesized that poor spirometric recovery after a PEx treated with IV antibiotics would be associated with a shorter time to the next PEx. We also tested whether patients with poor spirometric recovery at the initial PEx were at increased risk for poor recovery at the next recorded PEx and/or more treatments with IV antibiotics over the subsequent 3 years. We evaluated our hypothesis using data from the national CF Foundation Patient Registry (CFFPR).14 Some of the results of these studies have been previously reported in the form of an abstract.15
MATERIALS AND METHODS
We included data from individuals enrolled in the CFFPR from January 1, 2004, through December 31, 2011. Data are entered into the CFFPR at each clinical encounter. Because PEx identification and treatment may have changed over this time period,16 and some patients would have had a PEx prior to 2004, we included one PEx randomly selected for each patient who did not have an organ transplantation during this time period. PEx episodes were chosen using the random function in Microsoft Excel among hospitalizations or home IV antibiotic courses recorded in the CFFPR that met inclusion and exclusion criteria. Hospitalizations or home IV antibiotic courses were excluded if they were for reasons other than a PEx. PEx episodes were excluded if there was less than 12 months of data in the CFFPR before and after the PEx, or if there were no measurements of FEV1 recorded within the 6 months before and/or 3 months after the PEx. We excluded any PEx with a recorded treatment duration of <2 days, although our conclusions were not affected if we excluded PEx episodes of less than 3, 4, or 5 days. Patients were defined as Non-Responders if their best FEV1 measurement (in liters) in the 3 months after the PEx was <90% of the best FEV1 measurement (in liters) in the 6 months before the PEx. FEV1 is reported as percent predicted values, calculated using Global Lung Initiative equations.17 We excluded any PEx from our analysis if another PEx occurred prior to the best FEV1 in the 3 months following the analyzed PEx.
Statistical Analyses
Descriptive statistics were used to summarize patient characteristics. We used multivariable Cox proportional hazards regression models to assess the difference between Responders vs Non-Responders for time to the next PEx within 365 days, calculated as the time from the start of the first course of IV antibiotics to the start of the second course. We determined the relative risk of being a Non-Responder at the next PEx, according to Responder/Non-Responder status at the first PEx. We counted the number of IV antibiotic treatments for a PEx within the three years following the initial PEx and compared these using a negative binomial regression model.
We included the following variables in our regression models a priori based on a review of the literature for factors that may be associated with shorter time to the next PEx and/or poor spirometric recovery: undernourishment (defined as BMI <5th percentile according to CDC growth charts for children and <18.5 kg/m2 in adults), gender, age (categorized as 6–12, 13–17, 18–25, and 25+ years old), persistent infection (defined as ≥2 positive cultures in the previous 12 months) with Pseudomonas aeruginosa, Burkholderia cepacia complex, or methicillin resistant Staphylococcus aureus (MRSA), on pancreatic enzyme replacement therapy, Medicaid or state insurance, allergic bronchopulmonary aspergillosis, nontuberculous Mycobacteria, 2 or more PEx episodes treated with IV antibiotics in the prior 12 months, baseline FEV1, CF-related diabetes, the time between the baseline FEV1 measurement and the start of the PEx, and the duration of the IV antibiotics used to treat the PEx.6,7,9 We performed subset analyses by individually adding the decrease in FEV1 % predicted from baseline to the start of the PEx and the duration of IV antibiotics used to treat the initial PEx to the a priori models.8,18
A P value <0.05 was considered statistically significant for all analyses. All analyses are done in SAS version 9.4 (Cary, NC). The Institutional Review Board at the University of Wisconsin approved the study.
RESULTS
There were 35,516 patients with CF followed in the CFFPR during 2004–2011, 2,507 of whom had an organ transplantation during that time and were excluded from further analysis. During this time period, there were 197,085 hospitalizations or episodes with home IV antibiotics (Figure 1). From the 87,515 PEx episodes that met inclusion and exclusion criteria, we randomly selected one PEx for the 15,134 patients who had at least one PEx. We excluded 1,180 (7.8%) of the initially selected PEx episodes where another PEx occurred prior to the best FEV1 recorded in the 3 months following the initial PEx. Of the remaining PEx episodes, 2,762 (19.8%) patients were classified as Non-Responders by comparing FEV1 in liters before and after the PEx. Non-Responders had lower mean (SD) FEV1 % predicted at baseline, 64.1 (26.3), and the start of the PEx, 51.8 (22.9), than Responders, 71.8 (26.0) and 63.7 (24.0), respectively.
Figure 1.
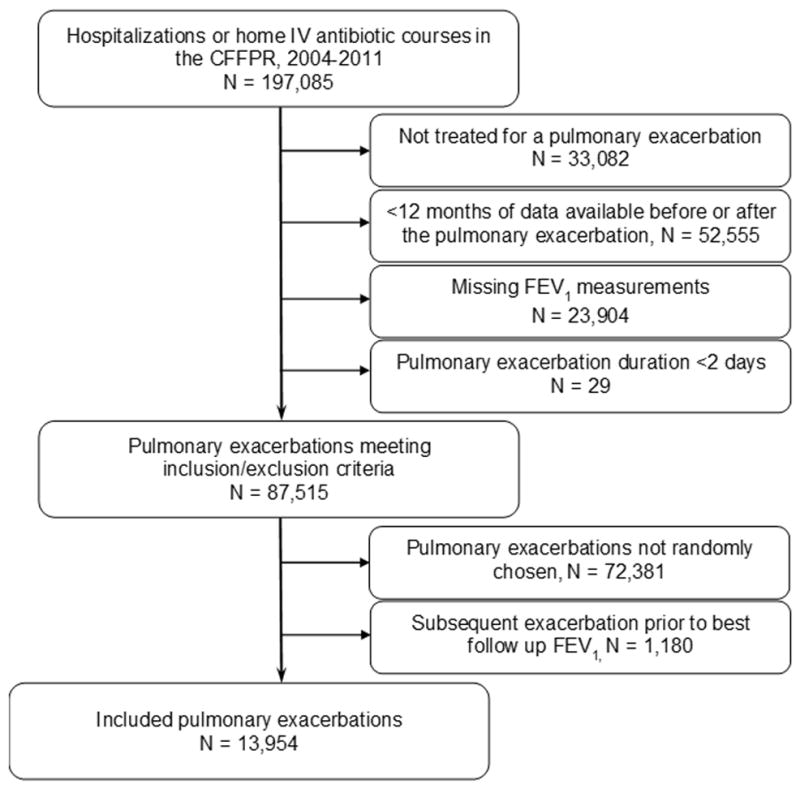
Diagram of study cohort
Non-Responders were more likely to be adult patients, undernourished, on Medicaid/state insurance, have persistent infections with P. aeruginosa and mucoid P. aeruginosa, have baseline FEV1 <80% predicted, and have CF-related diabetes (Table 1). Non-Responders also had more time between the baseline FEV1 assessment and the start of IV antibiotics, had a larger change in FEV1 % predicted from baseline, more PEx episodes treated with IV antibiotics in the previous 12 months, and were treated for a longer duration during the selected PEx. Adult patients were more likely to be Non-Responders (24.1%) than pediatric patients (14.8%), but Responder and Non-Responder differences were generally similar in separate pediatric and adult cohorts (online supplement Table E1). The proportion of female patients was higher among pediatric Non-Responders, but not adult Non-Responders.
Table 1.
Cohort characteristics according to Responder status
| Characteristic | Total (n=13,954) N (%) |
Responders (n=11,192) N (%) |
Non-Responders (n=2,762) N(%) |
|---|---|---|---|
| Female gender | 7,095 (50.9) | 5,654 (50.5) | 1,441 (52.2) |
| Adult patients (≥18 years old) | 7,477 (53.6) | 5,674 (50.7) | 1,803 (65.3) |
| Undernourisheda | 2,139 (15.3) | 1,506 (13.5) | 633 (22.9) |
| Pancreatic enzyme replacement therapy | 13,079 (93.7) | 10,471 (93.6) | 2,608 (94.4) |
| Homozygous F508del | 6,808 (48.8) | 5,478 (48.9) | 1,330 (48.1) |
| Heterozygous F508del | 4,960 (35.6) | 3,977 (35.5) | 983 (35.6) |
| Other/Unknown mutations | 2,186 (15.7) | 1,737 (15.5) | 449 (16.3) |
| Medicaid/state insurance | 6,647 (47.6) | 5,169 (46.2) | 1,478 (53.5) |
| Persistent P. aeruginosa infectionb | 7,182 (51.5) | 5,540 (49.5) | 1,642 (59.6) |
| Persistent B. cepacia complex infectionb | 410 (2.9) | 296 (2.6) | 114 (4.1) |
| Persistent mucoid P. aerginosa infectionb | 5,142 (36.9) | 3,921 (35.0) | 1,221 (44.2) |
| Persistent MRSA infectionb | 2,934 (21.0) | 2,275 (20.3) | 659 (23.9) |
| Nontuberculous Mycobacteria | 337 (2.4) | 264 (2.4) | 73 (2.6) |
| Allergic bronchopulmonary aspergillosis (ABPA) | 1,053 (7.5) | 815 (7.3) | 238 (8.6) |
| Baseline FEV1 | |||
| <40% predicted | 2,247 (16.1) | 1,629 (14.6) | 618 (22.4) |
| 40–59% predicted | 2,805 (20.1) | 2,092 (18.7) | 713 (25.8) |
| 60–79% predicted | 3,392 (24.3) | 2,775 (24.8) | 617 (22.3) |
| ≥80% predicted | 5,505 (39.5) | 4,691 (41.9) | 814 (29.5) |
| CF-related diabetes mellitus | 3,117 (22.3) | 2,314 (20.7) | 803 (29.1) |
| Mean (SD) | Mean (SD) | Mean (SD) | |
|
| |||
| Age (all patients) | 21.2 (11.2) | 20.8 (11.3) | 23.1 (11.0) |
| Age (pediatric patients) | 12.3 (3.5) | 12.2 (3.5) | 12.7 (3.6) |
| Age (adult patients) | 29.0 (9.8) | 29.1 (9.9) | 28.7 (9.4) |
| BMI percentile (pediatric patients) | 42.3 (26.9) | 43.3 (26.7) | 36.7 (27.6) |
| BMI (adult patients) | 21.5 (4.0) | 21.7 (3.6) | 20.9 (5.0) |
| Time between baseline and start of IV antibiotics (weeks) | 12.4 (8.2) | 11.9 (8.3) | 14.6 (7.7) |
| Change in FEV1 % predicted from baseline to start of IV antibioticsc | −15.1 (15.3) | −13.1 (14.3) | −23.9 (16.4) |
| PExs treated with IV antibiotics in the previous 12 months | 1.8 (1.2) | 1.6 (1.1) | 2.3 (1.5) |
| Duration of PEx treatment (days) | 16.0 (16.9) | 15.5 (15.3) | 18.2 (22.3) |
Defined as BMI <5th percentile according to CDC growth charts for children and <18.5 kg/m2 in adults
Persistent infection defined as ≥2 positive culture in the 12 months before the PEx
Baseline defined as the best FEV1 % predicted in the 6 months before the PEx among 7,678 patients with FEV1 measured within 3 days of the start of IV antibiotics
In the 365 days after the initially selected PEx, 45% of Responders and 63% of Non-Responders had another PEx. Kaplan-Meier analysis demonstrated that Non-Responders had a median (95% CI) time to the next PEx at least 4 months shorter than for Responders, 235 (218, 252) days, as compared to >365 days for Responders (Figure 2). In a multivariable Cox proportional hazards model, being a Non-Responder was associated with a shorter time to the next PEx, HR 1.11 (95% CI 1.05, 1.18) (Table 2). Proportionality of the Non-Responder covariate was confirmed by plotting Schoenfeld residuals. Each of the variables we selected a priori were significantly associated with a shorter time to the next PEx, except for nontuberculous Mycobacteria, ABPA, and the time between the baseline FEV1 measurement and the initiation of IV antibiotics. Among the 7,678 patients with FEV1 measured at the initiation of antibiotics, a decrease in FEV1 % predicted >15% predicted was not significantly associated with shorter time to the next PEx.
Figure 2.
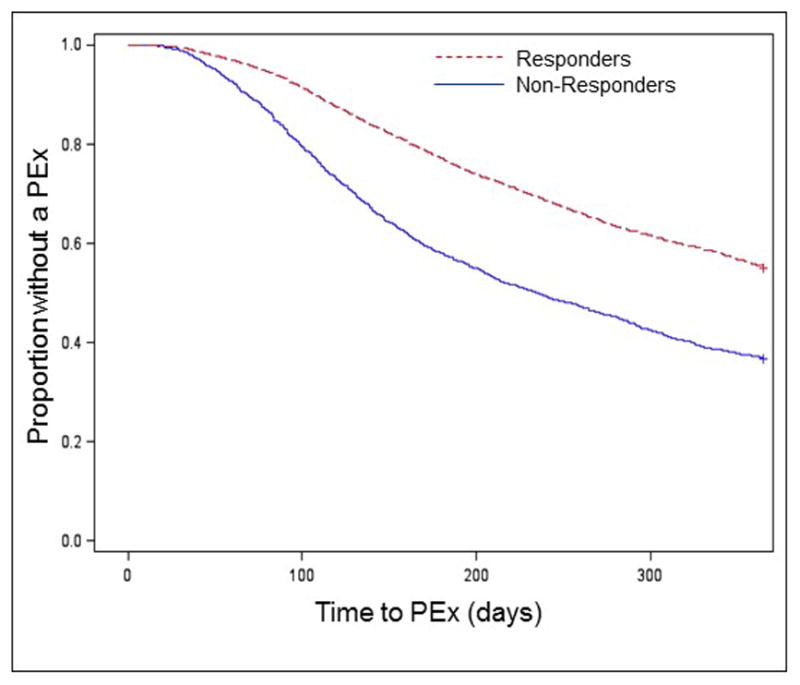
Kaplan–Meier time-to-PEx according to degree of spirometric recovery at a randomly selected PEx. According to our inclusion criteria, data was available for all patients for the first 12 months after the chosen PEx.
Table 2.
Multivariable Cox proportional hazards model for time to next PEx. Hazard ratios (HR) >1 indicates increased risk of a PEx.
| Parameter | HR | 95% CI |
|---|---|---|
| Non-Responder | 1.11 | 1.05, 1.18 |
| Female gender | 1.16 | 1.10, 1.21 |
| Age category (Reference: 6–12 years of age) | ||
| 13–17 years | 1.24 | 1.15, 1.35 |
| 18–25 | 1.15 | 1.06, 1.25 |
| 25+ | 1.02 | 0.93, 1.11 |
| Undernourished | 1.10 | 1.04, 1.18 |
| Pancreatic insufficiency | 1.16 | 1.04, 1.30 |
| Medicaid/state insurance | 1.22 | 1.16, 1.28 |
| P. aeruginosa | 1.13 | 1.07, 1.19 |
| B. cepacia complex | 1.20 | 1.06, 1.35 |
| MRSA | 1.09 | 1.03, 1.16 |
| Nontuberculous Mycobacteria | 1.13 | 0.97, 1.30 |
| ABPA | 1.02 | 0.94, 1.11 |
| Baseline FEV1 % predicted (Reference: ≥80% predicted) | ||
| <40% predicted | 1.44 | 1.33, 1.57 |
| 40–59% predicted | 1.51 | 1.41, 1.63 |
| 60–79% predicted | 1.24 | 1.16, 1.33 |
| CF-related diabetes mellitus | 1.13 | 1.07, 1.20 |
| Time between baseline and start of IV antibiotics (weeks) | 1.00 | 0.99, 1.00 |
| PExs treated with IV antibiotics in the previous 12 months (≥2) | 7.28 | 6.88, 7.72 |
As reported previously,18 the number of exacerbations treated with IV antibiotics in the previous 12 months had the strongest association with a shorter time to the next PEx (Table 2). Only 22% of patients with 0–1 PEx in the prior year had another PEx treated with IV antibiotics within 365 days of the initially selected PEx, compared to 85% of patients with ≥2 PEx episodes in the prior year. Among patients with ≥2 PEx episodes in the prior year, the median (95% CI) time to the next PEx was 4 weeks shorter for Non-Responders [139 (133, 143) days] than for Responders [168, (163, 172)].
In the 3 years after the PEx selected for this study, 10,998 (79%) patients had at least one more PEx recorded in the CFFPR, 8,682 of whom had sufficient measurements of FEV1 to classify Responder status. Among these patients, 1,797 (20.7%) were Non-Responders at the initial PEx and 2,015 (23.2%) were Non-Responders at the next recorded PEx. Only 1,392 (20.2%) of patients who were Responders at the initial PEx were Non-Responders at the second. However, 623 (34.7%) of the Non-Responders at the initial PEx were also Non-Responders at the second. Compared with Responders at the initial PEx, the relative risk of being a Non-Responder at the next PEx was 1.7 (95% CI 1.6, 1.9) for Non-Responders at the initial PEx. Changes in FEV1 % predicted around these PEx episodes are shown in Figure 3. Patients who were Non-Responders at the first PEx episode had a mean (SD) baseline FEV1 of 64.1 (26.3)% predicted at the start of the study, but the best recorded FEV1 in the 3 months after the second PEx for patients who were Non-Responders at both PEx episodes decreased to a mean of 48.3 (20.8)% predicted. In contrast, patients who were Responders at the first PEx episode began the study with a baseline FEV1 of 71.8 (26.0)% predicted and patients who were Responders at both PEx episodes completed the study with FEV1 of 70.7 (24.9)% predicted.
Figure 3.

Schema for changes in FEV1 % predicted between Responders (black lines) and Non-Responders (grey lines) at the initially analyzed PEx and the next recorded PEx. Bracketed numbers indicate number of Responders and Non-Responders for each PEx. Grey boxes indicate PEx episodes. Dashed lines indicate patients may switch between groups between the two PEx episodes. The numbers next to the dashed lines represent the percent of patients from the initial PEx that become Responders and Non-Responders at the next PEx. Time between PEx episodes was at least 4 months longer than for Non-Responders (see text). Patients who remained Responders at both PEx episodes had preserved FEV1, while patients who were Non-Responders at both PEx episodes experienced a mean decline in FEV1 of nearly 16% predicted (see text).
Given the differences in age and sex between Responders and Non-Responders at the initial PEx, we explored the relative risk of being a Non-Responder at the next PEx according to age and sex. The relative risk of being a Non-Responder at the next PEx was 0.63 (95% CI 0.59, 0.69) for pediatric patients, compared with adult patients. The relative risk of being a Non-Responder at the next PEx was not statistically significantly different according to sex.
Patients who were Non-Responders at the randomly chosen PEx had a higher mean (95% CI) number of PEx treatments in the next 3 years, 4.99 (4.84, 5.13), as compared to 3.46 (3.41, 3.51) for Responders at the initial PEx (Figure 4). The greatest difference in the number of PEx in the subsequent 3 years was between patients with 0–1 PEx in the prior year, 2.31 (2.27, 2.35), and patients with ≥2 PEx episodes in the prior year 5.75 (5.66, 5.85). The number of PEx treatments in the 3 years following the initial PEx remained significantly higher for Non-Responders compared to Responders in a multivariable negative binomial model (online supplement Table E2).
Figure 4.

Number of PEx episodes over the next 3 years according to Responder status and prior-year PEx history at the analyzed PEx. The horizontal line represents the median number of PEx episodes, the box represent the interquartile range (IQR) between the 25th and 75th quartiles. The whiskers indicate the number of PEx episodes within 1.5 × IQR of the upper and lower quartiles. The ● represents the mean number of PEx episodes.
We then repeated our analyses, defining Non-Responders as patients whose best FEV1 measurement in liters in the 3 months after the PEx was <100% of the best FEV1 measurement in liters in the 6 months before the PEx. With this definition, 6,697 (48%) of patients met criteria for being a Non-Responder. Using this definition, 56% of Non-Responders and 42% of Responders had another PEx within the next year, and Non-Responders had a median (95% CI) time to the next PEx, 303 (289, 313) days, at least 2 months shorter than Responders, >365 days. Being a Non-Responder at the initial PEx using the new definition was associated with one additional PEx treatment in the next 3 years, 4.29 (4.21, 4.37), compared to 3.28 (3.21, 3.34) for Responders. Parameter estimates in the multivariable Cox and negative binomial regression models were generally unchanged.
DISCUSSION
Several recent observational reports have demonstrated that measurements of FEV1 following a PEx treated with IV antibiotics often do not reach the levels recorded in the months preceding the PEx.6–10 None of these reports has explored the long-term outcomes that occur following poor recovery from a PEx. Herein, we have shown that poor spirometric recovery after a PEx is associated with a shorter time to the next PEx, increased risk of poor recovery at the next PEx, and more frequent PEx treatments over the following 3 years. Our results demonstrate that having poor spirometric recovery after a PEx may not be an isolated event that patients can eventually recover from. Rather, these events have long-term implications for the health of people with CF and preventing or more adequately treating PEx episodes deserves significant attention.
Despite significant improvement in FEV1 in people with CF over the past decades, the rate of exacerbations treated with IV antibiotics has been stable for at least the past 20 years.14 Waters et al. showed that a substantial proportion of overall FEV1 decline is attributable to exacerbations.19 Vandevanter et al. showed that having one course of IV antibiotics to treat a PEx is a very strong predictor of having another course of IV antibiotics,18 an effect also seen in our analysis. Although our analysis shows that poor PEx recovery is associated with a shorter time to the next PEx, it should be noted that the PEx history had a much stronger effect.
Each of these studies, including our report, is observational and cannot prove causality. Furthermore, there is limited data to support specific PEx treatments that can improve PEx recovery or longer-term poor outcomes. A recent study did demonstrate that adult patients treated with 7% hypertonic saline during a PEx were more likely to recover to baseline FEV1 than patients who received a saline placebo.20 An analysis of an observational study of adolescents and adults with CF treated with IV antibiotics for a PEx did not identify any best practices associated with improved outcomes.10 In the recently completed observational Standardized Treatment of Pulmonary Exacerbations in Patients with Cystic Fibrosis (STOP) study, 35% of participants failed to reach 90% of previous baseline FEV1 % predicted.
Having poor recovery at the initial PEx was associated with a significantly increased risk of poor recovery after the second PEx. In our analysis, patients who were in the Non-Responder group for both PEx episodes experienced a >15% decrease in mean FEV1 % predicted from before the initial PEx to after the second, over a time period that could be less than 2 years (Figure 3). Given the time between events, it is unlikely that the poor response at the initial PEx directly caused the poor recovery at the second PEx. It is possible that poor recovery may be a specific PEx phenotype that may be affected by characteristics of the patient, lung disease phenotype,21 PEx etiology (e.g., viral infections, medical nonadherence, microbiota), or PEx treatment decisions. Some patients are likely to return to clinic (and have FEV1 recorded) only when they are sick. This may place them at higher risk for repeated poor recovery if their “best follow up” FEV1 is recorded when they are sick. The CFFPR does not contain much of the above data, limiting our ability to further characterize this potential phenotype.
The large size of the CFFPR is a strength that allowed us to find associations between poor PEx recovery and long-term outcomes, but the observational nature of this study has limitations. First, it is possible that the association between poor PEx recovery and time to the next PEx is due to indication bias, i.e., clinicians recognize that patients did not respond as expected after the first treatment, so they choose to treat with IV antibiotics again. However, the median time between consecutive PEx treatments was over 7 months, so it is unlikely that clinicians treated these as linked events. Additionally, in surveys, the majority of treating physicians view PEx treatment as a success, even when FEV1 has not returned to previous baseline values.22 Moreover, we excluded PEx episodes when a second PEx occurred prior to the best FEV1 in the 3 months after the chosen PEx to try and isolate the effects of a single PEx treatment. Risk factors for repeated PEx over very short periods have recently been reported.18 Second, shorter time to the next PEx may occur because of the new, lower baseline FEV1. More severe lung disease is a risk factor for more frequent PEx and poor recovery from PEx (Table 2). We adjusted for baseline FEV1 in our regression models, though it is possible that residual confounding is present. Third, our study, as with many epidemiologic studies, only addressed exacerbations treated with IV antibiotics. Exacerbations treated with IV antibiotics are important clinical end points associated with progression of lung disease, lower quality of life, and healthcare expenditures.2,3,5 However, our analysis does not address the many episodes treated with oral and/or inhaled antibiotics.23 These treatments may affect time to PEx and baseline FEV1,24,25 but the data is not well-tracked in the CFFPR. We chose Medicaid insurance as a marker of low socioeconomic status because it has been used previously in epidemiologic studies of CF.26,27 However, differences in healthcare utilization (e.g., number of well vs sick visits) and pulmonary function vary according to the specific marker of low socioeconomic status.28,29 For example, in the US, tobacco smoke exposure occurs most often in families with low socioeconomic status, and has independent effects on pulmonary outcomes. A recent report indicated that children exposed to tobacco smoke were more likely to have crackles and wheezes on exam.30 While disparities in CF lung disease related to socioeconomic status have not been explained by differential treatment of pulmonary exacerbations,27 the presence of these respiratory findings are associated with increased frequency of antibiotic courses.31 Tobacco smoke exposure is likely under-reported in the CFFPR, and so we did not evaluate it in our models. Finally, it should be acknowledged that recovering to within 90% of the previous baseline FEV1 is less than an ideal goal of therapy. This level of recovery was chosen to allow for the inherent variability in FEV1 measurements,32,33 as well as the possibility that patients’ true best FEV1 may occur when they are not in clinic, and therefore not measured. The magnitude and statistical significance of our conclusions were not affected when we changed the definition of recovery to recovering to 100% of the previous baseline. It should be noted that 48.6% of patients failed to achieve this goal.
In conclusion, we have described an association between poor spirometric recovery from a PEx and a shorter time to the next PEx. As described previously, having recent exacerbation(s) treated with IV antibiotics is the strongest predictor of having a subsequent PEx treated with IV antibiotics. In this study, we have added to our understanding of this epidemiologic phenomenon, as poor recovery at the initial PEx is associated with an even shorter time to the next PEx in multivariable regression models that account for prior PEx history. Patients who have poor recovery at the initial PEx are at increased risk of poor recovery at a subsequent PEx. Further investigations are needed to understand the etiology and clinical impact of these epidemiologic associations. Most importantly, studies to optimize treatment and/or prevention of pulmonary exacerbations are urgently needed to minimize our patients’ risks of permanently losing lung function.
Supplementary Material
Acknowledgments
Grant Support: DBS was supported by the Cystic Fibrosis Foundation (SANDERS11A0) and the Institute for Clinical and Translational Research (ICTR) through the NIH National Center for Advancing Translational Sciences (NCATS) grants UL1 TR000427 and KL2TR000428.
The authors would like to thank Bruce Marshall and the Cystic Fibrosis Foundation for the use of CF Foundation Patient Registry data to conduct this study. Additionally, we would like to thank the patients, care providers, and clinic coordinators at CF Centers throughout the United States for their contributions to the CF Foundation Patient Registry.
Footnotes
Some of this work was presented at the North American Cystic Fibrosis Conference in 2015 in Phoenix, AZ.
Author Contributions: All authors contributed to the study design, participated in data analysis/interpretation, critical review and revision of the manuscript, and approved the final draft for submission.
References
- 1.Ferkol T, Rosenfeld M, Milla CE. Cystic fibrosis pulmonary exacerbations. J Pediatr. 2006;148:259–264. doi: 10.1016/j.jpeds.2005.10.019. [DOI] [PubMed] [Google Scholar]
- 2.Goss C, Burns J. Exacerbations in cystic fibrosis. 1: Epidemiology and pathogenesis. Thorax. 2007;62(4):360–367. doi: 10.1136/thx.2006.060889. [DOI] [PMC free article] [PubMed] [Google Scholar]
- 3.Britto M, Kotagal U, Hornung R, Atherton H, Tsevat J, Wilmott R. Impact of recent pulmonary exacerbations on quality of life in patients with cystic fibrosis. Chest. 2002;121(1):64–72. doi: 10.1378/chest.121.1.64. [DOI] [PubMed] [Google Scholar]
- 4.Liou T, Adler F, Fitzsimmons S, Cahill B, Hibbs J, Marshall B. Predictive 5-year survivorship model of cystic fibrosis. Am J Epidemiol. 2001;153(4):345–352. doi: 10.1093/aje/153.4.345. [DOI] [PMC free article] [PubMed] [Google Scholar]
- 5.Lieu T, Ray G, Farmer G, Shay G. The cost of medical care for patients with cystic fibrosis in a health maintenance organization. Pediatrics. 1999;103(6):e72. doi: 10.1542/peds.103.6.e72. [DOI] [PubMed] [Google Scholar]
- 6.Sanders D, Hoffman L, Emerson J, Gibson R, Rosenfeld M, Redding G, Goss C. Return of FEV1 after pulmonary exacerbation in children with cystic fibrosis. Pediatr Pulmonol. 2010;45(2):127–134. doi: 10.1002/ppul.21117. [DOI] [PubMed] [Google Scholar]
- 7.Sanders D, Bittner R, Rosenfeld M, Hoffman L, Redding G, Goss C. Failure to recover to baseline pulmonary function after cystic fibrosis pulmonary exacerbation. Am J Respir Crit Care Med. 2010;182(5):627–632. doi: 10.1164/rccm.200909-1421OC. [DOI] [PMC free article] [PubMed] [Google Scholar]
- 8.Waters VJ, Stanojevic S, Sonneveld N, Klingel M, Grasemann H, Yau YC, Tullis E, Wilcox P, Freitag A, Chilvers M, Ratjen FA. Factors associated with response to treatment of pulmonary exacerbations in cystic fibrosis patients. J Cyst Fibros. 2015;14(6):755–762. doi: 10.1016/j.jcf.2015.01.007. [DOI] [PubMed] [Google Scholar]
- 9.Parkins MD, Rendall JC, Elborn JS. Incidence and Risk Factors for Pulmonary Exacerbation Treatment Failures in Patients With Cystic Fibrosis Chronically Infected With Pseudomonas aeruginosa. Chest. 2012;141(2):485–493. doi: 10.1378/chest.11-0917. [DOI] [PubMed] [Google Scholar]
- 10.Heltshe SL, Goss CH, Thompson V, Sagel SD, Sanders DB, Marshall BC, Flume PA. Short-term and long-term response to pulmonary exacerbation treatment in cystic fibrosis. Thorax. 2016;71(3):223–229. doi: 10.1136/thoraxjnl-2014-206750. [DOI] [PMC free article] [PubMed] [Google Scholar]
- 11.Mayer-Hamblett N, Rosenfeld M, Emerson J, Goss C, Aitken M. Developing cystic fibrosis lung transplant referral criteria using predictors of 2-year mortality. Am J Respir Crit Care Med. 2002;166(12 Pt 1):1550–1555. doi: 10.1164/rccm.200202-087OC. [DOI] [PubMed] [Google Scholar]
- 12.Dill EJ, Dawson R, Sellers DE, Robinson WM, Sawicki GS. Longitudinal trends in health-related quality of life in adults with cystic fibrosis. Chest. 2013;144(3):981–989. doi: 10.1378/chest.12-1404. [DOI] [PMC free article] [PubMed] [Google Scholar]
- 13.VanDevanter DR, Morris NJ, Konstan MW. IV-treated pulmonary exacerbations in the prior year: An important independent risk factor for future pulmonary exacerbation in cystic fibrosis. J Cyst Fibros. 2016;15(3):372–379. doi: 10.1016/j.jcf.2015.10.006. [DOI] [PMC free article] [PubMed] [Google Scholar]
- 14.Knapp EA, Fink AK, Goss CH, Sewall A, Ostrenga J, Dowd C, Elbert A, Petren KM, Marshall BC The Cystic Fibrosis Foundation Patient Registry. Design and Methods of a National Observational Disease Registry. Ann Am Thorac Soc. 2016;13(7):1173–9. doi: 10.1513/AnnalsATS.201511-781OC. [DOI] [PubMed] [Google Scholar]
- 15.Zhao QLZ, Sanders D. Failure to Recover from a Pulmonary Exacerbation is Associated with a Shorter Time to the Next Exacerbation. Pediatr Pulmonol. 2015;50(S41):S193–S453. [Google Scholar]
- 16.VanDevanter DR, Elkin EP, Pasta DJ, Morgan WJ, Konstan MW Fibrosis IaCotESoC. Changing thresholds and incidence of antibiotic treatment of cystic fibrosis pulmonary exacerbations, 1995–2005. J Cyst Fibros. 2013;12(4):332–337. doi: 10.1016/j.jcf.2012.11.011. [DOI] [PubMed] [Google Scholar]
- 17.Quanjer PH, Stanojevic S, Cole TJ, Baur X, Hall GL, Culver BH, Enright PL, Hankinson JL, Ip MS, Zheng J, Stocks J ERS Global Lung Function Initiative. Multi-ethnic reference values for spirometry for the 3–95-yr age range: the global lung function 2012 equations. Eur Respir J. 2012;40(6):1324–1343. doi: 10.1183/09031936.00080312. [DOI] [PMC free article] [PubMed] [Google Scholar]
- 18.VanDevanter DR, Flume PA, Morris N, Konstan MW. Probability of IV antibiotic retreatment within thirty days is associated with duration and location of IV antibiotic treatment for pulmonary exacerbation in cystic fibrosis. J Cyst Fibros. 2016;15(6):783–790. doi: 10.1016/j.jcf.2016.04.005. [DOI] [PMC free article] [PubMed] [Google Scholar]
- 19.VanDevanter DR, Konstan MW. Outcome measures for clinical trials assessing treatment of cystic fibrosis lung disease. Clin Investig (Lond) 2012;2(2):163–175. doi: 10.4155/cli.11.174. [DOI] [PMC free article] [PubMed] [Google Scholar]
- 20.Smith A, Doershuk C, Goldmann D, Gore E, Hilman B, Marks M, Moss R, Ramsey B, Redding G, Rubio T, Williams-Warren J, Wilmott R, Wilson H, Yogev R. Comparison of a beta-lactam alone versus beta-lactam and an aminoglycoside for pulmonary exacerbation in cystic fibrosis. J Pediatr. 1999;134(4):413–421. doi: 10.1016/s0022-3476(99)70197-6. [DOI] [PubMed] [Google Scholar]
- 21.Waters V, Stanojevic S, Atenafu EG, Lu A, Yau Y, Tullis E, Ratjen F. Effect of pulmonary exacerbations on long-term lung function decline in cystic fibrosis. Eur Respir J. 2012;40(1):61–66. doi: 10.1183/09031936.00159111. [DOI] [PubMed] [Google Scholar]
- 22.Dentice RL, Elkins MR, Middleton PG, Bishop JR, Wark PAB, Dorahy DJ, Harmer CJ, Hu H, Bye PTP. A randomised trial of hypertonic saline during hospitalisation for exacerbation of cystic fibrosis. Thorax. 2016;71(2):141–147. doi: 10.1136/thoraxjnl-2014-206716. [DOI] [PubMed] [Google Scholar]
- 23.Harris WT, Boyd JT, McPhail GL, Brody AS, Szczesniak RD, Korbee LL, Baker ML, Clancy JP. Constrictive Bronchiolitis in Cystic Fibrosis Adolescents with Refractory Pulmonary Decline. Ann Am Thorac Soc. 2016;13(12):2174–2183. doi: 10.1513/AnnalsATS.201412-594OC. [DOI] [PMC free article] [PubMed] [Google Scholar]
- 24.West NE, Beckett VV, Jain R, Sanders DB, Nick JA, Heltshe SL, Dasenbrook EC, VanDevanter DR, Solomon GM, Goss CH, Flume PA STOP investigators. Standardized Treatment of Pulmonary exacerbations (STOP) study: Physician treatment practices and outcomes for individuals with cystic fibrosis with pulmonary exacerbations. J Cyst Fibros. 2017 doi: 10.1016/j.jcf.2017.04.003. Epub ahead of print. [DOI] [PMC free article] [PubMed] [Google Scholar]
- 25.Wagener JS, Rasouliyan L, VanDevanter DR, Pasta DJ, Regelmann WE, Morgan WJ, Konstan MW Investigators and Coordinators of the Epidemiologic Study of Cystic Fibrosis. Oral, inhaled, and intravenous antibiotic choice for treating pulmonary exacerbations in cystic fibrosis. Pediatr Pulmonol. 2013;48(7):666–673. doi: 10.1002/ppul.22652. [DOI] [PMC free article] [PubMed] [Google Scholar]
- 26.Mayer-Hamblett N, Saiman L, Lands LC, Anstead M, Rosenfeld M, Kloster M, Fisher L, Ratjen F. Impact of acute antibiotic therapy on the pulmonary exacerbation endpoint in cystic fibrosis clinical trials. Contemp Clin Trials. 2013;36(1):99–105. doi: 10.1016/j.cct.2013.06.004. [DOI] [PubMed] [Google Scholar]
- 27.Stanojevic S, McDonald A, Waters V, MacDonald S, Horton E, Tullis E, Ratjen F. Effect of pulmonary exacerbations treated with oral antibiotics on clinical outcomes in cystic fibrosis. Thorax 2016. 2017;72(4):327–332. doi: 10.1136/thoraxjnl-2016-208450. Epub ahead of print. [DOI] [PubMed] [Google Scholar]
- 28.Schechter M, Shelton B, Margolis P, Fitzsimmons S. The association of socioeconomic status with outcomes in cystic fibrosis patients in the United States. Am J Respir Crit Care Med. 2001;163(6):1331–1337. doi: 10.1164/ajrccm.163.6.9912100. [DOI] [PubMed] [Google Scholar]
- 29.Schechter MS, McColley SA, Regelmann W, Millar SJ, Pasta DJ, Wagener JS, Konstan MW, Morgan WJ Investigators and Coordinators of the Epidemiologic Study of Cystic Fibrosis. Socioeconomic status and the likelihood of antibiotic treatment for signs and symptoms of pulmonary exacerbation in children with cystic fibrosis. J Pediatr. 2011;159(5):819–824. e811. doi: 10.1016/j.jpeds.2011.05.005. [DOI] [PMC free article] [PubMed] [Google Scholar]
- 30.Schechter MS, McColley SA, Silva S, Haselkorn T, Konstan MW, Wagener JS Investigators Coordinators of the Epidemiologic Study of Cystic F, North American Scientific Advisory Group for E. Association of socioeconomic status with the use of chronic therapies and healthcare utilization in children with cystic fibrosis. J Pediatr. 2009;155(5):634–639. e631–634. doi: 10.1016/j.jpeds.2009.04.059. [DOI] [PMC free article] [PubMed] [Google Scholar]
- 31.Britton LJ, Oates GR, Oster RA, Self ST, Troxler RB, Hoover WC, Gutierrez HH, Harris WT. Risk stratification model to detect early pulmonary disease in infants with cystic fibrosis diagnosed by newborn screening. Pediatr Pulmonol. 2016;51(11):1168–1176. doi: 10.1002/ppul.23536. [DOI] [PMC free article] [PubMed] [Google Scholar]
- 32.Ong T, Schechter M, Yang J, Peng L, Emerson J, Gibson RL, Morgan W, Rosenfeld M, Group ES. Socioeconomic Status, Smoke Exposure, and Health Outcomes in Young Children With Cystic Fibrosis. Pediatrics. 2017;139(2):e20162730. doi: 10.1542/peds.2016-2730. [DOI] [PMC free article] [PubMed] [Google Scholar]
- 33.Regelmann WE, Schechter MS, Wagener JS, Morgan WJ, Pasta DJ, Elkin EP, Konstan MW. Pulmonary exacerbations in cystic fibrosis: young children with characteristic signs and symptoms. Pediatr Pulmonol. 2013;48(7):649–657. doi: 10.1002/ppul.22658. [DOI] [PMC free article] [PubMed] [Google Scholar]
- 34.Cooper PJ, Robertson CF, Hudson IL, Phelan PD. Variability of pulmonary function tests in cystic fibrosis. Pediatr Pulmonol. 1990;8(1):16–22. doi: 10.1002/ppul.1950080107. [DOI] [PubMed] [Google Scholar]
- 35.Nickerson BG, Lemen RJ, Gerdes CB, Wegmann MJ, Robertson G. Within-subject variability and per cent change for significance of spirometry in normal subjects and in patients with cystic fibrosis. Am Rev Respir Dis. 1980;122(6):859–866. doi: 10.1164/arrd.1980.122.6.859. [DOI] [PubMed] [Google Scholar]
Associated Data
This section collects any data citations, data availability statements, or supplementary materials included in this article.