Abstract
Epidemiological evidence that red wine consumption negatively correlates with risk of AD has led to experimental studies demonstrating that grape seed extracts inhibit the aggregation and oligomerization of Aβ in vitro and ameliorate neuropathology and behavioral deficits in a mouse model of AD. The active agent in the extracts is a mixed population of polyphenolic compounds. To evaluate the relative potency of each of these compounds, HPLC was used to fractionate the mixture into monomers, dimers, and oligomers. Each fraction was analyzed for its effect on Aβ conformational dynamics (circular dichroism), oligomerization (zero-length photochemical cross-linking), aggregation kinetics (Thioflavin T fluorescence), and morphology (electron microscopy). The relative activities of each fraction were determined on the basis of molar concentration (mol/L) or mass concentration (g/L). When molar concentration, the number concentration of each polyphenolic compound, was considered, the oligomer fraction was the most potent inhibitor of Aβ oligomerization and aggregation. However, when mass concentration, the number concentration of phenolic groups, was considered, monomers were the most potent inhibitors. To understand these ostensibly contradictory results, a model of polyphenol: Aβ complexation was developed. This model, which was found to be consistent with published X-ray crystallographic studies, offers an explanation for the effects of functional group polyvalency on inhibitor activity. Our data emphasize the importance of an in-depth understanding of the mechanism(s) underlying “concentration dependence” in inhibitor systems involving polyfunctional agents.
Keywords: Amyloid β-protein (Aβ), Alzheimer's disease, oligomers, grape seeds, polyphenols, inhibitors
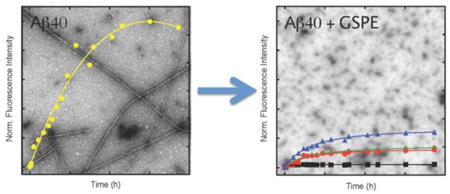
Graphical abstract
Introduction
Alzheimer's Disease (AD), the most common late-life neurodegenerative disorder, is estimated to affect >35 million people worldwide, a number that is predicted to reach ≈115 million by 2050 (Brookmeyer et al. 2007, 2009). If therapies can be developed that delay disease onset and progression by just one year, there will be an estimated 9 million fewer AD cases by 2050 (Brookmeyer et al. 2007). Current AD treatments, which include blocking acetylcholine degradation or N-methyl-D-aspartate (NMDA) receptors, provide at best, modest, short-term symptomatic relief (Cummings 2004).
AD is characterized neuropathologically by the cerebral deposition of two hallmark proteinaceous aggregates—amyloid plaques, formed by the amyloid β-protein (Aβ), and neurofibrillary tangles (NFTs), formed by the protein tau. Hardy and Higgins originally proposed the “amyloid cascade hypothesis” of AD pathogenesis, wherein Aβ fibrils are neurotoxic and lead to neuronal cell death (Hardy & Higgins 1992). However, subsequent biochemical, biological, and behavioral studies suggest that Aβ oligomers may be the most important neurotoxic species (Roychaudhuri et al. 2009, Klein 2006). Blocking Aβ assembly and neurotoxicity thus may be an attractive therapeutic approach.
Recent epidemiological data suggest that moderate consumption of red wine may prevent or delay the onset of AD (Letenneur et al. 1993, Dorozynski 1997, Orgogozo et al. 1997, Truelsen et al. 2002). Red wine contains a broad range of polyphenolic compounds that appear responsible for these protective effects. Polyphenols are plentiful in nature. Sources include berries, tea, beer, olive oil, chocolate/cocoa, coffee, walnuts, peanuts, pomegranates, popcorn, and yerba mate. Experimental evidence has shown that polyphenols are potent anti-oxidants, as well as inhibitors of Aβ and tau self-assembly (Virgili & Contestabile 2000, Flamini 2003, Ono et al. 2008, Ho et al. 2009, Pasinetti et al. 2010). A commercially available grape seed polyphenolic extract (GSPE), MegaNatural-AZ®, significantly ameliorated AD-like neuropathology and cognitive deficits in the Tg2576 mouse model of AD (Wang et al. 2008). In the JNPL3 mouse model of tauopathy (containing the P301L mutation), oral administration of GSPE was observed to reduce oligomeric tau in the brain while also attenuating the severity of motor impairment typically observed (Pasinetti et al. 2010).
HPLC fractionation and mass spectrometry studies have confirmed that GSPE comprises polyphenols composed of catechin, epicatechin, and their derivatives (Fig. 1, Supplemental Fig. 1) (Flamini 2003). Size-exclusion chromatography shows that GSPE is a mixture of monomers1, oligomers, and polymers (Wang et al. 2008, Sharma et al. 2011, Wang et al. 2012). Increasing numbers of monomer units of catechin and its derivatives combine to form GSPE oligomers as large as 10 monomers. Prior studies of GSPE activity have used unfractionated material (Ono et al. 2008). We sought here to determine the activities of pure monomers, dimers, and oligomers on Aβ assembly. Analysis of the relative potencies of each fraction with respect to molar (M) and weight (g/L) concentration provided the information necessary for: (1) conception of a model explaining polyphenol:Aβ interactions; and (2) understanding how studies of multifunctional inhibitor compounds should be interpreted in the context of the development and use of GSPE for therapeutic purposes.
Fig. 1. Structures of representative GSPE components.
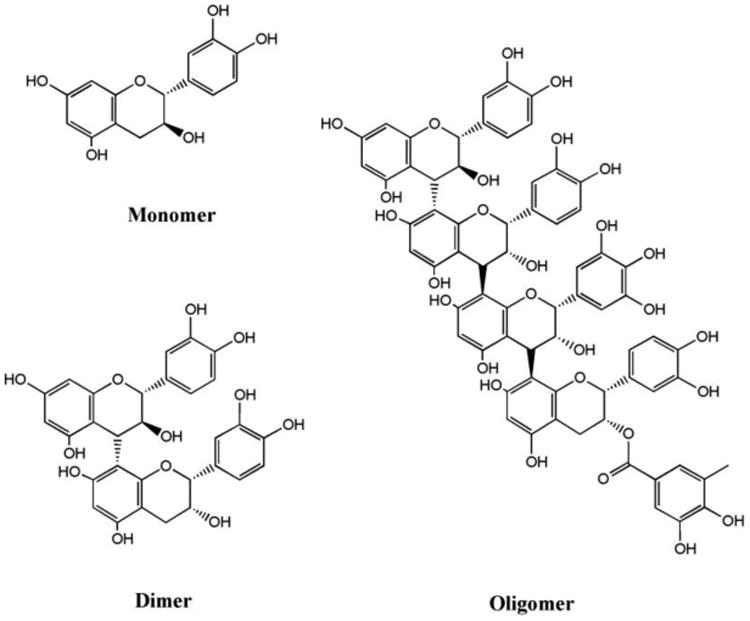
GSPE is water-soluble polyphenolic extract from Vitis vinifera grape seeds. GSPE comprises catechin and epicatechins in monomeric (8%), dimeric (75%), and oligomeric (17%) forms. Examples of monomer, dimer, and oligomer structures are shown. The GSPE oligomer shown is composed of four monomer units: catechin, epicatechin, epigallocatechin, and epicatechin gallate. GSPE monomer, dimers, and oligomers likely are structurally heterogeneous.
Results and Discussion
Thousands of polyphenolic compounds are found in wine, including flavonoids and non-flavonoids. Flavanoids, which include anthocyanidins and tannins, contribute to the color and taste of wine. Non-flavonoids include resveratrol and compounds that impart acidity, including benzoic, caffeic, and cinnamic acid. GSPE is a polyphenolic extract derived from Vitis vinifera grape seeds that comprises catechin, epicatechin, and their derivatives (including epigallocatechin and epicatechin gallate) (Pasinetti et al. 2010). GSPE has been shown to reduce AD-like cognitive decline and high molecular weight cerebral amyloid deposition in Tg2576 mice, as well as protect differentiated PC12 cells in vitro from Aβ-induced injury (Ono et al. 2008). GSPE blocks the statistical coil (SC)→α-helix/β-sheet secondary structure transitions that are typical of Aβ self-assembly (Kirkitadze et al. 2001) and blocks Aβ oligomerization, protofibril formation, and fibril formation (Ono et al. 2008). However, size-activity relationships on specific components of the GSPE mixture have not been done. For this reason, we studied here the effects of three components of the GSPE mixture on Aβ assembly—monomers, dimers, oligomers, and the mixture thereof.
Effects of GSPE on Aβ oligomerization
We used Photo Induced Cross-linking of Unmodified Proteins (PICUP), a zero-length chemical cross-linking method (Teplow et al. 2006), combined with SDS-PAGE and silver staining, to evaluate the effect of GSPE on Aβ oligomerization. Non-cross-linked Aβ40 was monomeric (Fig. 2A, X-), whereas cross-linked Aβ40 displayed an oligomer distribution comprising predominantly monomers through tetramers, along with some larger oligomers (Fig. 2A, X+). All three GSPE components inhibited Aβ40 oligomerization in a concentration-dependent manner.
Fig. 2. Oligomerization of Aβ in the presence of GSPE.
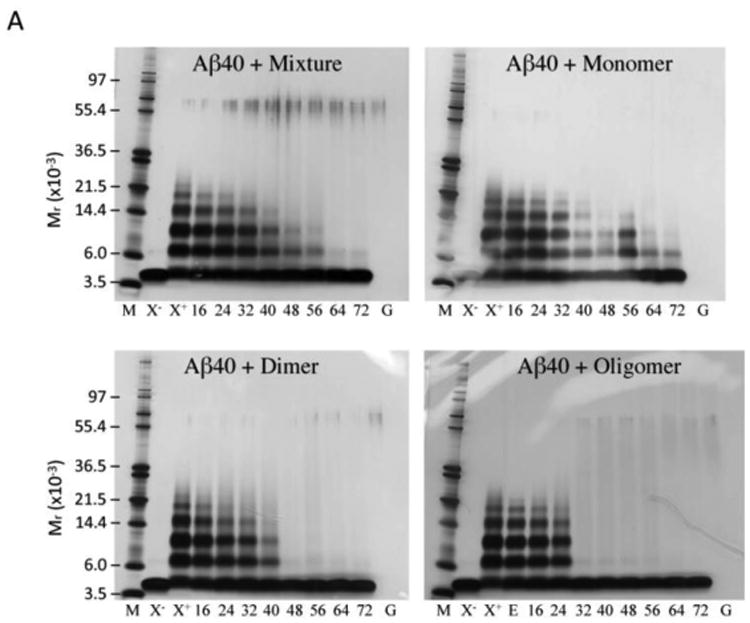
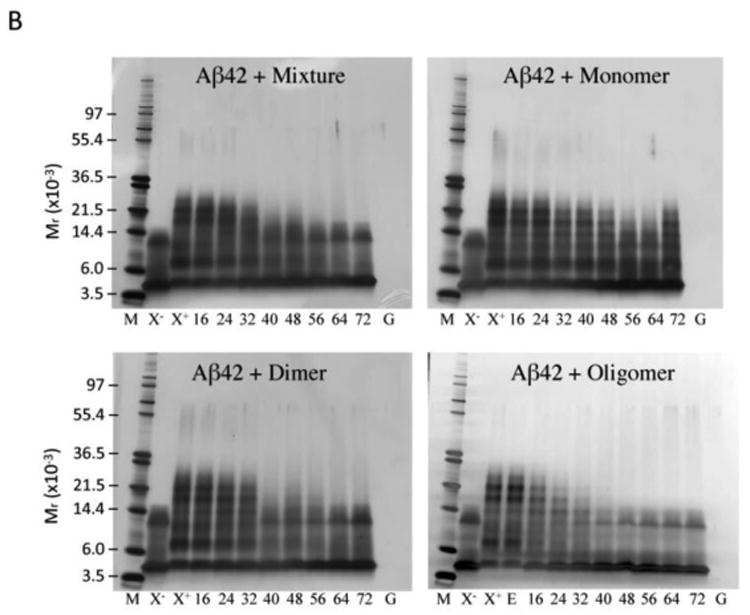
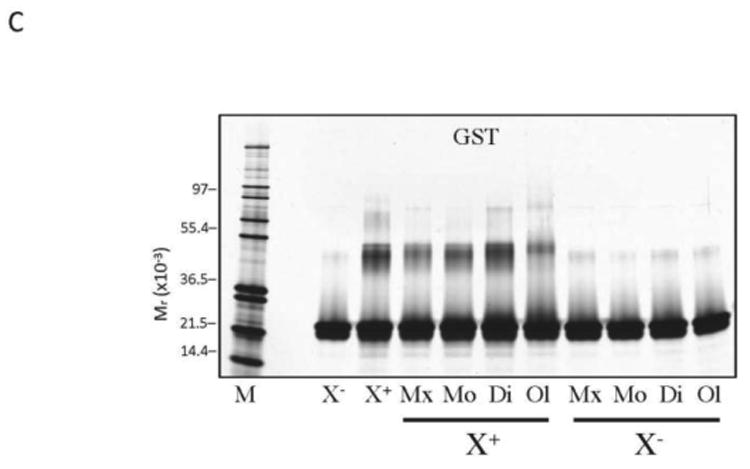
PICUP, SDS-PAGE, and silver staining were used to determine the oligomer size distributions of (A) Aβ40 and (B) Aβ42 with varying concentrations of GSPE mixture, monomer, dimer, or oligomer, as indicated. Lane abbreviations are: M, MW markers; X-, non-XL Aβ; X+, XL Aβ; E, XL Aβ with 0.1% (v/v) ethanol; Aβ40 XL with 16, 24, 32, 40, 48, 56, 64, and 72 μM GSPE, respectively; XL GSPE alone, 72 μM (G). (C) Glutathione S-transferase (GST) was used as a positive control for cross-linking. GST was mixed with equimolar GSPE mixture, monomer, dimer, or oligomer and then either was cross-linked (XL) or not cross-linked (non-XL).
The mixture, dimers, and oligomers were capable of inhibiting Aβ40 oligomerization essentially completely at concentrations <64 μM, <48 μM, and <32 μM, respectively. For all fractions tested, the amount of Aβ40 monomer showed a concentration-dependent increase as GSPE concentration increased, as would be expected if GSPE blocked monomer self-association or caused aggregate dissociation. We note that for GSPE oligomer only, 0.1% (v/v) ethanol was used to facilitate dissolution. For this reason, we determined if 0.1% ethanol by itself altered Aβ oligomerization. No effects were observed for either Aβ40 (Fig. 2A, E) or Aβ42 (Fig. 2B, E). We also note the presence of material with an Mr ≈ 58 kDa, which likely corresponds to keratin, an oft observed contaminant in SDS-PAGE (Ochs 1983). Densitometric analysis of the silver stained gels for each Aβ40-GSPE combination allowed calculation of IC50 values (Table 1). For Aβ40, GSPE oligomer was the most potent oligomerization inhibitor.
Table 1.
Effect of GSPE on Aβ40 oligomerization. IC50 values are reported for Aβ40 dimer through hexamer for each GSPE fraction tested. Values were determined by densitometry of cross-linked oligomer bands on silver stained gels.
| Aβ40 Oligomer | GSPE Fraction IC50 (μM) | |||
|---|---|---|---|---|
|
| ||||
| Mixture | Monomer | Dimer | Oligomer | |
| Dimer | 49 | 48 | 40 | 27 |
| Trimer | 40 | 40 | 34 | 26 |
| Tetramer | 33 | 36 | 34 | 23 |
| Pentamer | 41 | 26 | 34 | 26 |
| Hexamer | 8 | 8 | 16 | 7 |
Non-cross-linked Aβ42 displayed monomer and trimer bands (Fig. 2B, X). The Aβ42 trimer band is an SDS-induced artifact (Bitan et al. 2003). Cross-linked Aβ42 produced an oligomer distribution comprising monomers through octamers, with nodes at monomer, dimer, and pentamer/hexamer (Fig. 2B, X+). As with Aβ40, GSPE preparations produced concentration-dependent decreases in oligomerization. For all GSPE fractions, with the exception of GSPE monomer, concentrations <40 μM demonstrated essentially complete inhibition of Aβ42 oligomerization. With GSPE monomer, concentration-dependent inhibition of oligomerization was observed, but even at the highest monomer concentrations, the inhibition was incomplete. Aβ42 monomer and trimer bands showed a GSPE concentration-dependent increase in staining intensity in all samples, as would be expected because monomer and trimer are characteristic of non-cross-linked Aβ42 and indicate no oligomerization. Interestingly, the tetramer band intensities remained relatively consistent regardless of GSPE concentration. Determination of IC50 values (Table 2) revealed that oligomer was the most potent GSPE fraction, as was observed for Aβ40.
Table 2.
Effect of GSPE on Aβ42 oligomerization. IC50 values are reported for Aβ42 dimer, and pentamer through octamer for each GSPE fraction tested. (See text regarding omission of trimer and tetramer.) Values were determined by densitometry of cross-linked oligomer bands on silver stained gels.
| Aβ42 Oligomer | GSPE Fraction IC50 (μM) | |||
|---|---|---|---|---|
|
| ||||
| Mixture | Monomer | Dimer | Oligomer | |
| Dimer | 44 | -- | 35 | 21 |
| Pentamer | 32 | 45 | 38 | 35 |
| Hexamer | 32 | 40 | 33 | 27 |
| Heptamer | 24 | 30 | 22 | 24 |
| Octamer | 19 | 20 | 9 | 17 |
In theory, the inhibition of Aβ oligomerization could be an artifact resulting from GSPE interfering with the PICUP chemistry. To rule out this possibility, we studied the cross-linking of glutathione S-transferase (GST), a 26 kDa protein that has been used in the past as a positive control for the PICUP chemistry (Fig. 2C) (Fancy & Kodadek 1999). Non-cross-linked GST exhibited predominantly monomers, with some dimers. Cross-linking produced monomer and dimer bands, along with faint trimer and tetramer bands. No qualitative changes in GST cross-linking were observed in the presence of GSPE mixture, monomer, dimer, or oligomer when tested at a GSPE:protein ratio of 1:1 at 20 μM. Slightly more GST trimer and tetramer are observed when cross-linked in the presence of GSPE oligomer. GST:GSPE mixtures also were examined without cross-linking, and each displayed predominantly monomers and some dimers, similar to what was observed with GST alone. These results show that the GSPE did not have a significant effect on the PICUP chemistry.
Taken together, the data show: (1) the GSPE mixture and each fraction (monomer, dimer, and oligomer) are potent inhibitors of Aβ40 and Aβ42 oligomerization; (2) the oligomeric form of GSPE was the most potent inhibitor of Aβ oligomerization (lowest IC50); and (3) except for effects against Aβ40 pentamer and hexamer, the monomeric form of GSPE was least potent. We also note that if inhibition of oligomerization was incomplete, i.e., if low-order oligomers, and not just monomers, were present, larger assemblies formed upon incubation (Fig. 6).
Fig. 6. Electron microscopy of Aβ40 and Aβ42 with and without equimolar GSPE mixture, oligomer, dimer, or monomer.
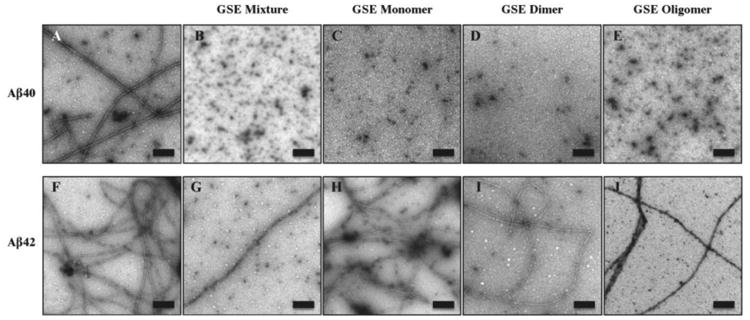
Transmission electron microscopy was performed after 14 days of incubation at 37°C. Amyloid fibrils are observed for Aβ40 and Aβ42 alone. In the presence of GSPE mixture, monomer, dimer, or oligomer, Aβ40 displayed globular structures, whereas Aβ42 displayed fibrils and small globular and amorphous assemblies. Panels shown are representative of the entire sample. Scale bar: 200 nm.
Aβ secondary structure dynamics
To monitor secondary structure during peptide assembly, circular dichroism spectroscopy (CD) was performed. In the absence of GSPE (Figs. 3A and B, “Aβ alone”), Aβ40 and Aβ42 initially displayed high statistical coil (SC) content, which was apparent from a prominent minimum between 195–200 nm and a monotonic increase in molar ellipticity as wavelength increased. A transition to mixed α/β conformation was observed after one day of incubation. This spectrum changed thereafter into one typical of β-sheet conformation, namely with a single minimum at ≈214 nm and a maximum below 200 nm. In contrast, when Aβ40 was treated with an equimolar amount of each GSPE fraction, the evolution of secondary structure did not occur in the same manner. Instead, mixed α/β structure was observed prior to the development of β-sheet and this structure remained until longer incubation times (e.g., see GSPE dimer at 3 d and GSPE monomer at 4 d) (Fig. 3A). The magnitude of the CD signal for incubations with the mixture and oligomer GSPE decreased compared to the spectrum without GSPE, suggesting a decreased amount of protein in solution. Nevertheless, the spectra were interpretable, yielding the observation that, for each condition, the protein-GSPE mixtures displayed spectra consistent with varying amounts of α-helix and β-sheet secondary structure.
Fig. 3. Effect of GSPE on the evolution of Aβ secondary structure.
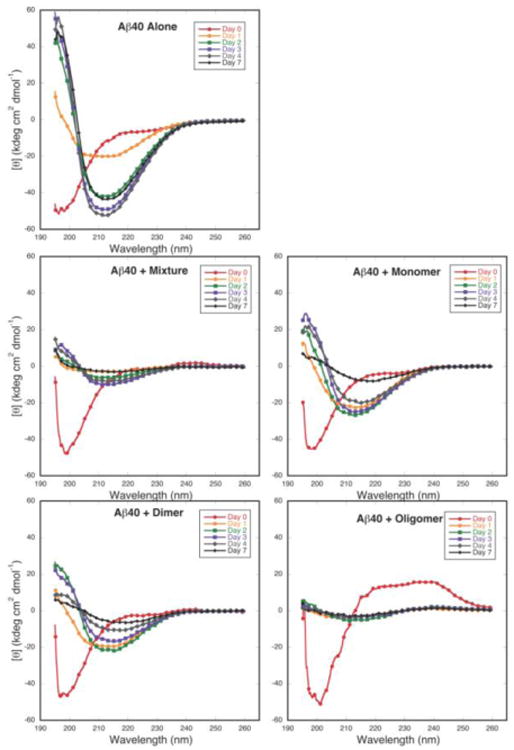
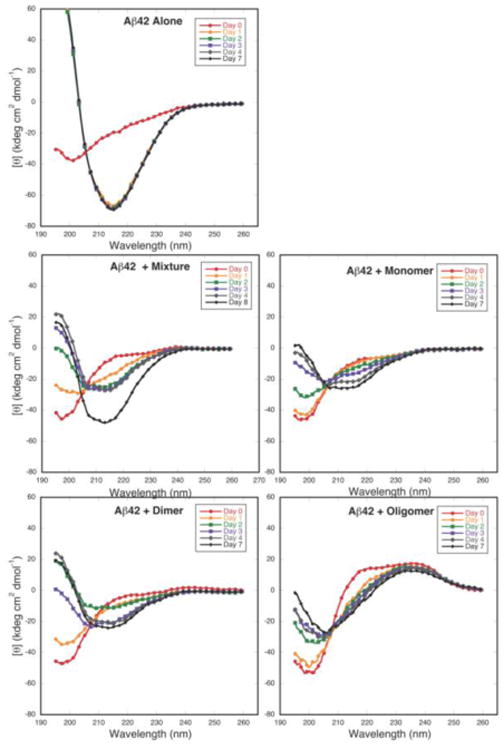
CD spectra of (A) Aβ40 and (B) Aβ42 alone, or with equimolar GSPE fractions, incubated at room temperature and monitored at 0 d (red circle), 1 d (orange circle), 2 d (green square), 3 d (purple square), 4 d (gray diamond), and 7 d (black diamond).
For Aβ42, each of the GSPE fractions inhibited SC →α/β transitions (Fig. 3B). By day 1, Aβ42 alone displayed a clear β-sheet spectrum with a minimum at 215 nm and a maximum at <195 nm, whereas in equimolar Aβ42:GSPE mixtures, each sample displayed nearly the same amount of SC signal intensity as seen initially. By 7 or 8 d, the spectra of Aβ42 incubated with GSPE mixture, dimer, or monomer remained constant. Inspection of these spectra indicated the formation of Aβ conformers containing both α-helical (minimum at ≈208 nm) and β-sheet (minimum at ≈214 nm) secondary structure. For Aβ42 incubated with GSPE oligomer, the spectrum at 7 d displayed a minimum at higher wavelengths compared to the initial spectrum with a minimum at 200 nm, suggesting an increase in non-SC structure.
GSPE and each of its component fractions thus prevented the SC→-β-sheet structural transition occurring during fibril formation. Preventing this transition could be beneficial clinically, assuming that any Aβ assemblies remaining were non-toxic. If one argues that the same biophysical effects observed in vitro occur in vivo, then the beneficial effects of GSPE administration observed in Tg2576 animals support a therapeutic mechanism involving Aβ assembly inhibition (Wang et al. 2008).
Time dependence of ThT fluorescence
Thioflavin T (ThT) fluorescence was used to monitor β-sheet formation, a proxy for fibril formation (Groenning 2010). Aβ40 and Aβ42 displayed an initial increase in fluorescence intensity that rose monotonically before leveling off (Figs. 4A and B). Incubation of 20 μM Aβ40 with equimolar amounts of GSPE reduced ThT intensity, indicating inhibition of β-sheet formation (Fig. 4A). Monomeric GSPE caused a substantial decrease in the initial rate of increase in fluorescence and in the final intensity of ThT fluorescence. Oligomeric GSPE caused the greatest decreases, whereas the mixture and dimeric GSPE fractions had intermediate effects. An identical rank order of GSPE effects was observed in studies on Aβ42 (Fig. 4B), namely oligomer > dimer ≈ mixture > monomer. However, the rates of increase in ThT fluorescence were ∼3-fold greater than those in the Aβ40 system.2
Fig. 4. Effect of GSPE fractions on the evolution of ThT fluorescence from Aβ.
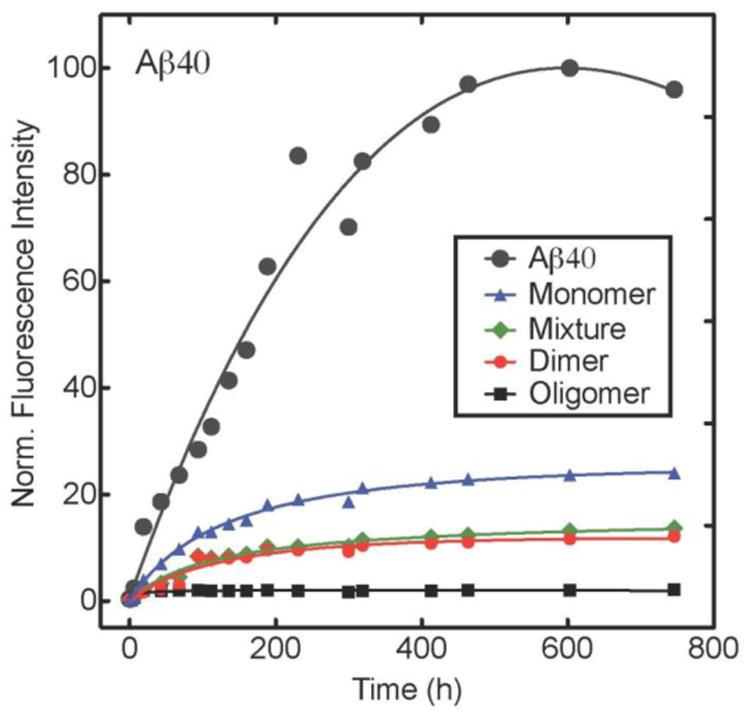
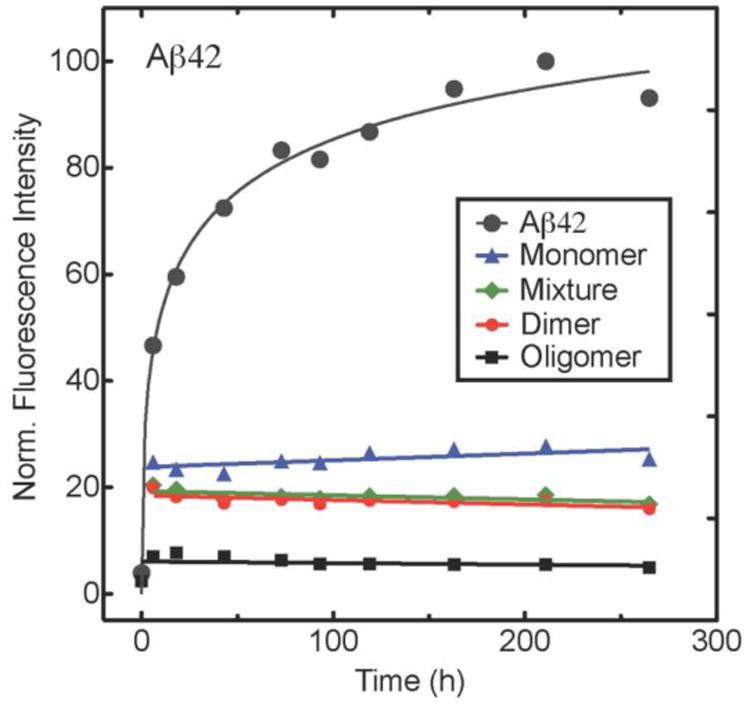
ThT fluorescence intensities were measured for (A) Aβ40 and (B) Aβ42 incubated alone, or with, GSPE fractions. Fluorescence intensities were normalized to the highest value for each experimental condition. Data shown are representative of each of 4 replicates for Aβ40 and 5 replicates for Aβ42.
Concentration-dependence of GSPE effects on ThT fluorescence of Aβ
The polyphenolic Aβ assembly inhibitors are, in at least one respect, a unique class of compounds because the chemical groups thought responsible for their activity, the phenolic hydroxyls, are present in significantly greater numbers than are the compounds themselves, i.e., the molar ratio of phenolic hydroxyls/polyphenol compound ≫1. The average MW of the monomer GSPE fraction is 10-fold less than the average MW of the oligomer fraction (280 vs. 2800), suggesting that the oligomers are formed by approximately 10 monomer subunits and thus contain 10-fold greater numbers of phenolic hydroxyls. This logic suggests that determination of inhibitory activity must consider not only molar concentration-dependence (mol/L), but number concentration of phenolic functionalities, which is proportional to mass concentration (g/L). However, studies of the “concentration-dependence” of Aβ assembly inhibitors most often use mono-functional inhibitors and a molar concentration (mol/L) metric (Ono et al. 2008, Orlando et al. 2012, Sinha et al. 2011).
Here, to elucidate the effects of size and functional group number on inhibitory activity, we determined the relative activities of each fraction as a function of molar concentration (mol/L) and mass concentration (g/L). The first method revealed activity in terms of number concentration of each polyphenolic compound, but did not address the question of total number of phenolic functional groups present or their structural arrangement. The second method revealed activity in terms of number concentration of phenolic groups, but not concentration of each compound on which the phenolic groups were present. Distinguishing the effects of these two variables is critical for understanding the mechanism of action of the polyphenolic inhibitors1.
To determine the molar concentration-dependence of GSPE inhibition of Aβ ThT fluorescence, we assayed GSPE fractions at concentrations of 0.1–100 μM, keeping the concentrations of Aβ40 and Aβ42 constant at 20 μM and 10 μM, respectively. The results are summarized in Fig. 5, in which we have plotted GSPE concentration versus the percent maximal fluorescence intensity that Aβ40 (Fig 5A) or Aβ42 (Fig 5B) reached in its plateau phase. All data sets were fit to a four parameter logistic equation to derive relative half-maximal inhibitory concentration (IC50) values for each GSPE fraction (See Fluorescence Spectroscopy in Materials and Methods).
Fig. 5. Concentration-dependence of inhibition of Aβ ThT fluorescence by GSPE.
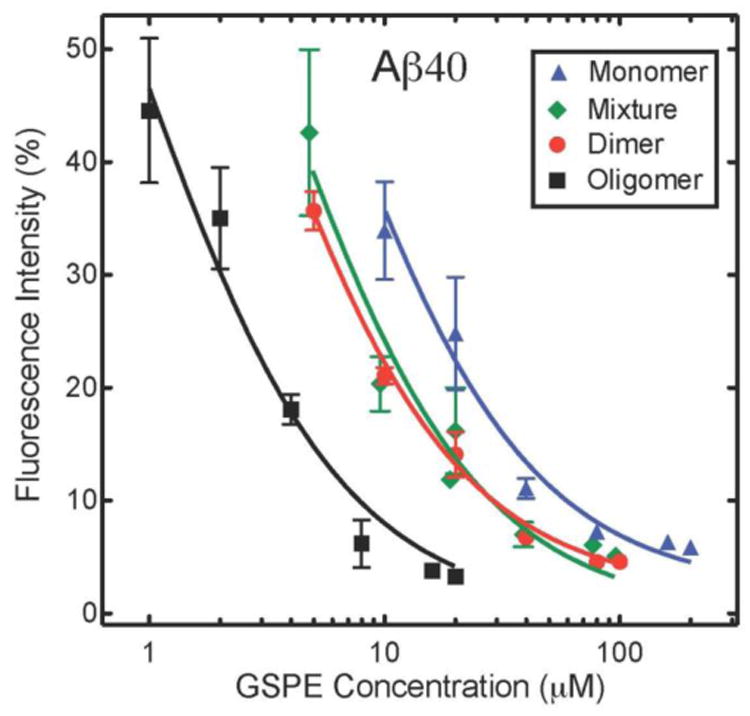
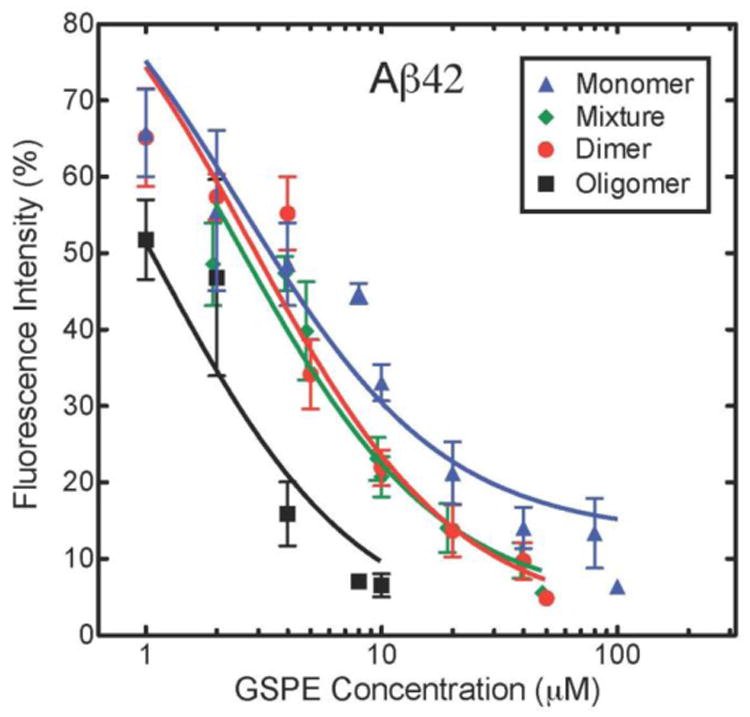
(A) Aβ40 and (B) Aβ42 were incubated with varying concentrations of GSPE mixture, oligomer, dimer, or monomer. Final ThT fluorescence intensities were measured for each sample and normalized to the corresponding Aβ40 or Aβ42 alone. The data herein were used to derive IC50 values (Table 3).
Oligomeric GSPE had the lowest IC50 value, 0.87 μM, with Aβ40, whereas monomeric GSPE had the highest value (5.3 μM) (Table 3). The GSPE mixture and dimer samples displayed intermediate IC50 values of 3.2 μM and 2.6 μM, respectively. These IC50 values are consistent with the rank order of inhibition of oligomerization observed in our PICUP experiments. For Aβ42, as for Aβ40, oligomeric GSPE had the lowest IC50. GSPE mixture, monomer, and dimer displayed similar IC50 values (2.4-2.8 μM; Table 3). These values were of the same order of magnitude as observed with Aβ40, with the notable exception that GSPE monomer was on the order of twice as effective an inhibitor of Aβ42 oligomerization, on a molar basis, than of Aβ40 oligomerization.
Table 3.
Effect of GSPE on Aβ aggregation. IC50 values (μM) are reported for Aβ40 (20 μM) and Aβ42 (10 μM) for each GSPE fraction tested. Values were determined by analysis of the ThT concentration-response curves for each condition at the final time-point measured. 95% confidence intervals are indicated in parentheses.
| Peptide | Mixture | Monomer | Dimer | Oligomer |
|---|---|---|---|---|
| Aβ40 | 3.2 (2.1- 4.8) | 5.3 (3.1- 8.8) | 2.6 (2.1- 3.3) | 0.87 (0.63- 1.2) |
| Aβ42 | 2.4 (1.7- 3.3) | 2.5 (1.7- 3.6) | 2.8 (2.1- 3.8) | 1.1 (0.68- 1.7) |
To determine the mass concentration-dependence of GSPE inhibition of Aβ ThT fluorescence, we determined the IC50 values in units of ng/L (Table 4). Interestingly, this method of analysis of Aβ40 inhibition revealed that monomer and dimer were equally and most inhibitory, whereas oligomer was least inhibitory, a result opposite to that observed considering inhibitor molarity (Table 3). For Aβ42, monomer also was the most effective inhibitor and oligomer was the least effective. We note that the monomer IC50 (0.7 ng/L) was significantly lower than in the Aβ40 system (1.5 ng/L) and was the lowest IC50 among all eight samples. Dimer and mixture samples showed mid-range IC50 values that were very similar (1.6 vs. 1.4 ng/L, respectively).
Table 4.
Effect of GSPE on Aβ aggregation. IC50 values in ng/L are reported for Aβ40 (20 μM) and Aβ42 (10 μM) for each GSPE fraction tested. Values were derived by converting the IC50 in μM from Table 3 into ng/L using the average MW determined for each GSPE fraction.
| Peptide | Mixture | Monomer | Dimer | Oligomer |
|---|---|---|---|---|
| Aβ40 | 1.9 | 1.5 | 1.5 | 2.4 |
| Aβ42 | 1.4 | 0.7 | 1.6 | 3.1 |
Assembly morphology
To determine the morphology of structures formed in the presence or absence of GSPE, transmission electron microscopy (TEM) was performed after 14 days incubation at 37°C. Straight and curved filaments were observed in untreated Aβ40 and Aβ42 (Fig. 6). These data were consistent with the strong β-strand content of the CD spectra observed at day 7 (Figs. 3A and B, Aβ Alone).
Aβ40 displayed globular structures ranging from 7-20 nm in diameter (presumably representing oligomers) and fibrils with widths ranging from 10-15 nm and lengths up to 1 μm (Fig. 6). When Aβ40 was treated with equimolar GSPE and its fractions, significantly fewer fibrils were observed. In Aβ40 samples treated with GSPE mixture, monomer, dimer, and oligomer fractions, globular structures were observed with diameters from 7-30 nm. These globular structures most frequently had diameters ≈ 20 nm.
Aβ42 displayed mostly fibrils, with widths of 9.5 ± 0.8 nm and lengths exceeding 2.6 μm, and globular structures ranging from 7-30 nm in diameter (average diameter ≈ 20 nm) (Fig. 6). Compared to Aβ42 alone, Aβ42 treated with GSPE mixture and each fraction showed an overall decrease in the amount of fibrils observed and an increase in the amount of globular assemblies ranging from 7-30 nm. The average width and morphology of Aβ42 fibrils did not change significantly in the presence of GSPE, though the density of fibrils was noticeably diminished in the presence of GSPE mixture, dimer, and oligomer. All GSPE fractions also caused increases in the number of amorphous assemblies, both for Aβ42 and for Aβ40 (data not shown).
A model of the action of GSPE components on Aβ assembly
The PICUP, ThT, and TEM data all show that both oligomer and fibril formation were inhibited by each GSPE fraction. GSPE appears to be a more potent inhibitor of Aβ40 fibril formation than of Aβ42 fibril formation. When the relative inhibitory potency of the different GSPE fractions is determined based upon equivalent masses (g/L), a rank order of monomer > dimer ≈ mixture > oligomer is observed. In contrast, the opposite rank order is observed when equivalent concentrations (M) of each fraction is considered. How can this apparent conundrum be explained? We cannot be sure, but we offer one reasonable hypothesis.
One set of our experiments compared equimolar concentrations of each GSPE fraction. If we consider only oligomer and monomer for the moment, this means that at any given concentration, the mass (g/L) of oligomer used was 10-fold greater than that of monomer. In addition, if we estimate an average of 5.5 OH groups per unit weight—the average number on catechin, epicatechin, epigallocatechin, and epicatechin gallate—then the oligomer preparation presented 10-fold more of these groups to the Aβ peptides in each such experiment than did the monomer fraction. Thus, it is not surprising that oligomers were the most potent inhibitors. Conversely, if the number of phenolic hydroxyl groups in each inhibitor preparation were equal, then the results therefrom cannot depend on absolute number of phenolic hydroxyl groups per se. Instead, the results should depend on the structure of the inhibitor examined.
Eisenberg et al. have sought an answer to the question of how assembly inhibitors bind to Aβ. To do so, they determined the X-ray crystallographic structures of amyloid forming segments of Aβ and Tau in complex with small molecules. They proposed a model of interaction wherein various aromatic compounds, such as polyphenols, would bind to a variety of amyloid-forming sequences within a cylindrical, partially apolar cavity between the pairs of β-sheets forming the fibers, which can also be present in oligomeric structures of Aβ (Landau et al. 2011). If we consider this model with respect to our finding that GSPE monomer is the most potent inhibitor of Aβ assembly (when equal weights of GSPE are compared), then the low inhibitory activity of GSPE polymers could be due to their size, which precludes their accessing these cavities between β-sheets.
To visualize potential binding modes of GSPE and Aβ40, we created models of complexes formed between Aβ40 (Vivekanandan et al. 2011) and GSPE monomer, dimer, or oligomer (Figs. 7 and 8). GSPE monomer and dimer were docked to a partially structured Aβ40 (PDB entry: 2LFM) (Vivekanandan et al. 2011) using SwissDock. GSPE oligomer has been placed in one possible binding location for comparison. Figs. 7A and C allow comparison of binding modes for equal moles of monomer and oligomer. Figs. 7B and C allow comparison of binding modes for equal weights of monomer and oligomer. Four monomers can explore a larger percentage of the Aβ surface than can the single oligomer because of the lack of conformational freedom imposed on the latter structure by its rigidity. A useful metaphor for this idea is the relative numbers of intermolecular contacts possible between a sphere exploring the uneven Aβ surface versus a plane exploring the surface. The sphere can make many more contacts than can the plane because it can contact surfaces within relatively small depressions that the plane is precluded from accessing because of its planar geometry.
Fig. 7. GSPE:Aβ interactions.
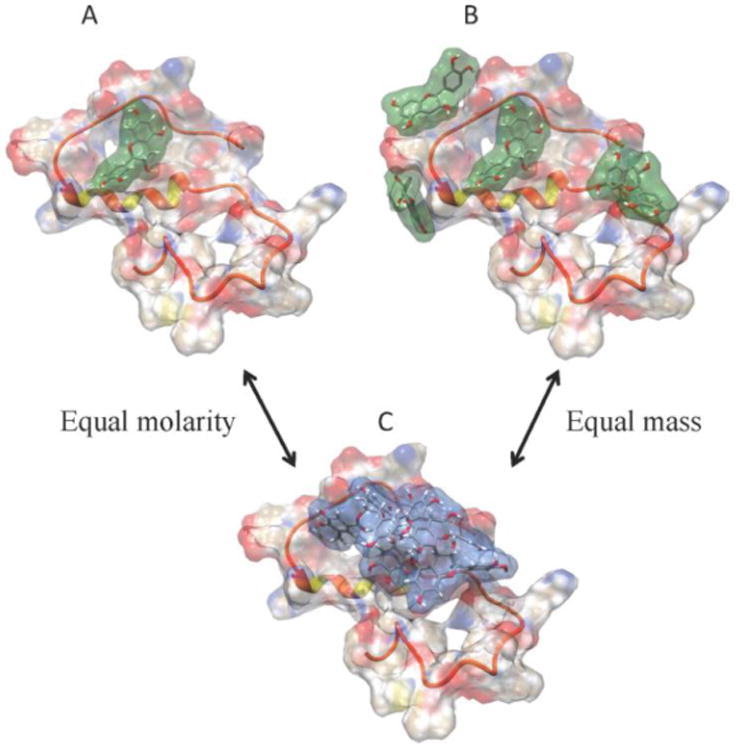
A model of GSPE:Aβ interactions was created to illustrate the potential differences between systems in which GSPE fractions were studied at equimolar concentrations or at equal weight concentrations. A partially folded Aβ40 structure derived using solution-state NMR (PDB: 2LFM) is shown as a semi-transparent surface where red represents negative charges near the surface and blue represents positively charges. The white regions correspond to essentially neutral potentials. The protein backbone is displayed using ribbon representation. GSPE monomer (green) or oligomer (blue) are shown as stick structures, in which red represents oxygen and white represents hydrogen. Panels are: (A) A single monomer docked to Aβ 40; (B) four monomers docked to Aβ40; and (C) a single oligomer docked to Aβ40. Comparison between (A) and (C) illustrates equal molarity of GSPE's whereas comparison between (B) and (C) illustrates equal masses of GSPEs.
Fig. 8. Models of complexes between Aβ40 and GSPE monomers, dimers or oligomers.
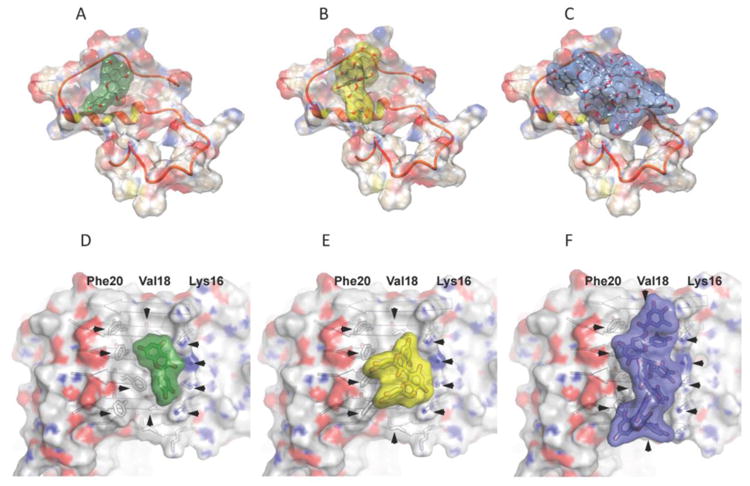
Panels are: (A) docked monomer, (B) docked dimer, and (C) docked oligomer. The peptide backbone is illustrated as in orange and red. Panels D-F show the monomer (D), dimer (E), and oligomer (F) interacting with backbone atoms of an Aβ fibril. Fibril side-chains are shown in grey and extend from β-strands oriented equatorially relative to the fibril axis. Hydroxyl groups form hydrogen bonds to Lys16 of Aβ. Apolar interactions may occur among the aromatic rings of GSPE and the hydrophobic patches formed by Val18 and Phe20 of Aβ.
We also explored the ability of GSPE monomer, dimer, and oligomer to interact with a fibril model (PDB entry: 2LMO) (Petkova et al. 2006) of Aβ using Rosetta docking simulations, as described previously (Jiang et al. 2013). These interactions are shown in Figs. 8D-F, along with the surface binding modes shown in Fig. 7A for comparison (Figs. 8A-C). Interatomic interactions on the face of a fibril model are shown in Supplemental Fig. 2. Here, interactions are observed between the GSPE molecules and the side chains of Phe20, Val18, and Lys16 on Aβ. GSPE hydroxyl groups form hydrogen bonds to Lys16. The surface representation highlights complimentary apolar interactions between the aromatic rings of GSPE and the hydrophobic patches formed by Val18 and Phe20 of Aβ.
The interaction of the GSPE monomer with Lys16, Val18, and Phe20 is similar to that observed in co-crystals of Orange G bound to the KLVFFA fibril forming segment of Aβ (Landau et al. 2011). Here, Orange G is bound internally to the steric zipper, corresponding to residues 16-21 of Aβ, and displays polar interactions with Lys16 and hydrophobic interactions with Leu17, Val18, Phe19, and Phe20. In the case of the GSPE dimer, binding interactions are also similar to those of Landau et al. (Landau et al. 2011) but the relative energy contributions of polar and hydrophobic interactions differ. The fibril binding of GSPE dimer is stabilized mainly through hydrophobic interactions with Val 18 and 20, while polar hydrogen bonding to Lys 16 is poor because its hydrogen bond geometry is not ideal.
Our studies emphasize the importance of considering how the molecular weight of each GSPE fraction might affect its potential therapeutic utility in vivo, where the blood-brain barrier is involved in controlling the permeability of molecules into the brain (Wang et al. 2012). The monomer fraction is able to cross the blood brain barrier (Wang et al. 2012) and a metabolite of the GSPE monomer promoted basal synaptic transmission and long-term potentiation at physiologic concentrations in hippocampal slices (Wang et al. 2012). Indeed, GSPE proanthocyanidins are absorbed in the gastrointestinal tract and display no toxicity in rats at a 2.5% (w/w) concentration. GSPE monomer does appear to have greater bioavailability relative to larger GSPE components (Bentivegna & Whitney 2002, Ferruzzi et al. 2009, Wang et al. 2012). Taken together with the fact that monomers appear to be the most effective Aβ assembly inhibitors, as shown in the studies presented in this manuscript, monomers appear to be the most promising form of GSPE for clinical study.
Methods
Chemicals and Reagents
Chemicals were obtained from Sigma-Aldrich Co. and were of the highest purity available. MegaNatural-AZ® (Polyphenolics, Madera, CA) comprises a mixture of polyphenolic compounds that has an average molecular weight of 580. High performance liquid chromatography (HPLC) produces fractions composed of compounds of average molecular weight 280, 560, and 2800, representing 8%, 75%, and 17%, respectively, of the total material (Pasinetti et al. 2010, Wang et al. 2008). For simplicity, we refer to these three fractions as “monomer,” “dimer,” and “oligomer,” respectively, although each fraction is not a homogeneous population of molecules of a single molecular weight. Stock solutions of GSPE monomers, dimers and GSPE mixture were solubilized at a concentration of 1 mM in 10 mM sodium phosphate buffer, pH 7.5. GSPE oligomers were first solubilized at 1 mM in 1% (v/v) ethanol in 10 mM sodium phosphate buffer, pH 7.5, and then diluted to 0.1% (v/v) ethanol in the same buffer.
Preparation of Aβ
Aβ was synthesized in the UCLA Biopolymer facility and then purified and characterized, as described previously (Walsh et al. 1997). Briefly, peptide synthesis was performed on an automated peptide synthesizer (model 433A, Applied Biosystems, Foster City, CA) using 9-fluorenylmethoxycarbonyl-based methods on preloaded Wang resins. Peptides were purified using reverse-phase high-performance liquid chromatography (HPLC). Quantitative amino acid analysis and mass spectrometry yielded the expected compositions and molecular weights, respectively, for each peptide. Purified peptides were stored as lyophilizates at −20 °C. Peptides were prepared by reconstituting lyophilized peptide in a 1:4.5:4:5 ratio of 60 mM NaOH:Milli-Q water:22.2 mM sodium phosphate, pH 7.5, to yield a nominal Aβ concentration of 1 mg/mL in 10 mM sodium phosphate, pH 7.5. The peptide solution then was sonicated for 1 min in a bath sonicator (Branson Model 1510, Danbury, CT) and filtered through a 30,000 molecular weight cut-off Microcon centrifugal filter device (Millipore, Billerica, MA) for 15 min at 16,000 × g. The eluate containing Aβ was quantified through UV absorbance (ε280=1280 cm-1 M-1 ) using a 1 cm quartz cuvette (Hellma, Plainview, NY) and a Beckman DU-640 spectrophotometer (Beckman Instruments, Fullerton, CA). All measurements were performed at room temperature (22 °C). This protocol reproducibly yields aggregate-free Aβ monomer in rapid equilibrium with low order oligomers, which is termed “low molecular weight” (LMW) Aβ (Teplow 2006).
Photo induced cross-linking of unmodified proteins (PICUP)
Immediately after preparation, LMW Aβ solutions were diluted to 80 μM, mixed with the GSPE fraction of interest (diluted to 16-72 μM), and cross-linked using the PICUP method, as described (Bitan et al. 2001). Briefly, 1 μL of 2 mM Tris(2,2′-bipyridyl)dichlororuthenium(II) hexahydrate (Ru(bpy)) and 1 μL of 40 mM ammonium persulfate (APS) were added to 18 μL of protein solution. The final Aβ:Ru(bpy):APS molar ratios were 0.72:1:20. The mixture was irradiated for 1 s with a “Fiber-Lite” high intensity visible light source (Dolan-Jenner, Boxborough, MA) and the reaction then was immediately quenched with 1 μL of 1 M dithiothreitol (DTT) in water. SDS-PAGE and silver staining were used to determine the frequency distribution of Aβ oligomers after incubation with GSPE. To do so, 21 μL of each cross-linked sample was mixed with 21 μL of 2× SDS sample buffer and then boiled for 10 min. Thereafter, 5 μL of each sample was electrophoresed on a 10-20% gradient Tricine gel (Invitrogen, Carlsbad, CA) and visualized by silver staining (SilverXpress, Invitrogen). Non-cross-linked samples were used as controls in each experiment. Glutathione S-transferase (GST) (Sigma-Aldrich, St. Louis, MO) was used as a control for the PICUP chemistry (Ono et al. 2008). GST was dissolved in 10 mM sodium phosphate buffer, pH 7.4, at a concentration of 40 μM. For PICUP, GST was diluted to 20 μM in 10 mM phosphate buffer, pH 7.4, either alone or with 20 μM of each GSPE fraction. PICUP then was performed as described above.
Silver stained gels were scanned on a Canon CanoScan 9950 flatbed scanner. Images were converted to 256 grayscale and analyzed densitometrically by ImageJ 1.43r (http://imagej.nih.gov/ij/). Density profiles were determined by integration of the area under each peak, after baseline correction. Individual peak densities within a lane then were normalized to the total baseline-corrected peak area within that lane.
Circular dichroism spectroscopy (CD)
CD spectra of Aβ alone, or of Aβ with equimolar GSPE fractions, were acquired immediately after sample preparation or following 1, 2, 3, 4, 7, or 8 days of incubation. Forty μM Aβ40 was incubated in 1 mm path length quartz cuvettes (Hellma, Forest Hills, NY) at 22°C with constant end-over-end rotation (Appropriate Technical Resources, Laurel, MD). Twenty-five μM Aβ42 also was incubated in 1 mm path length quartz cuvettes, but at 37°C and without rotation. CD spectra were acquired with a J-810 spectropolarimeter (JASCO, Tokyo, Japan). Following temperature equilibration, spectra were recorded at 22°C from 195–260 nm at 0.2 nm resolution with a scan rate of 100 nm/min. Ten scans were acquired and averaged for each sample. Buffer spectra, or spectra of the relevant GSPE fraction in buffer, were subtracted from experimental spectra prior to data analysis. We note that only the GSPE oligomer fraction produced a spectrum with significant intensity, especially below 200 nm.
Thioflavin T fluorescence
Aβ mixed with each GSPE fraction was incubated at 37 °C in 96-well microtiter plates (Thermo Scientific, Rochester, NY) with 250 rpm orbital shaking. This method produced accelerated fibril formation without an observable lag phase. ThT fluorescence measurements were acquired with a Synergy HT fluorometer (BioTek, Beijing, China) with an excitation wavelength of 420 nm and an emission wavelength of 485 nm, each with 10 nm slit widths. ThT (2× Aβ concentration) fluorescence intensities were measured immediately after sample preparation and periodically for up to one month thereafter. To ensure that the GSPE fractions did not interfere with the ThT measurements using 420 nm excitation, optical absorption of each GSPE fraction was measured, and no significant absorption was observed above 250 nm.
Aβ40 (20 μM) was incubated with GSPE fractions of 4.8-200 μM concentration. Experiments were done in triplicate or higher replication number, except at the highest concentrations tested for GSPE mixture (77 and 96 μM), oligomer (16 μM), dimer (80 and 100 μM), and monomer (160 and 200 μM), where one replicate made clear the trend of nearly complete inhibition. Aβ42 (10 μM) was incubated with GSPE fractions of 0.48-100 μM concentration.
GraphPad Prism was used for graphing and analysis of the ThT fluorescence data. At the lowest GSPE concentrations examined (4.8 μM for Aβ40 and 0.48 μM for Aβ42), we observed ThT intensities of ∼45% (Aβ40) and ∼65% (Aβ42) of the control intensity, indicating inhibition even at these low concentrations. The half-maximal inhibitory concentration (IC50) for each GSPE fraction was determined using the general form of the four parameter logistic IC50 equation y=min+(max-min)/(1+10(x-logIC50)h); where y is normalized fluorescence intensity (%), min is the lowest normalized fluorescence intensity observed (%), max is set to 100%, x is log (GSPE concentration [in μM]), and the Hill slope parameter h was set to -1, indicating a downward trajectory (Turner & Charlton 2005).
Transmission electron microscopy (TEM)
Ten μL of Aβ40 (20 μM) or Aβ42 (10 μM), with or without equimolar GSPE, was spotted onto a carbon-coated Formvar grid (Electron Microscopy Sciences, Hatfield, PA) and incubated for 2 min. The droplet then was displaced with an equal volume of 1% (w/v) filtered (0.2 μM) uranyl acetate in water (Electron Microscopy Sciences). This solution was wicked off and then the grid was air-dried. Samples were examined in an operator-blinded fashion, using a JEOL 1200 EX transmission electron microscope with an accelerating voltage of 80 kV. Digital images were analyzed with ImageJ 1.43r, using the “measure tool” to calculate dimensions.
Modeling of interactions between GSPE and Aβ aggregates
Three-dimensional construction of GSPE (monomer, dimer and oligomer) models
The 3D structural model of GSPE monomer (catechin) is from the ZINC database (entry: 119983) (http://zinc.docking.org/) and from the Chemical Database Service(Fletcher et al. 1996). We built the GSPE dimer and oligomer with Weblab Viewer Pro (Accelrys, San Diego), based on the structure of GSPE monomer. Additional polyphenol moieties (epicatechin, epigallocatechin, and epicatechin gallate) and all hydrogen atoms were added according to the chemical structures of GSPE dimer and oligomer, respectively (Fig. S1). The configuration at the chiral center of each model was carefully inspected and corrected. Finally, the entire GSPE dimer and oligomer structures were iteratively minimized using the “Clean” feature of Weblab Viewer Pro.
Modeling interactions
A partially folded Aβ40 structure derived using solution-state NMR (Vivekanandan et al. 2011) (PDB entry: 2LFM) was used to model Aβ interactions with the catechin monomer, dimer, and oligomer. SwissDock is a tool that can search for possible protein and small molecule interactions (Kumar et al. 2013, Gazova et al. 2013). Here, SwissDock (Grosdidier et al. 2011b, Grosdidier et al. 2011a) was used to predict possible molecular interactions between Aβ 40 and GSPE monomers or dimers. SwissDock parameters included: (1) the region of interest was not defined; (2) the docking type was set to “accurate;” and (3) flexibility was allowed for side chains within 3Å of any atom of the ligand in its reference-binding mode. SwissDock could not successfully dock the GSPE oligomer to Aβ. Therefore, for illustrative purposes only, we manually positioned the GSPE oligomer on the Aβ structure.
Computational docking of GSPE onto Aβ fibril model
We used an Aβ fibrillar structure from a solid-state NMR fibril model of full-length Aβ (PDB entry: 2LMO) (Petkova et al. 2006). Each GSPE molecule was prepared for Rosetta docking simulations, as described previously (Jiang et al. 2013). The ensemble of ligand internal conformations near the starting conformation of each molecule was built by perturbing a small deviation (±5°) of torsion angle for each rotatable bond of the ligand. Approximately 100 conformations for each ligand were generated and made available for the Rosetta docking simulation. We used a modified Rosetta LigandDock algorithm with near-“native” perturbation sampling for both protein side-chain conformations and ligand internal conformations (Jiang et al. 2013). Each GSPE molecule (monomer, dimer, or oligomer) was docked onto the Aβ fibrillar structure with 1000 docking simulations. The final docked models were selected based on largest predicted binding energy (Meiler & Baker 2006, Davis & Baker 2009) and best shape complementarity (Lawrence & Colman 1993). The predicted binding energy and physically meaningful energy terms (Lennard-Jones interactions, solvation, hydrogen bonding, and electrostatics) of the selected models are compared in Supplementary Table 1.
Supplementary Material
Acknowledgments
We thank Dr. Zhefeng Gou for helpful discussions. This work as supported by grants from the UCLA Chemistry-Biology Interface (CBI) Training Program, UCLA Training Program in Neural Repair, Jim Easton Consortium for Alzheimer's Drug Discovery and Biomarkers at UCLA, and NIH grants AG027818, NS038328, and AG041295. This study was supported in part through support from the NCCIH Center Grant 1PO1AT004511-031 to GMP. Dr. Pasinetti holds a Career Scientist Award in the Research and Development unit and is the Director of the Basic and Biomedical Research and Training Program, GRECC, James J. Peters Veterans Affairs Medical Center. We acknowledge that the contents of this article do not represent the views of the U.S. Department of Veterans Affairs or the United States Government. Drs. Pasinetti, Wang and Ho are named inventors on a patent filed through the Icahn School of Medicine at Mount Sinai for the use of grape-seed extract for the treatment of Alzheimer's disease and other neurodegenerative disorders. Drs. Pasinetti, Wang and Ho are entitled to receive royalties from this invention.
Abbreviations
- Aβ
Amyloid β-protein
- AD
Alzheimer's disease
- GSPE
grape seed polyphenolic extract
- HPLC
high-performance liquid chromatography
- LMW
“low molecular weight”
- Ru(bpy)
Tris(2,2′-bipyridyl)dichlororuthenium(II) hexahydrate
- DTT
Dithiothreitol
- ThT
Thioflavin T
- CD
Circular dichroism
- TEM
Transmission electron microscopy
- IC50
half-maximal inhibitory concentration
- PICUP
Photo induced cross-linking of unmodified proteins
- APS
ammonium persulfate
- GST
Glutathione S-transferase
- SC
statistical coil
Footnotes
Author Contributions: EYH, GY, SB and BC carried out the experiments. EYH, GY, SB and DBT wrote the manuscript. MK and LJ carried out the docking and model building. LH, JW and GMP provided the fractionated GSPE. EYH, GY, GMP and DBT designed the studies. All authors have given approval of the final version of the manuscript.
The term “monomer” refers to a single polyphenol-containing molecule, not to a single phenolic functional group. The simplest polyphenol is benzenediol (dihydroxybenzene), containing two hydroxyl groups. A typical monomer present in our GSPE preparation might contain 21 phenolic hydroxyl groups, thus a 1 M concentration of this monomer would be 21 M in phenol functional groups. Oligomers would contain proportionately higher numbers of phenolic groups. Further, “monomer” comprises a variety of phenolic molecules with similar Stoke's radii.
Based on the orthogonal data showing the inhibition of fibril formation by CD and TEM (see TEM section and Fig. 6), and the ThT concentration dependence data described below, we are confident that the decrease in ThT signal indicates fewer amyloid fibrils—not merely an artefactual decrease due to GSPE interacting with the fluorophore.
References
- Alzheimer's Disease International. London: 2009. World Alzheimer Report 2009. [Google Scholar]
- Bentivegna SS, Whitney KM. Subchronic 3-month oral toxicity study of grape seed and grape skin extracts. Food and chemical toxicology : an international journal published for the British Industrial Biological Research Association. 2002;40:1731–1743. doi: 10.1016/s0278-6915(02)00155-2. [DOI] [PubMed] [Google Scholar]
- Bitan G, Kirkitadze MD, Lomakin A, Vollers SS, Benedek GB, Teplow DB. Amyloid β-protein (Aβ) assembly: Aβ40 and Aβ42 oligomerize through distinct pathways. Proc Natl Acad Sci U S A. 2003;100:330–335. doi: 10.1073/pnas.222681699. [DOI] [PMC free article] [PubMed] [Google Scholar]
- Bitan G, Lomakin A, Teplow DB. Amyloid β-protein oligomerization: Prenucleation interactions revealed by photo-induced cross-linking of unmodified proteins. J Biol Chem. 2001;276:35176–35184. doi: 10.1074/jbc.M102223200. [DOI] [PubMed] [Google Scholar]
- Brookmeyer R, Johnson E, Ziegler-Graham K, Arrighi HM. Forecasting the global burden of Alzheimer's disease. Alzheimers Dement. 2007;3:186–191. doi: 10.1016/j.jalz.2007.04.381. [DOI] [PubMed] [Google Scholar]
- Cummings JL. Alzheimer's disease. N Engl J Med. 2004;351:56–67. doi: 10.1056/NEJMra040223. [DOI] [PubMed] [Google Scholar]
- Davis IW, Baker D. RosettaLigand docking with full ligand and receptor flexibility. Journal of molecular biology. 2009;385:381–392. doi: 10.1016/j.jmb.2008.11.010. [DOI] [PubMed] [Google Scholar]
- Dorozynski A. Wine may prevent dementia. Br Med J. 1997;314:997. [PMC free article] [PubMed] [Google Scholar]
- Fancy DA, Kodadek T. Chemistry for the analysis of protein–protein interactions: Rapid and efficient cross-linking triggered by long wavelength light. Proc Natl Acad Sci U S A. 1999;96:6020–6024. doi: 10.1073/pnas.96.11.6020. [DOI] [PMC free article] [PubMed] [Google Scholar]
- Ferruzzi MG, Lobo JK, Janle EM, et al. Bioavailability of gallic acid and catechins from grape seed polyphenol extract is improved by repeated dosing in rats: implications for treatment in Alzheimer's disease. J Alzheimers Dis. 2009;18:113–124. doi: 10.3233/JAD-2009-1135. [DOI] [PMC free article] [PubMed] [Google Scholar]
- Flamini R. Mass spectrometry in grape and wine chemistry. Part I: polyphenols. Mass Spectrom Rev. 2003;22:218–250. doi: 10.1002/mas.10052. [DOI] [PubMed] [Google Scholar]
- Fletcher DA, McMeeking RF, Parkin D. The United Kingdom Chemical Database Service. J Chem Inf Comp Sci. 1996;36:746–749. [Google Scholar]
- Gazova Z, Siposova K, Kurin E, Mucaji P, Nagy M. Amyloid aggregation of lysozyme: the synergy study of red wine polyphenols. Proteins. 2013;81:994–1004. doi: 10.1002/prot.24250. [DOI] [PubMed] [Google Scholar]
- Groenning M. Binding mode of Thioflavin T and other molecular probes in the context of amyloid fibrils-current status. J Chem Biol. 2010;3:1–18. doi: 10.1007/s12154-009-0027-5. [DOI] [PMC free article] [PubMed] [Google Scholar]
- Grosdidier A, Zoete V, Michielin O. Fast docking using the CHARMM force field with EADock DSS. Journal of computational chemistry. 2011a;32:2149–2159. doi: 10.1002/jcc.21797. [DOI] [PubMed] [Google Scholar]
- Grosdidier A, Zoete V, Michielin O. SwissDock, a protein-small molecule docking web service based on EADock DSS. Nucleic acids research. 2011b;39:W270–277. doi: 10.1093/nar/gkr366. [DOI] [PMC free article] [PubMed] [Google Scholar]
- Hardy JA, Higgins GA. Alzheimer's disease: the amyloid cascade hypothesis. Science. 1992;256:184–185. doi: 10.1126/science.1566067. [DOI] [PubMed] [Google Scholar]
- Ho L, Yemul S, Wang J, Pasinetti G. Grape seed polyphenolic extract as a potential novel therapeutic agent in tauopathies. J Alzheimers Dis. 2009;16:433–439. doi: 10.3233/JAD-2009-0969. [DOI] [PMC free article] [PubMed] [Google Scholar]
- Jiang L, Liu C, Leibly D, Landau M, Zhao M, Hughes MP, Eisenberg DS. Structure-based discovery of fiber-binding compounds that reduce the cytotoxicity of amyloid beta. eLife. 2013;2:e00857. doi: 10.7554/eLife.00857. [DOI] [PMC free article] [PubMed] [Google Scholar]
- Kirkitadze MD, Condron MM, Teplow DB. Identification and characterization of key kinetic intermediates in amyloid β-protein fibrillogenesis. Journal of molecular biology. 2001;312:1103–1119. doi: 10.1006/jmbi.2001.4970. [DOI] [PubMed] [Google Scholar]
- Klein WE. Cytotoxic intermediates in the fibrillation pathway: Aβ oligomers in Alzheimer's disease as a case study. In: Uversky VN, Fink AL, editors. Part A: Protein Misfolding, Aggregation, and Conformational Diseases. Vol. 4. Springer; New York: 2006. pp. 61–75. [Google Scholar]
- Kumar V, Kumar CS, Hari G, Venugopal NK, Vijendra PD, B GB. Homology modeling and docking studies on oxidosqualene cyclases associated with primary and secondary metabolism of Centella asiatica. SpringerPlus. 2013;2:189. doi: 10.1186/2193-1801-2-189. [DOI] [PMC free article] [PubMed] [Google Scholar]
- Landau M, Sawaya MR, Faull KF, Laganowsky A, Jiang L, Sievers SA, Liu J, Barrio JR, Eisenberg D. Towards a pharmacophore for amyloid. PLoS Biol. 2011;9:e1001080. doi: 10.1371/journal.pbio.1001080. [DOI] [PMC free article] [PubMed] [Google Scholar]
- Lawrence MC, Colman PM. Shape complementarity at protein/protein interfaces. Journal of molecular biology. 1993;234:946–950. doi: 10.1006/jmbi.1993.1648. [DOI] [PubMed] [Google Scholar]
- Letenneur L, Dartigues JF, Orgogozo JM. Wine consumption in the elderly. Ann Intern Med. 1993;118:317–318. doi: 10.7326/0003-4819-118-4-199302150-00028. [DOI] [PubMed] [Google Scholar]
- Meiler J, Baker D. ROSETTALIGAND: protein-small molecule docking with full side-chain flexibility. Proteins. 2006;65:538–548. doi: 10.1002/prot.21086. [DOI] [PubMed] [Google Scholar]
- Ochs D. Protein contaminants of sodium dodecyl sulfate-polyacrylamide gels. Anal Biochem. 1983;135:470–474. doi: 10.1016/0003-2697(83)90714-5. [DOI] [PubMed] [Google Scholar]
- Ono K, Condron MM, Ho L, Wang J, Zhao W, Pasinetti GM, Teplow DB. Effects of grape seed-derived polyphenols on amyloid β-protein self-assembly and cytotoxicity. J Biol Chem. 2008;283:32176–32187. doi: 10.1074/jbc.M806154200. [DOI] [PMC free article] [PubMed] [Google Scholar]
- Orgogozo JM, Dartigues JF, Lafont S, Letenneur L, Commenges D, Salamon R, Renaud S, Breteler MB. Wine consumption and dementia in the elderly: a prospective community study in the Bordeaux area. Rev Neurol (Paris) 1997;153:185–192. [PubMed] [Google Scholar]
- Orlando RA, Gonzales AM, Royer RE, Deck LM, Vander Jagt DL. A chemical analog of curcumin as an improved inhibitor of amyloid Abeta oligomerization. PLoS One. 2012;7:e31869. doi: 10.1371/journal.pone.0031869. [DOI] [PMC free article] [PubMed] [Google Scholar]
- Pasinetti GM, Ksiezak-Reding H, Santa-Maria I, Wang J, Ho L. Development of a grape seed polyphenolic extract with anti-oligomeric activity as a novel treatment in progressive supranuclear palsy and other tauopathies. J Neurochem. 2010;114:1557–1568. doi: 10.1111/j.1471-4159.2010.06875.x. [DOI] [PMC free article] [PubMed] [Google Scholar]
- Petkova AT, Yau WM, Tycko R. Experimental constraints on quaternary structure in Alzheimer's beta-amyloid fibrils. Biochemistry. 2006;45:498–512. doi: 10.1021/bi051952q. [DOI] [PMC free article] [PubMed] [Google Scholar]
- Roychaudhuri R, Yang M, Hoshi MM, Teplow DB. Amyloid β-protein assembly and Alzheimer disease. J Biol Chem. 2009;284:4749–4753. doi: 10.1074/jbc.R800036200. [DOI] [PMC free article] [PubMed] [Google Scholar]
- Sharma V, Zhang CF, Pasinetti GM, Dixon RA. Fractionation of Grape Seed Proanthocyanidins for Bioactivity Assessment. Recent Adv Phytochem. 2011:33–46. [Google Scholar]
- Sinha S, Lopes DH, Du Z, et al. Lysine-specific molecular tweezers are broad-spectrum inhibitors of assembly and toxicity of amyloid proteins. J Am Chem Soc. 2011;133:16958–16969. doi: 10.1021/ja206279b. [DOI] [PMC free article] [PubMed] [Google Scholar]
- Teplow DB. Preparation of amyloid β-protein for structural and functional studies. Meth Enzymol. 2006;413:20–33. doi: 10.1016/S0076-6879(06)13002-5. [DOI] [PubMed] [Google Scholar]
- Teplow DB, Lazo ND, Bitan G, et al. Elucidating amyloid β-protein folding and assembly: A multidisciplinary approach. Acc Chem Res. 2006;39:635–645. doi: 10.1021/ar050063s. [DOI] [PubMed] [Google Scholar]
- Truelsen T, Thudium D, Gronbaek M. Amount and type of alcohol and risk of dementia: the Copenhagen City Heart Study. Neurology. 2002;59:1313–1319. doi: 10.1212/01.wnl.0000031421.50369.e7. [DOI] [PubMed] [Google Scholar]
- Turner RJ, Charlton SJ. Assessing the minimum number of data points required for accurate IC50 determination. Assay Drug Dev Technol. 2005;3:525–531. doi: 10.1089/adt.2005.3.525. [DOI] [PubMed] [Google Scholar]
- Virgili M, Contestabile A. Partial neuroprotection of in vivo excitotoxic brain damage by chronic administration of the red wine antioxidant agent, trans-resveratrol in rats. Neurosci Lett. 2000;281:123–126. doi: 10.1016/s0304-3940(00)00820-x. [DOI] [PubMed] [Google Scholar]
- Vivekanandan S, Brender JR, Lee SY, Ramamoorthy A. A partially folded structure of amyloid-beta(1-40) in an aqueous environment. Biochem Biophys Res Commun. 2011;411:312–316. doi: 10.1016/j.bbrc.2011.06.133. [DOI] [PMC free article] [PubMed] [Google Scholar]
- Walsh DM, Lomakin A, Benedek GB, Condron MM, Teplow DB. Amyloid β-protein fibrillogenesis. Detection of a protofibrillar intermediate. J Biol Chem. 1997;272:22364–22372. doi: 10.1074/jbc.272.35.22364. [DOI] [PubMed] [Google Scholar]
- Wang J, Ferruzzi MG, Ho L, et al. Brain-targeted proanthocyanidin metabolites for Alzheimer's disease treatment. J Neurosci. 2012;32:5144–5150. doi: 10.1523/JNEUROSCI.6437-11.2012. [DOI] [PMC free article] [PubMed] [Google Scholar]
- Wang J, Ho L, Zhao W, Ono K, Rosensweig C, Chen L, Humala N, Teplow DB, Pasinetti GM. Grape-derived polyphenolics prevent Aβ oligomerization and attenuate cognitive deterioration in a mouse model of Alzheimer's disease. J Neurosci. 2008;28:6388–6392. doi: 10.1523/JNEUROSCI.0364-08.2008. [DOI] [PMC free article] [PubMed] [Google Scholar]
Associated Data
This section collects any data citations, data availability statements, or supplementary materials included in this article.


