

Abstract
Background and Purpose
The Severity-Based Stroke Triage Algorithm for EMS endorses routing patients with suspected large vessel occlusion (LVO) acute ischemic strokes directly to endovascular stroke centers (ESCs). We sought to evaluate different specifications of this algorithm within a region.
Methods
We developed a discrete event simulation environment to model suspected stroke patients transported according to algorithm specifications which varied by stroke severity screen and permissible additional transport time for routing patients to ESCs. We simulated King County, Washington, and Mecklenburg County, North Carolina, distributing patients geographically into census tracts. Transport time to the nearest hospital and ESC was estimated using traffic-based travel times. We assessed undertriage, overtriage, transport time, and the number-needed-to-route, defined as the number of patients enduring additional transport to route one LVO patient to an ESC.
Results
Undertriage was higher and overtriage was lower in King County compared with Mecklenburg County for each specification. Overtriage variation was primarily driven by screen (e.g. 13% to 55% in Mecklenburg County; 10% to 40% in King County). Transportation time specifications beyond 20 minutes increased overtriage and decreased undertriage in King County but not Mecklenburg County. A low versus high specificity screen routed 3.7-times more patients to ESCs. EMS spent nearly twice the time routing patients to ESCs in King County compared to Mecklenburg County.
Conclusions
Our results demonstrate how discrete event simulation can facilitate informed decision-making to optimize EMS stroke severity based triage algorithms. This is the first step towards developing a mature simulation to predict patient outcomes.
Keywords: prehospital delay, occlusion, acute stroke, severity, discrete event simulation, geography, triage, large vessel occlusion
Subject Terms: Cerebrovascular Disease/Stroke, Ethics and Policy, Epidemiology, Quality and Outcomes, Revascularization
INTRODUCTION
The American Heart Association/American Stroke Association (AHA/ASA) recommends that endovascular therapy be initiated within six hours of symptom onset for select large vessel occlusion (LVO) acute ischemic strokes (AIS) patients.1 This recommendation is grounded in the results of several randomized trials demonstrating the benefit of endovascular therapy for LVO patients within this time window.2–5
Executing this recommendation can be logistically challenging in regions where patients are far from an endovascular stroke center (ESC). To address this challenge, the AHA/ASA Mission: Lifeline Stroke initiative recently introduced the Severity-Based Stroke Triage Algorithm for EMS that endorses routing patients directly to ESCs for clinical and transport scenarios fulfilling certain criteria.6 This algorithm recommends the use of published stroke severity screening tools, such as the Los Angeles Motor Scale (LAMS)7, Rapid Arterial Occlusion Evaluation (RACE)8, or Cincinnati Stroke Triage Assessment Tool (C-STAT)9, to identify suspected LVO patients. For such patients within six hours of the time since last known well, the algorithm favors direct transport to the nearest ESC if transport adds no more than 15 minutes to transport compared with time to the nearest facility.
Effective implementation of this algorithm will require a balance between minimizing the proportion of LVO patients not directly transported to an endovascular stroke center (ESC) (undertriage) and limiting patients that are unnecessarily transported to an ESC due to false positive stroke severity screens (overtriage). Accordingly, the Mission: Lifeline Stroke committee acknowledges that specific regions may choose to adopt different stroke severity screens and may need to modify the permissible additional transport time within the algorithm to optimize performance.
A robust tool that can aid in regional decision-making regarding this algorithm is not currently available. Discrete event simulation enables the evaluation of the impact of various specifications of this algorithm on outcome metrics and may be useful in refining triage and destination plans. The overarching goal of our study was to develop a discrete event simulation environment to evaluate how the AHA/ASA Severity-Based Stroke Triage Algorithm for EMS might perform in real world settings and leverage this environment to model two US counties with different regional characteristics. Specifically, for each algorithm specification varying stroke severity screen and the additional transport time permitted to bypass non-ESCs, we aimed to estimate regional overtriage, undertriage, the total LVO and non-LVO patients routed to ESCs, and the cumulative additional transport time for routed patients. Additionally, we propose and calculate a new metric, the number-needed-to-route (NNR), to simplify overtriage estimates by stroke screen.
METHODS
Discrete event simulation is a flexible computational modeling technique that generates entities that experience events over a time horizon, which may include interactions with other entities and the use of resources in the system.10 The probabilistic nature of events and consequences of decisions or interactions can be incorporated into the simulation, permitting the examination of outcome measures under uncertainty. We developed a finite-horizon discrete event simulation11 environment to evaluate variations of specifications of an algorithm similar to the AHA/ASA Mission Lifeline algorithm within regional stroke systems.
The specifications of the algorithm that we simulated are outlined in Figure 1. We defined algorithm specifications that varied permitted additional transport time (10, 20, 30, and 40 minutes) and the use of three stroke severity screening tools based on published thresholds for LVO identification: Los Angeles Motor Scale≥4 (LAMS; sensitivity/specificity: 0.81/0.89)7, Rapid Arterial Occlusion Evaluation≥5 (RACE; sensitivity/specificity: 0.85/0.68)8, and the Cincinnati Stroke Triage Assessment Tool ≥2 (C-STAT; sensitivity/specificity: 0.83/0.40)9.
Figure 1.
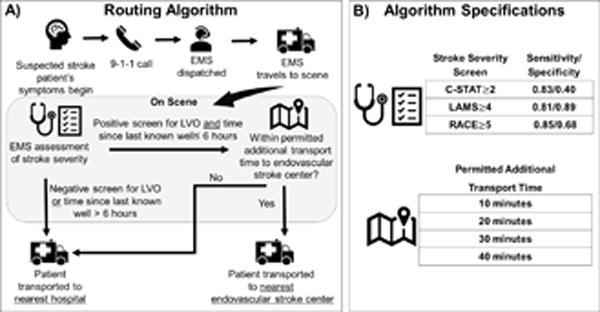
Routing Algorithm (A) and (B) Specifications Evaluated
Figure 1 also outlines the simulation of a single patient, who contacts emergency services (e.g. 9-1-1) at some point after symptom onset and EMS is dispatched to the patient’s location. Once on scene, EMS personnel assess the patient using a stroke severity screen. If a patient screens positively for LVO and their last known well time (LKW), defined as the estimated time from symptom onset until EMS assessment, is less than six hours, EMS estimates the additional travel time necessary to travel to the nearest ESC. If this additional travel time is less than the specified threshold, EMS transports the patient to the nearest ESC. Otherwise, the patient is transported to the nearest hospital (which may be an ESC).
Transport time from the patient’s location to the nearest ESC and non-ESC was estimated prior to a routing decision using traffic-based real road transport duration via MapQuest application program interface. We assumed that EMS would travel at the average speed of other vehicles based on discussions with individuals familiar with EMS practices and from existing literature.12,13 Additional methodological details are provided in the Supplement.
Simulated Patient Characteristics and Location
We simulated suspected AIS/transient ischemic attack (TIA) patients who were assessed and transported via EMS over one year, which included LVO AIS patients, non-LVO AIS, and suspected stroke patients who are not eventually hospital-diagnosed with AIS or TIA. We assumed that all EMS-attended suspected stroke patients would receive a stroke severity screen, which emulates the Mission Lifeline algorithm guidelines to assess stroke severity among suspected stroke patients and those identified by a stroke identification tool.6 We also assumed that 60% of these screened patients would not receive a hospital diagnosis of TIA or AIS,14–18 and that 20% of AIS/TIA patients (8% of all EMS screened patients) would receive a hospital diagnosis of LVO.19,20 Whether a patient would receive a hospital diagnosis of stroke and/or LVO was assigned to the patient prior to the simulation and was used in conjunction with a screen’s sensitivity and specificity to estimate the probability of screening positive for LVO. To estimate the annual number of stroke cases per census tract (small contiguous county subdivisions between 1,200 and 8,000 residents21) among adults at least 45 years old, we applied combined AIS/TIA incidence rates (aged 45–64 years)22 and county-specific TIA/AIS hospitalization rates of Medicare beneficiaries (aged 65+),23 stratified by age, sex, and race (black and white) to 2010 US census tract population estimates stratified in the same manner, and multiplied this value by 60%, the percent of patients who are EMS-transported.14,15 The total across census tracts served as the mean EMS-transported cases annually. A simulated patient was probabilistically assigned to a census tract according to the empirical probability mass function of strokes by census tract. For example, if 10% of strokes are expected to occur in one census tract, each patient independently has a 10% chance of assignment to that census tract. Patient location within the census tract was also randomly generated. Patient characteristics and all time segments (e.g. symptom onset until EMS arrival, transport time to hospital) were generated for each simulated patient according to its specified probability distribution (Table I).
Table 1.
Geographic characteristics, number of simulated patients, and average transportation times of simulated patients by county
| Mecklenburg County Mean [SD] (95% CI) |
King County Mean [SD] (95% CI) |
|
|---|---|---|
| Population (2016 estimate) | 990,977 | 2,044,000 |
| Area (square miles) | 546 | 2307 |
| Number of census tracts | 230 | 398 |
| ESCs | 2 | 4 |
| Non-ESCs | 5 | 10 |
| Estimated EMS-assessed strokes/year | 1,249 | 2,110 |
| Simulated patients screened annually | 3146 (3018 – 3274) |
5212 (4980 – 5445) |
| LVO patients | 252 (239 – 264) |
418 (202 – 634) |
| Non-LVO patients | 2895 (2779 – 3011) |
4795 (4776 – 4813) |
| % patients closest to an ESC | 20.4% (20.3–20.6) |
31.0% (30.9 – 31.1) |
| % patients < 10 additional minutes of transport to an ESC | 66.9% (66.6–67.1) |
60.3% (60.1–60.5) |
| % patients < 20 additional minutes of transport to an ESC | 98.9% (98.8–98.9) |
84.5% (84.4–84.7) |
| % patients < 30 additional minutes of transport to an ESC | 100% (100–100) |
95.5% (95.4–95.7) |
| % patients < 40 additional minutes of transport to an ESC | 100% (100–100) |
96.7% (96.6–96.8) |
| Expected transportation time to closest hospital (minutes) | 12.8 [4.1] (12.8–12.9) |
12.6 [5.5] (12.6–12.6) |
| Expected transportation time to ESC (minutes) | 19.8 [6.7] (19.8–19.9) |
22.5 [11.5] (22.4–22.5) |
ESC: endovascular stroke center. SD: standard deviation. CI: confidence interval.
Regional Characteristics
We simulated each algorithm specification in King County, Washington, and Mecklenburg County, North Carolina. We selected these two counties to explore how outcomes of a given algorithm specification may be influenced by differences in community size, geography, and projected stroke incidence distribution with respect to ESC location (select characteristics are displayed in Table 1). We considered all licensed hospitals with 24-hour emergency care as eligible EMS transport destinations. We classified a hospital as an ESC if it was a Joint Commission Certified Comprehensive Stroke Center24 or if regional stroke coordinators confirmed the availability of 24-hour endovascular therapy (verified by AWA and BMB). All non-ESCs were also confirmed to have the ability to treat acute stroke patients 24/7 with IV tPA.
Replications
The total annual number of stroke patients was uniformly randomly generated centered around the county’s estimated mean incidence at the beginning of a simulation replication. We replicated each scenario 30 times per county to construct confidence intervals with a small half-width given the probabilistic nature of the simulation parameters.25 The simulation environment was developed in Python version 2.7 using the simpy package. Additional details of the simulation environment are provided in the Supplement.
Outcome Measures
A patient’s hospital diagnosis of stroke and/or LVO used to calculate overtriage and undertriage. We assessed undertriage, defined as the proportion of screened patients not routed to an ESC of those who: a) are true LVO patients, b) have LKW≤6 hours, and c) their nearest hospital is not an ESC. Note that an LVO patient is not undertriaged if their nearest hospital is an ESC since they benefit from its advanced care capabilities even if not identified by EMS. We evaluated overtriage, defined as the proportion of suspected stroke patients transported to an ESC who a) are identified by the screen as a suspected LVO stroke patient but are not and b) their closest hospital is not an ESC. Overtriage estimates the fraction of suspected stroke patients that unnecessarily utilize an ESC’s resources. We propose the number-needed-to-route (NNR) metric as the number of patients enduring additional transportation time for a single LVO patient to be routed to an ESC, and calculated NNR for each screen. This measure estimates the efficiency of a screen within a given region. All means, standard deviations, and 95% confidence intervals (CIs) are calculated using R 3.2.2 across the independent simulated replications and reported per county and by specification where appropriate.
RESULTS
The annual expected number of strokes by census tract and the location of hospitals in Mecklenburg County and King County is displayed in Figure 2. ESCs are centrally located in Mecklenburg County but are clustered near Seattle located in Western King County.
Figure 2.
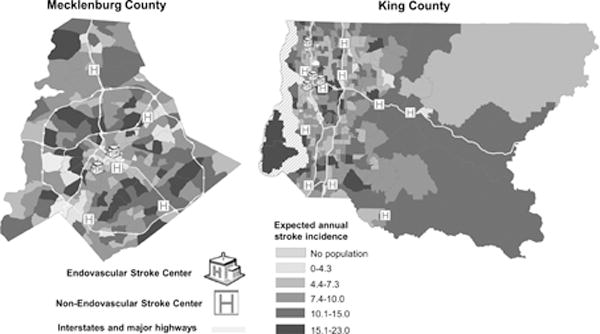
Expected strokes per year by census tract in Mecklenburg County and King County, aged 45+
Figure 3 displays the proportion of patients in each census tract closest to an ESC and within the examined additional transport time specifications (Figure I displays the 40 minute specification); the overall proportion of patients within each additional transport time specification is in Table 1. The closest hospital is an ESC for 20.4% (95% CI: 20.3–20.6) of simulated patients in Mecklenburg County and 31.0% (95% CI: 30.9–31.1) of patients in King County. However, using just a 10 minute specification resulted in a larger proportion of patients in Mecklenburg eligible for ESC routing if they received a positive screen (66.9% in Mecklenburg County and 60.3% in King County). Nearly all of Mecklenburg County patients (98.9%) were within a 20 additional transport minutes compared with 84.5% of King County patients. All Mecklenburg County patients have an expected additional transport time of less than 30 minutes to an ESC, while 4.5% of King County patients beyond that threshold. We observed that 3.3% of King County patients had greater than 40 minutes of additional trasnport time to an ESC. A simulated patient in Mecklenburg County was on average 19.8 minutes from the closest ESC compared with 22.5 minutes in King County.
Figure 3.
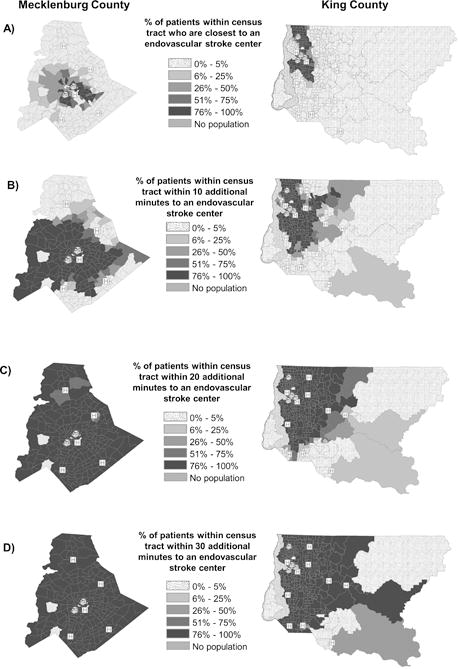
Proportion of stroke patients within a census tract: (A) closest to an endovasular stroke center and within (B) 10, (C) 20, (D) 30 minutes of additional transport time to an endovascular stroke center, by county
Mecklenburg County and King County also differed in overtriage and undertriage for each algorithm specification. Figure 4 displays the average undertriage and overtriage for each transport time and stroke severity screen specification. Undertriage was higher and overtriage was lower in King County compared with Mecklenburg County regardless of screen. Undertriage in Mecklenburg County did not substantially decrease for transport time specifications larger than 20 minutes, but in King County did improve for up to a 30 minute specification. For example, using a LAMS screen in Mecklenburg County, 10, 20, and 30 minute specification resulted in undertriage of 52.1%, 20.0%, and 19.2%, and was 65.6%, 38.1% and 23.8% in King County. Undertriage did not markedly differ by screen for a given transport time specification, due to the similar sensitivity of each screen.
Figure 4.
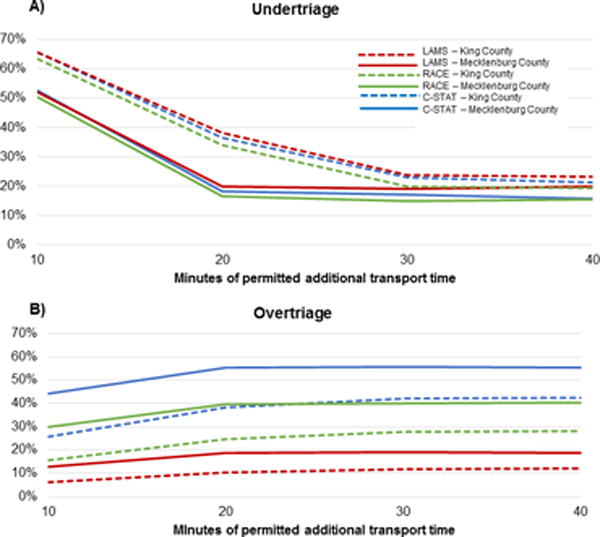
(A) Undertriage and (B) Overtriage by county
Similarly, overtriage was higher when permitted additional transport times from 10 to 20 minutes in both counties, but transportation time specifications beyond 20 minutes increased overtriage in King County but not Mecklenburg County. For example, when using LAMS in Mecklenburg County, 10, 20, 30, and 40 minute specifications led to an overtriage of 12.8%, 18.6%, 18.9%, and 18.6% but was 6.1%, 10.2%, 11.7%, and 11.9% in King County. Overtriage varied widely by stroke severity screen used due to different specificities. For example, in Mecklenburg County, using a 30 minute and C-STAT specification corresponded to 55.6% overtriage but was just 11.7% using LAMS; in King County, overtriage was 41.9% for C-STAT but 18.9% for LAMS. The NNR, which depends only on the stroke severity screen, was 2.59 for LAMS, 5.33 for RACE, and 9.34 for C-STAT.
The median time added to transport of patients routed to an ESC instead of a closer hospital similarly increased by the permitted additional transport time. For each specification, the median minutes added to transport was higher for routed patients in King County than Mecklenburg County. Specifically, the median additional transport time under a 10 minute specification was 6.3 minutes in Mecklenburg County and 7.6 minutes in King County, and under a 40 minute specification was 10.7 minutes for Mecklenburg County but 13.9 minutes in King County. The maximum additional transport time of a patient in Mecklenburg County only marginally increased beyond a 20 minute specification, but continued to increase in King County (Figure II).
The number of patients annually transported to an ESC instead of the closest hospital and the average cumulative total time added county-wide in one year is displayed in Figure 5. The number of patients enduring additional transportation time is higher in King County than in Mecklenburg County for all specifications, and C-STAT resulted in substantially higher cumulative transport time and number of patients routed to an ESC for a given county and transport time specification.
Figure 5.
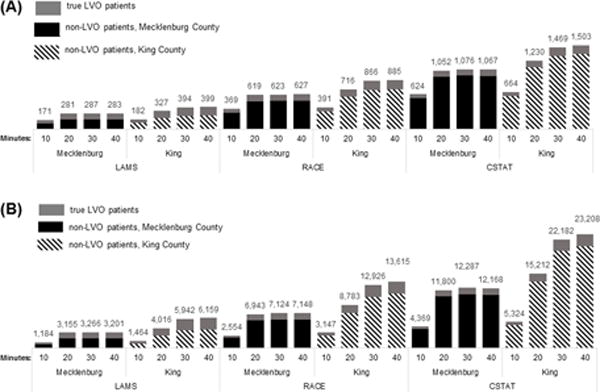
(A) Number of simulated large vessel occlusion (LVO) and non-LVO patients and (B) total number of minutes added to transport annually for each algorithm specification in Mecklenburg County and King County.
DISCUSSION
In this study, we demonstrate the simulated effects of altering important components of an EMS routing algorithm for LVO stroke patients in two different metropolitan counties. The results of our customizable simulation suggest that the effectiveness of a single specification may vary by region, and that local characteristics are important to consider in tailoring any stroke triage algorithm. For example, our results suggest that Mecklenburg County would observe a large reduction in the undertriage of LVO patients by increasing the permitted transport time to an ESC from 10 to 20 minutes (nearly doubling the number of LVO patients routed to an ESC), but would only marginally benefit by increasing the allowable time beyond a 20 minute specification. However, our simulations of King County suggest that increasing from 20 to 30 minutes of permitted additional transport time corresponds to a 28% increase of LVO patients directly transported to an ESC.
Because overtriage and undertriage are inversely related, prioritizing undertriage comes at the cost of routing a larger number of false positive patients over longer distances. For example, increasing from a 20 to 30 minute specification in our simulation of King County using RACE would route an additional 144 patients annually to an ESC who endure on average an additional 28.4 minutes of transport beyond their closest hospital. Hospitals will ultimately need to determine what thresholds of overtriage are sustainable for LVO stroke, similar to how level one trauma centers accept an overtriage of up to 50%, while overtriage for ST segment elevation myocardial infarction routing to PCI centers is likely to be at most 15%. The challenge of accurate prehospital identification of LVO stroke patients means overtriage will likely be greater than 15%, especially for the endpoint of endovascular reperfusion candidacy. However, overtriage higher than 50% is likely to be unsustainable in the current setting of consistent critical capacity issues for many ESCs. We propose the NNR as an intuitive alternative metric of overtriage due to the stroke screen that can be used to communicate the overall optimization of overtriage.
The differences observed in overtriage and undertriage between the two counties is a direct result of the number of patients that are within a specified transport time. Specifically, Mecklenburg County has centrally located ESCs and few patients residing further than a 20 minute additional transport to these ESCs. However, ESCs in King County are all in Seattle, far from those living in eastern King County. Thus, a higher proportion of patients had travel time to an ESC within each transport time specification for Mecklenburg County, corresponding to a larger overtriage but lower undertriage compared with King County for each transport time specification. Furthermore, patients whose closest hospital is an ESC were not included in overtriage and undertriage denominators as they are transported to an ESC regardless of policy. Because of this, as the additional transport time specification increases, an increased proportion of false positive patients who would otherwise go to their closest hospital are transported to an ESC, and a decreased proportion of true LVO patients are routed to a non-ESC hospital when they would have qualified for routing if there were no limit on additional transport time.
Our results highlight that the strongest influence on the number of patients routed is the specificity of the screen used by EMS to identify suspected LVO patients. One of the limitations of published stroke severity screens is the absence of validation studies to establish generalizability,26 demonstrating the importance of selecting a stroke screen with locally validated specificity before full-scale implementation. Moreover, it must be acknowledged that these screens are likely to be even less accurate in validation studies than in the derivation populations that produced the sensitivities and specificities used in this simulation. While our results show that using LAMS yields considerably lower overtriage than when using C-STAT or RACE, one validation study suggests that LAMS may have a similar specificity to the RACE derivation specificity. In that study, a LAMS score of at least 4 achieved only a 74% sensitivity and 59% specificity for LVO.27 Additionally, a recent validation study of the RACE scale demonstrated a lower accuracy (80%) and precision (63%) than originally described.28
Out results indicate that the average time added to transport ranged from 7 to 16 minutes, but was unsurprisingly highly variable. Whether or not this modest average added time would impact outcomes relative to revascularization therapy is unclear.29 However, one estimate suggests that per minute, supratentorial LVO AIS patients lose 1.9 million neurons and the brain ages by 3.1 weeks compared to normal individuals.29
We recognize that hospital performance metrics, such as average door to needle times, may influence routing decisions. For example, if an ESC is 30 minutes farther but has a median door-to-needle time that is 30 minutes or less than an IV tPA capable facility, transporting to an ESC may not result in any delay in IV tPA administration. Future simulations could incorporate such data to demonstrate how an individual hospital’s performance could affect transportation decisions.
The recent recommendations of the Standards and Guidelines Committee of the Society of Neurointerventional Surgery emphasize that prehospital stroke triage systems of care be designed to maximize the number of LVO patients that receive timely access to endovascular therapy.26 However, such policies will likely impact workforce and resource requirements for EMS and hospitals. For example, if currently patients are routed similar to a 10 minute specification in Mecklenburg County, using the RACE scale and 20–40 minute additional transport specifications translates to an expected additional 15 patients to each ESC per month, along with 12 additional EMS transportation hours per month. In regions with limited ambulance resources far from an ESC that have a relatively high volume of EMS calls, such policies may inadvertently compromise non-LVO stroke patients that must wait for an ambulance to return to its service area,30 and may require additional resources to continue to meet standards such as 90% EMS arrival within 9 minutes.31 Additionally, how overtriage translates to hospital overcrowding depends on each ESC’s capacity for treating suspected LVO patients in addition to their usual caseload. To continue to meet stroke center quality objectives such as door-to-needle times, an increase in staff, dedicated beds, and equipment such as computerized tomography scanners may be needed. For ESCs that are already routinely near capacity, implementing a routing algorithm could result in care delays for LVO and non-LVO patients alike if staffing and capacity issues are not first addressed. It is recognized that patients who present during high ED volume or hospital occupancy experience higher short-term mortality.32 Importantly, an LVO routing algorithm may also lead to imbalances in overtriage and overcrowding among the ESCs due to the geographical placement relative to suspected stroke patient locations. A precise estimate of additional costs will require additional study, but should be considered as regions evaluate implementing this algorithm. While we have not reported hospital-level overtriage and undertriage, our simulation is capable of calculating such metrics given appropriate inputs.
Whether EMS routing algorithms for LVO patients are implemented on a national scale or tailored to individual regions, simulating the impact of a several algorithm specifications under varied assumptions is an inexpensive, yet sophisticated method that can contribute to informed decision-making. To illustrate, simulating a range of stroke screen specificities could provide estimates on the expected additional patients per day that an individual ESC may expect, and similarly help hospitals that do not provide endovascular therapy to understand how the algorithm consequently reduces their patient volume, which can assist with capacity planning and scheduling. Ideally, simulation inputs and results would be discussed among all key stroke system decision-makers, including 9-1-1 dispatch,33–34 EMS, non-ESC hospitals, and ESCs.
We note several limitations of our study. First, we estimated stroke incidence by census tract using published incidence rates among blacks and whites. Mecklenburg County is 91% black or white but 25% of King County residents are not black or white, with an Asian population of close to 15%. We were unable to find established stroke incidence rates for Asians, which may have resulted in an underestimation of overtriage, the total number routed, and the number of minutes added annually within King County. We assumed an 8% prevalence of LVO AIS among simulated screened patients, but recent data from Mecklenburg County suggest that may be an overestimate.35 While we carefully researched and applied realistic inputs, including region-specific data where possible, into the simulation, our results may not accurately reflect some aspects of the systems within King County and Mecklenburg County. As more accurate data emerges, the simulation will need to be adjusted. Additionally, the purpose of our study was to derive a simulation environment capable of examining this algorithm within a region, and therefore we do not necessarily expect the results presented for Mecklenburg and King County to generalize to other regions. Our results demonstrate, however, that a single parameterization of this algorithm has region-specific consequences for transport time, volume of patients routed to an ESC, and over- and undertriage and therefore community-specific parameterizations may be important. We hope to disseminate this simulation environment as a tool for policymakers to use in their own community. Our model furthermore did not account for a decision not to route to an ESC for the reason of precluding the administration of IV tPA, as suggested by the Severity-Based Stroke Triage Algorithm for EMS.6 While this could be incorporated into future simulations, the ability of EMS providers to reliably make this determination remains unknown. The published algorithm also suggests that EMS use a stroke identification tool prior to assessing stroke severity, which we did not incorporate into our simulation. However, whether the algorithm recommends excluding suspected stroke patients who screen negative for stroke is unclear, since it appears that both patients who screen positive for stroke or are suspected of stroke should receive a stroke severity assessment.6 Furthermore, the performance of stroke identification tools vary widely in published studies,36 and may be specific to the quality of training and stroke prevalence, so modeling assumptions may be unreliable. Nevertheless, our environment could easily incorporate a two-stage screening process given a tool’s sensitivity and specificity. Finally, we recognize that routing should not be equated with treatment relative to our proposed NNR metric. Ultimately, a comprehensive simulation will need to evaluate hospital metrics including time until treatment, type of treatment, and a patient’s neurological and survival outcomes to provide a thorough understanding of how the algorithm will impact clinical practice. A simulation environment which incorporates these extensions is being developed.
We present the first step in simulating the impact of implementing variations of a proposed LVO routing algorithm within a defined region, which currently can evaluate the impact on prehospital logistics and the overall burden placed on individual hospitals. We envision the development of a mature simulation model that can be shared with regional decision-makers which also estimates important outcomes such as mortality and neurological status of LVO and non-LVO AIS patients and incorporates constraints on resources.
Supplementary Material
Acknowledgments
SOURCES OF FUNDING: Dr. Bogle was supported by the Ruth L. Kirschstein National Research Service Award (5T32HL007055-39) from the National Heart, Lung, and Blood Institute.
Footnotes
DISCLOSURES: Dr. Asimos received research support from Stryker® Neurovascular, was co-chair of CME initiative by Haymarket Medical Education, underwritten by Medtronic Inc, and conducts medical review as an expert witness for cases involving stroke. Dr. Bogle and Dr. Rosamond report no conflicts.
Contributor Information
Brittany M. Bogle, University of North Carolina at Chapel Hill.
Andrew W. Asimos, Carolinas Healthcare System.
Wayne D. Rosamond, University of North Carolina at Chapel Hill.
References
- 1.Powers WJ, Derdeyn CP, Biller J, Coffey CS, Hoh BL, Jauch EC, et al. 2015 American Heart Association/American Stroke Association Focused Update of the 2013 Guidelines for the Early Management of Patients With Acute Ischemic Stroke Regarding Endovascular Treatment. Stroke. 2015;46:3020–3035. doi: 10.1161/STR.0000000000000074. [DOI] [PubMed] [Google Scholar]
- 2.Berkhemer OA, Fransen PSS, Beumer D, van den Berg LA, Lingsma HF, Yoo AJ, et al. A Randomized Trial of Intraarterial Treatment for Acute Ischemic Stroke. N Engl J Med. 2015;372:11–20. doi: 10.1056/NEJMoa1411587. [DOI] [PubMed] [Google Scholar]
- 3.Campbell B, Mitchell P, Kleinig T, Dewey H, Churilov L, Yassi N, et al. Endovascular Therapy for Ischemic Stroke with Perfusion-Imaging Selection for the EXTEND-IA Investigators. N Engl J Med. 2015;372:1009–18. doi: 10.1056/NEJMoa1414792. [DOI] [PubMed] [Google Scholar]
- 4.Saver JL, Goyal M, Bonafe A, Diener H-C, Levy EI, Pereira VM, et al. Stent-Retriever Thrombectomy after Intravenous t-PA vs. t-PA Alone in Stroke. N Engl J Med. 2015;372:2285–95. doi: 10.1056/NEJMoa1415061. [DOI] [PubMed] [Google Scholar]
- 5.Bracard S, Ducrocq X, Mas JL, Soudant M, Oppenheim C, Moulin T, et al. Mechanical thrombectomy after intravenous alteplase versus alteplase alone after stroke (THRACE): a randomised controlled trial. Lancet Neurol. 2016;15:1138–1147. doi: 10.1016/S1474-4422(16)30177-6. [DOI] [PubMed] [Google Scholar]
- 6.Severity-Based Stroke Triage Algorithm for EMS Mission: Lifeline Stroke. American Heart Association; http://www.heart.org/MissionLifelineStroke. Accessed March 27, 2017. [Google Scholar]
- 7.Nazliel B, Starkman S, Liebeskind DS, Ovbiagele B, Kim D, Sanossian N, et al. A Brief Prehospital Stroke Severity Scale Identifies Ischemic Stroke Patients Harboring Persisting Large Arterial Occlusions. Stroke. 2008;39:2264–2267. doi: 10.1161/STROKEAHA.107.508127. [DOI] [PMC free article] [PubMed] [Google Scholar]
- 8.Pérez de la Ossa N, Carrera D, Gorchs M, Querol M, Millán M, Gomis M, et al. Design and Validation of a Prehospital Stroke Scale to Predict Large Arterial Occlusion. Stroke. 2013;45:87–91. doi: 10.1161/STROKEAHA.113.003071. [DOI] [PubMed] [Google Scholar]
- 9.Katz BS, McMullan JT, Sucharew H, Adeoye O, Broderick JP. Design and Validation of a Prehospital Scale to Predict Stroke Severity: The Cincinnati Prehospital Stroke Severity Scale. Stroke. 2015;46:1508–1512. doi: 10.1161/STROKEAHA.115.008804. [DOI] [PMC free article] [PubMed] [Google Scholar]
- 10.Karnon J, Stahl J, Brennan A, Caro JJ, Mar J, Moller J. Modeling Using Discrete Event Simulation: A Report of the ISPOR-SMDM Modeling Good Research Practices Task Force-4. Med Decis Mak. 2012;32:701–711. doi: 10.1177/0272989X12455462. [DOI] [PubMed] [Google Scholar]
- 11.Henderson SG, Nelson BL, editors. Handbooks in Operations Research and Management Science, Volume 13: Simulation. 1st. Amsterdam, The Netherlands: Elsevier; 2006. [Google Scholar]
- 12.Ho J, Lindquist M. Time saved with the use of emergency warning lights and siren while responding to requests for emergency medical aid in a rural environment. Prehosp Emerg Care. 5:159–62. doi: 10.1080/10903120190940056. [DOI] [PubMed] [Google Scholar]
- 13.Petzäll K, Petzäll J, Jansson J, Nordström G. Time saved with high speed driving of ambulances. Accid Anal Prev. 2011;43:818–822. doi: 10.1016/j.aap.2010.10.032. [DOI] [PubMed] [Google Scholar]
- 14.Mochari-Greenberger H, Xian Y, Hellkamp AS, Schulte PJ, Bhatt DL, Fonarow GC, et al. Racial/Ethnic and Sex Differences in Emergency Medical Services Transport Among Hospitalized US Stroke Patients: Analysis of the National Get With The Guidelines-Stroke Registry. J Am Heart Assoc. 2015;4:e002099. doi: 10.1161/JAHA.115.002099. [DOI] [PMC free article] [PubMed] [Google Scholar]
- 15.Mohammad YM. Mode of arrival to the emergency department of stroke patients in the United States. J Vasc Interv Neurol. 2008;1:83–6. [PMC free article] [PubMed] [Google Scholar]
- 16.Krebes S, Ebinger M, Baumann AM, Kellner PA, Rozanski M, Doepp F, et al. Development and Validation of a Dispatcher Identification Algorithm for Stroke Emergencies. Stroke. 2012;43:776–81. doi: 10.1161/STROKEAHA.111.634980. [DOI] [PubMed] [Google Scholar]
- 17.Buck BH, Starkman S, Eckstein M, Kidwell CS, Haines J, Huang R, et al. Dispatcher Recognition of Stroke Using the National Academy Medical Priority Dispatch System. Stroke. 2009;40:2027–30. doi: 10.1161/STROKEAHA.108.545574. [DOI] [PMC free article] [PubMed] [Google Scholar]
- 18.Ramanujam P, Guluma KZ, Castillo EM, Chacon M, Jensen MB, Patel E, et al. Accuracy of Stroke Recognition by Emergency Medical Dispatchers andParamedics—San Diego Experience. Prehospital Emerg Care. 2008;12:307–313. doi: 10.1080/10903120802099526. [DOI] [PubMed] [Google Scholar]
- 19.Vanacker P, Heldner MR, Amiguet M, Faouzi M, Cras P, Ntaios G, et al. Prediction of Large Vessel Occlusions in Acute Stroke. Crit Care Med. 2016;44:e336–e343. doi: 10.1097/CCM.0000000000001630. [DOI] [PubMed] [Google Scholar]
- 20.Beumer D, Mulder MJHL, Saiedie G, Fonville S, van Oostenbrugge RJ, van Zwam WH, et al. Occurrence of intracranial large vessel occlusion in consecutive, non-referred patients with acute ischemic stroke. Neurovascular Imaging. 2016;2:11. [Google Scholar]
- 21.Geographic Terms and Concepts - Census Tract. United States Census Bureau; 2010. https://www.census.gov/geo/reference/gtc/gtc_ct.html Accessed June 5, 2017. [Google Scholar]
- 22.Mozaffarian D, Benjamin EJ, Go AS, Arnett DK, Blaha MJ, Cushman M, et al. Heart Disease and Stroke Statistics-2016 Update: A Report From the American Heart Association. Circulation. 2016;133:e38–360. doi: 10.1161/CIR.0000000000000350. [DOI] [PubMed] [Google Scholar]
- 23.Interactive Atlas of Heart Disease and Stroke. Centers for Disease Control and Prevention; County Summary Statistics: Stroke Hospitalization Rate per 1,000 Medicare Beneficiaries, 65+, All Race, All Gender, 2011–2013. http://nccd.cdc.gov/DHDSPAtlas Accessed July 20, 2017. [Google Scholar]
- 24.Certification Data Download. The Joint Commission Quality Check. https://www.qualitycheck.org/data-download/certification-data-download Accessed March 5, 2017.
- 25.Law AM, Kelton WD. Simulation Modeling and Analysis. 3rd. New York, NY: McGraw-Hill; 2000. [Google Scholar]
- 26.Pride GL, Fraser JF, Gupta R, Alberts MJ, Rutledge JN, Fowler R, et al. Prehospital care delivery and triage of stroke with emergent large vessel occlusion (ELVO): report of the Standards and Guidelines Committee of the Society of Neurointerventional Surgery. J Neurointerv Surg. 2016 doi: 10.1136/neurintsurg-2016-012699. neurintsurg-2016-012699. [DOI] [PubMed] [Google Scholar]
- 27.Noorian A, Sanossian N, Liebeskind DS, Starkman S, Eckstein M, Stratton S, et al. Abstract 83: Field Validation of Prehospital LAMS Score to Identify Large Vessel Occlusion Ischemic Stroke Patients for Direct Routing to Emergency Neuroendovascular Centers. Stroke. 2016;47:A83. [Google Scholar]
- 28.Perez de la Ossa N, Abilleira S, Ribó M, Monica M, Cardona P, Urra X, et al. Abstract 18: External Validation of the RACE Scale After Its Implementation in the Stroke Code Protocol in Catalonia. Stroke. 2017;48 [Google Scholar]
- 29.Saver JL. Time Is Brain–Quantified. Stroke. 2006;37:263–266. doi: 10.1161/01.STR.0000196957.55928.ab. [DOI] [PubMed] [Google Scholar]
- 30.Govindarajan P, Gonzales R, Maselli JH, Claiborne Johnston S, Fahimi J, Poisson S, et al. Regional Differences in Emergency Medical Services Use for Patients with Acute Stroke (Findings from the National Hospital Ambulatory Medical Care Survey Emergency Department Data File) J Stroke Cerebrovasc Dis. 2013;22:e257–e263. doi: 10.1016/j.jstrokecerebrovasdis.2012.02.014. [DOI] [PubMed] [Google Scholar]
- 31.Acker JE, Pancioli AM, Crocco TJ, Eckstein MK, Jauch EC, Larrabee H, et al. Implementation Strategies for Emergency Medical Services Within Stroke Systems of Care. Stroke. 2007;38 doi: 10.1161/STROKEAHA.107.186094. [DOI] [PubMed] [Google Scholar]
- 32.Richardson DB. Increase in patient mortality at 10 days associated with emergency department overcrowding. Med J Aust. 2006;184:213–216. doi: 10.5694/j.1326-5377.2006.tb00204.x. [DOI] [PubMed] [Google Scholar]
- 33.Olola C, Scott G, Gardett I, Clawson JJ, Broadbent M. Comparison of Emergency Medical Dispatcher Stroke Identification and Paramedic On-Scene Stroke Assessment. Ann Emerg Dispatch Response. 2017;5:6–10. [Google Scholar]
- 34.Clawson JJ, Scott G, Gardett I, Youngquist S, Taillac P, Fivaz C, et al. Predictive Ability of an Emergency Medical Dispatch Stroke Diagnostic Tool in Identifying Hospital-Confirmed Strokes. J Stroke Cerebrovasc Dis. 2016;25:2031–2042. doi: 10.1016/j.jstrokecerebrovasdis.2016.04.021. [DOI] [PubMed] [Google Scholar]
- 35.Dozois AR, Hampton L, Kingston CW, Lambert G, Porcelli TJ, Sorenson D, et al. Abstract TP240: The PLUMBER (Prevalence of Large Vessel Occlusion Stroke in Mecklenburg County Emergency Response) Study. Stroke. 2017;48 doi: 10.1161/STROKEAHA.117.018925. [DOI] [PubMed] [Google Scholar]
- 36.Brandler ES, Sharma M, Sinert RH, Levine SR. Prehospital stroke scales in urban environments: a systematic review. Neurology. 2014;82:2241–9. doi: 10.1212/WNL.0000000000000523. [DOI] [PMC free article] [PubMed] [Google Scholar]
Associated Data
This section collects any data citations, data availability statements, or supplementary materials included in this article.