Abstract
Purpose
To evaluate the value of multiparametric quantitative ultrasound imaging (QUI) in assessing chronic kidney disease (CKD) using kidney biopsy pathology as the reference standard.
Methods
We prospectively measured multiparametric QUI markers with grayscale, spectral Doppler, and acoustic radiation force impulse imaging in 25 patients with CKD prior to their kidney biopsies and in 10 healthy volunteers. Based on all pathology (glomerulosclerosis, IF/TA, arteriosclerosis, and edema) scores, the 25 CKD patients were classified into mild (no grade 3 and < 2 of grade 2) and moderate to severe (at least 2 of grade 2 or 1 of grade 3) CKD groups. Multiparametric QUI in the study included kidney length, cortical thickness, pixel-intensity, parenchymal shear wave velocity (SWV), intrarenal artery peak systolic velocity (PSV), end diastolic velocity (EDV), and resistive index (RI). We tested the difference in QUI parameters among mild CKD, moderate to severe CKD, and healthy controls using ANOVA, analyzed correlations of QUI parameters to kidney pathology scores and to eGFR using the Pearson correlation coefficient, and examined the diagnostic performance of QUI parameters in determining moderate CKD and eGFR <60 using ROC curve analysis.
Results
There were significant differences in cortical thickness, pixel-intensity, PSV, and EDV among the 3 groups (all p< 0.01). Among QUI parameters, the top AUROCs of PSV and EDV for determining pathologic moderate to severe CKD were 0.88 and 0.97, and for eGFR <60 were 0.76 and 0.86, respectively. Moderate to good correlations were found for PSV, EDV, and pixel-intensity to pathology score and eGFR.
Conclusion
PSV, EDV, and pixel-intensity are valuable in determining moderate to severe CKD. The value of SWV in assessing CKD needs further investigation.
Keywords: Acoustic radiation force impulse, chronic kidney disease, Doppler ultrasound imaging, quantitative ultrasound imaging, shear wave velocity
Introduction
Chronic kidney disease (CKD) is a high-prevalence disorder from which approximately 11.5% of U.S. adults suffer, with much higher rates in certain minority populations and the elderly. 1 The etiology of CKD is complex and the progression of kidney damage in those patients is dynamic. An increase in the extracellular matrix synthesis, with excessive fibrillary collagens, characterizes the development of chronic lesions in the glomeruli, interstitial compartment, and vascular system of the kidney, which progressively leads to end-stage renal disease (ESRD) and renal failure that needs to be managed with replacement therapy such as dialysis or renal transplantation.2, 3 The underlying pathophysiologic mechanisms participating in the disease processes of CKD are being increasingly identified and various experimental models have demonstrated the ability to inhibit fibrosis and/or promote regression. As such management strategies are implemented in the clinical environment, the incidence of ESRD can be reduced.4, 5 Therefore, techniques that are capable of identifying CKD in earlier stages and accurately assessing the effects of treatment are crucial in ultimately retarding the development of ESRD.6–8
Currently, two main methods exist to evaluate and monitor kidney disease. These methods are either too insensitive, such as conventional serum tests (e.g., serum creatinine), or too invasive, such as kidney biopsy with potential complications (e.g., bleeding). 9 Patients who have serum creatinine levels within the “normal” range may nonetheless have a substantial reduction in kidney function, which can be seen in stage III of CKD.1, 10 In addition, there are patients who would not meet the criteria for immunotherapy if interstitial fibrosis and scarring are present. Currently, biopsy is the gold standard to determine this pathology; however, if it could be accurately detected and monitored using ultrasound technique, it would prevent the need for an invasive procedure. Therefore, the interest in developing new non-invasive methods for early identification and sensitive quantification of glomerular, interstitial, and vascular pathologies in CKD has been continuously increasing.Among imaging techniques, magnetic resonance imaging (MRI) can assess corticomedullary differentiation associated with chronic renal parenchyma pathologies;11 however, it is not suitable for patients who have claustrophobia and/or a pacemaker. In addition, patients with advanced CKD may be at risk of developing nephrogenic systemic fibrosis (NSF) if a gadolinium-based contrast agent is administered for contrast-enhanced MRI.12 Contrast-enhanced computed tomography exposes patients to radiation and possibly puts the patient at risk of contrast agent induced nephropathy.13 Therefore, ultrasonography with advantages of informative value, reproducibility, convenience, and low cost, has been considered as the first imaging of choice in assessing CKD.14–19
In conventional ultrasound, gray scale imaging is used to observe the morphology including the size, cortical thickness, and echogenicity of the kidney,15,16 and renal artery spectral Doppler imaging is performed to assess the kidney hemodynamics associated with the alterations in renal parenchyma pathology and/or kidney function.17–20 Ultrasound elasticity imaging including ultrasound strain imaging and shear wave elastography is an imaging technique that estimates tissue biomechanical properties associated with cortical pathologic changes (such as interstitial fibrosis), which are fundamentally linked to kidney function.21–24 These technological advances in ultrasound imaging have, however, yet to be validated as quantitative tools for detecting and grading CKD.
We propose to evaluate the feasibility of multiparametric QUI biomarkers for comprehensively assessing renal cortical morphology, hemodynamics, and biomechanical property changes correlated with kidney biopsy pathology in CKD.
Material and Methods
The Institutional Review Board at Weill Cornell Medicine of Cornell University approved the study (IRB# 1503015995) and all subjects provided written informed consent.
Subjects
Healthy volunteers who had no history of diabetes, hypertension, proteinuria, trauma, autoimmune disease, or kidney disease of any kind were recruited in the control group. All healthy volunteers had normal kidney function [estimated glomerular filtration rate (eGFR) >60 mL/min/1.73m2].
Individuals scheduled for kidney biopsies as the standard of care for the diagnosis of CKD were recruited into the patient group. Clinical manifestations in subjects suspected of having CKD included proteinuria, long term diabetes, elevated serum creatinine, history of lupus, autoimmune disease, and/or decreased kidney function (eGFR <60 mL/min/1.73 m 2). Based on the study protocol, the eGFR was tested prior to or on the same day as the QUI examination and kidney biopsy were performed. The eGFR is calculated by the abbreviated Modification of Diet Renal Disease (MDRD-4) equation: 175 x serum creatinine (mg/dL) −1.154 x age (year)−0.203 x 0.742 (if female) x 1.212 (if African American). 1
Ultrasound imaging data acquisition
The Acouson S3000 HELIX (Siemens Medical Solutions, USA) equipped with 6C1 (1.5–6.0 MHz) curved linear array transducer was used for acquiring grayscale, spectral Doppler, and Virtual Touch Tissue Quantification (VTQ) on acoustic radiation force impulse (ARFI) imaging in subjects with CKD immediately prior to their kidney biopsy and in healthy subjects.
All subjects fasted before the examination and QUI was performed immediately prior to kidney biopsies. The subject was placed in the left and right lateral decubitus position for imaging the right and left kidney, respectively. The urinary bladder was emptied prior to the ultrasound examination.
We initiated with a grayscale image. Prior to the scanning, we locked machine settings for acquiring a grayscale image of the kidney. The standardized settings included MI: 1.4; image depth (12–15cm); scanning frequency (3.5 MHz); single focus; harmonic imaging; Map E/Space time (2); total gain and dynamic range (65dB) for the whole every examination in all subjects. The size of the kidney was expressed by the sagittal length of the kidney.25 The cortical thickness was the measurement of the anteroposterior dimension of the kidney cortex in the sagittal view. The presence or absence of hydronephrosis, calculi, masses, and perinephric collections was also assessed.
A single observer (JG) with 30 years of experience in renal sonography performed QUI in all subjects with CKD and in 10 healthy controls.
Measuring renal parenchyma pixels-intensity using Image J
A static image of the kidney was stored with the Digital Imaging and Communications in Medicine (DICOM) format and then transferred to a computer where the renal parenchyma pixel-intensity was measured offline using Image J (NIH, https://imagej.nih.gov). We measured pixel-intensity by counting 2500 pixels (50x50) in a rectangular region of interest (ROI) in the anterior mid portion of the kidney cortex where the corticomedullary differentiation was deemed optimal (Fig. 1a). The pixel-intensity was measured within renal parenchyma between the kidney capsule and collecting system in the anteroposterior dimension if the corticomedullary differentiation was less well defined (Fig. 1b). Using Image J analysis tool, pixel-intensity values can be measured and displayed in a histogram (Fig. 1a–b). Maximum and minimum pixel-intensity values represented the highest and lowest pixel counts in the renal parenchymal ROIs. All pixel-intensity parameters were measured twice for each kidney. Each pixel-intensity parameter used for data analysis was the average of 4 measurements in each subject.
Fig. 1a–b.
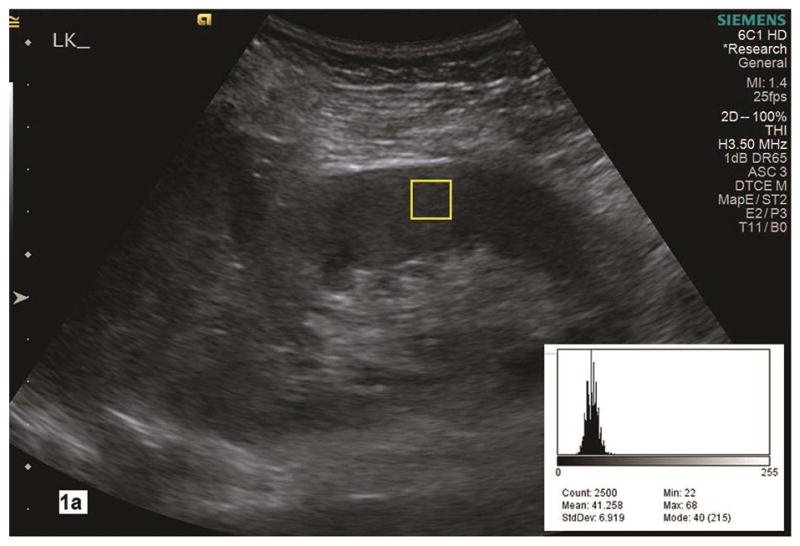
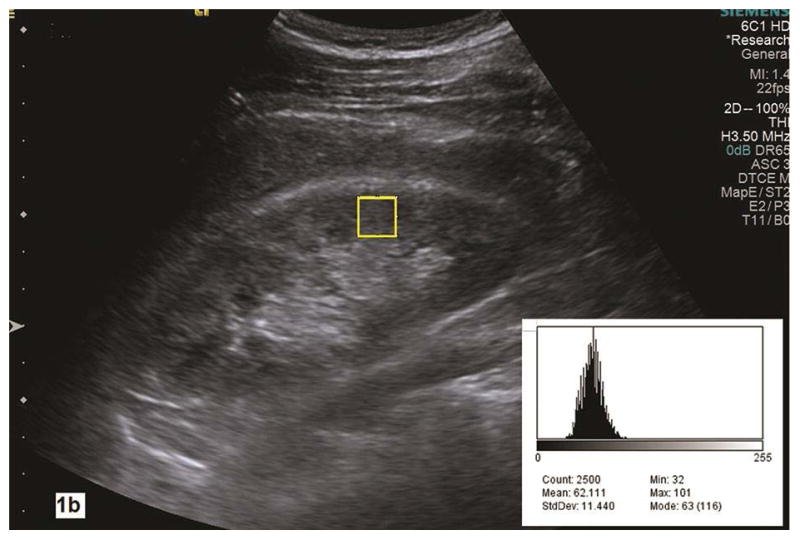
Renal parenchyma pixel-intensity is measured in the grayscale image of a longitudinal section of the kidney with Image J analysis tool. A histogram (right lower corner) shows the value of pixel counts in the region of interest (yellow rectangle box, 2500 count) in the renal cortex. In the histogram, the Max is maximal pixel value and the Min is the minimal pixel value in the region of interest. Parenchymal maximal and minimal pixel-intensities measure 68 and 22 in 1a with pathologic mild CKD whereas they are 101 and 32 in 1b with pathologic moderate to severe CKD. LK, left kidney.
Spectral Doppler parameters of the renal arteries
Spectral Doppler was performed under color flow imaging guidance to locate the renal arteries. The Doppler gate was 2–3 mm. The Doppler angle for sampling arterial flow velocity was corrected by making the direction of the emission sound beam as parallel to the flow direction as possible (at least < 30°).26 Doppler scale and pulse repetition frequency were adjusted to minimize aliasing and maximize the Doppler shift. Using electronic calipers, the peak systolic velocity (PSV, cm/s), end diastolic velocity (EDV, cm/s), and resistive index (RI) were manually measured within three interlobar arteries (adjacent to the medullary pyramids) in the cranial, mid, and caudal portions of the kidney (Fig. 2a and Fig. 2b) with the subject holding their breath at end expiration. The RI was automatically calculated with software installed in the scanner [(PSV-EDV)/PSV]. All Doppler parameters were measured twice within the interlobar arteries for a total of 6 measurements in each kidney. The mean value of PSV (EDV, RI) was the average of the 12 PSV (EDV, RI) measurements in each subject.
Fig. 2a–b.
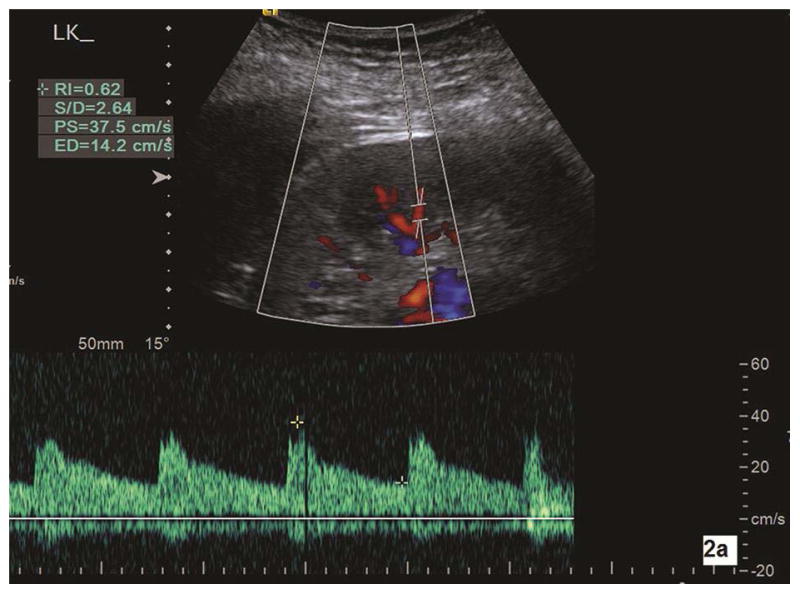
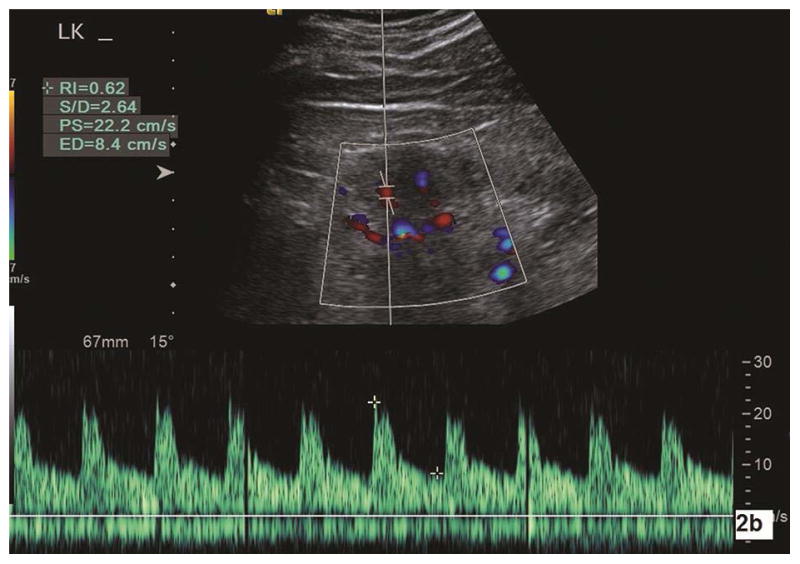
Color Doppler sonography is used to measure the intrarenal artery Doppler parameters. 2a is a longitudinal section of the left kidney in a subject with pathologic mild CKD. With corrected Doppler angle (the direction of blood flow to the direction of the sound beam) of 15°, peak systolic velocity (PS), end diastolic velocity (ED), and resistive index (RI) measure 37.5 cm/s, 14.2 cm/s, and 0.62, respectively. Doppler parameters are measured in another subject with pathologic moderate CKD (2b). With corrected Doppler angle of 15°, interlobar artery peak systolic velocity (PS), end diastolic velocity (ED), and resistive index (RI) measure 22.2 cm/s, 8.4 cm/s, and 0.62, respectively. One can note that both peak systolic velocity and end diastolic velocity in moderate CKD are significantly lower than in mild CKD. LK, left kidney.
Acoustic radiation force impulse imaging of renal cortex
Shear wave velocity (SWV, m/s) a measurement of shear wave propagation speed, is mathematically proportional to the renal cortex stiffness. 27 SWV was measured within the anterior parenchyma of the interpolar region of the kidney with VTQ. The kidney capsule and collecting system were excluded.24 SWV was measured with a breath holding maneuver (at the end of expiration). The depth of the ROI for measuring cortical SWV was 3–6 cm from the skin. The size of the ROI for measuring cortical tissue SWV was fixed at 10x5mm (Fig. 3a and Fig. 3b). The measurement was repeated if the SWV value turned out invalid (displayed as XXX/s). In total, 6 valid SWVs were measured in each kidney, and the mean SWV was the average of 12 SWVs in each subject.
Fig. 3a–b.
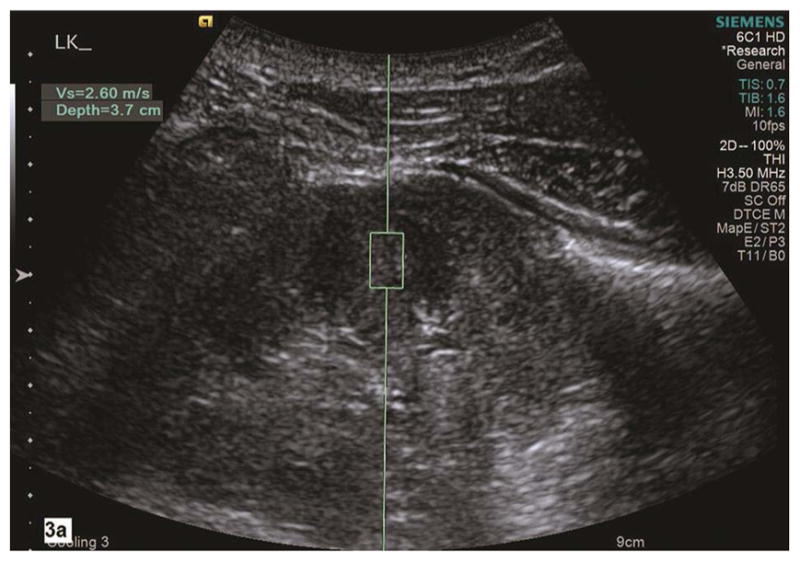
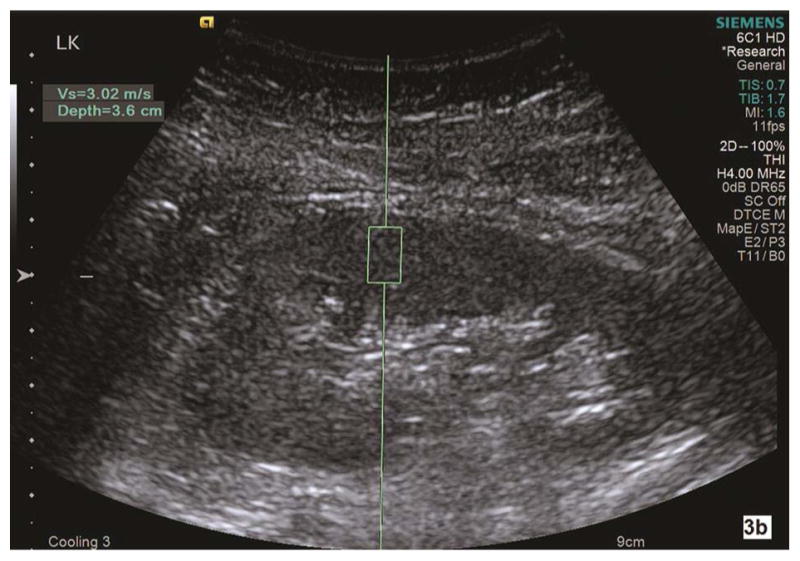
Shear wave velocity (Vs) is measured on a sagittal section of the left kidney in a healthy subject (3a). Corticomedullary differentiation is appreciated in this grayscale image of the left kidney. Using Virtual Touch Tissue Quantification (VTQ) of ARFI imaging, the region of interest (ROI) is placed in the mid portion of the kidney cortex at the depth of 3.7 cm from the skin. Shear wave velocity is 2.60 m/s in this healthy subject. The ROI is placed in mid portion of renal parenchyma between kidney capsule and collecting system. The corticomedullary differentiation appears not optimal in grayscale ultrasound image (3b). SWV measures 3.02 m/s in the left kidney in this subject with pathologic moderate CKD and eGFR 45. LK, left kidney.
The mean examination time to acquire all QUI measurements for each subject was approximately 30 minutes.
Kidney biopsy and histopathology
Ultrasound guided kidney biopsy was performed by a nephrologist using our standard protocol. The patients fasted for 8–10 hours prior to the biopsy. The procedure was performed with each subject in a prone position.
A Siemens scanner equipped with a 4V1 sector array transducer (Acuson S3000, Siemens Medical Solutions, Mountain View, California, USA) with biopsy guide (Ultra-Pro II™ Needle Guide, CIVCO Medical Instruments, Kalona, Iowa, USA) and a sterile transducer cover provided real-time, grayscale images to guide local anesthesia and biopsy. Built in ultrasound guidance software was used to display the angle and depth of the biopsy needle insertion.
The middle to lower portion of the left kidney was commonly selected for kidney biopsy and an area lacking prominent vessels on sonography was carefully chosen as the biopsy site. An 18-gauge biopsy needle (Bard Peripheral technologies, Covington, Georgia, USA) was inserted into the kidney cortex following administration of local anesthesia. Using real time ultrasound imaging guidance, special caution was paid to observe the needle path and obtain adequate biopsy specimens while avoiding damaging the renal vasculature.
The renal biopsy specimens were processed routinely and special stains were utilized: PAS (Periodic acid Schiff), Masson’s Trichrome and PAMS (Periodic acid-methenamine silver). The renal parenchyma was systematically examined with particular attention to the glomeruli, tubules, interstitium and arterial vessels.28 Parameters of chronicity were defined and the extent of glomerulosclerosis (%), interstitial fibrosis/tubular atrophy (IF/TA), interstitial inflammation/edema, and degree of arteriosclerosis were estimated to the nearest 5%. The samples were then divided into four categories [0-none/normal (Fig. 4a), 1-mild (<25%), 2-moderate (26–50%), and 3-severe (>50%, Fig. 4b)]. The scoring was based on the Banff scoring for the amount of tubular atrophy and chronic vascular sclerosis. Tubular atrophy was scored in accordance with to the criteria for tubular atrophy score (0=none, 1=1–25%, 2=25–50%, and 3=>50%) and the amount of vascular sclerosis was scored identically to the criteria for vascular fibrous initial thickening score (0= none, 1= up to 25% luminal narrowing, 2= 26–50% luminal narrowing, and 3= >50% luminal narrowing). Since there is no Banff scoring for global glomerulosclerosis we had to arbitrarily select criteria for that scoring. The interstitial inflammation/edema score was slightly different from the Banff scoring in order to make it the same as the other parameters, with the only difference being that our grade 0 was none and our grade 1 was 1–25%, and the Banff i0 is 0–10% and i1 is 10–25%. 29
Fig. 4a–b.
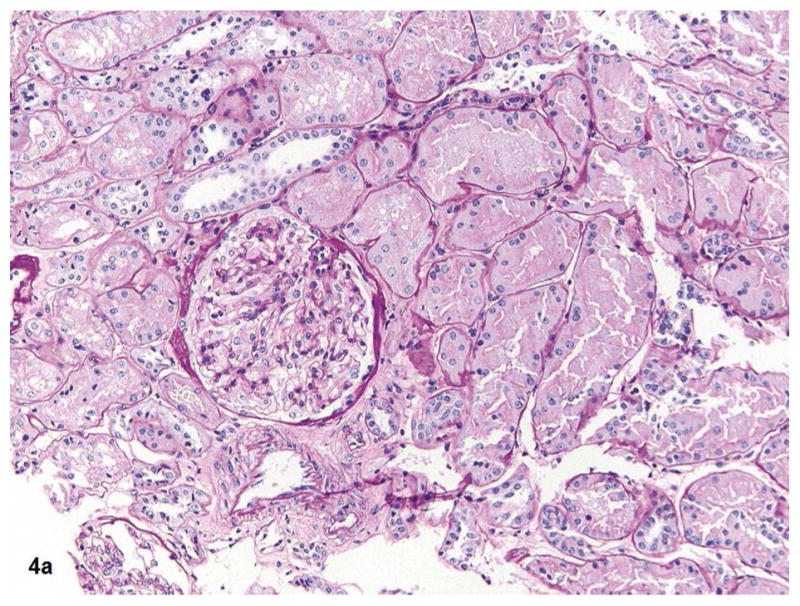
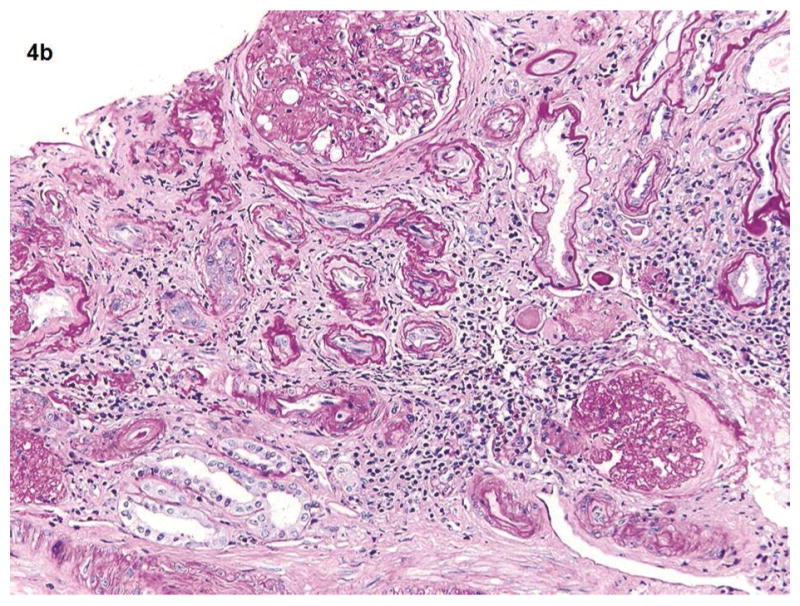
Fig 4a shows the kidney biopsy pathology from a 25 years old female with proteinuria for 3 months and normal kidney function (eGFR >60). The renal cortex shows glomerulus, tubules, and vessels within no significant global glomerulosclerosis, interstitial fibrosis, or vascular sclerosis (PAS 20x). Total kidney pathology score for this subject is 0. Fig 4b shows the kidney biopsy pathology from a 62-year-old male with long term type 2 diabetes mellitus and hypertension. His eGFR is 34. Renal cortex with severe (grade 3) interstitial fibrosis, tubular atrophy, chronic interstitial inflammation, global glomerulosclerosis and vascular sclerosis (PAS 20x). His kidney biopsy pathology result indicates a pathologic severe CKD.
We analyzed all of the above four chronic renal pathologic parameters involving the glomeruli, interstitial compartment (fibrosis and edema), and arterial vessels because the combination of all kidney pathology parameters may contribute to the change of renal function and QUI values. All 25 subjects with CKD were divided into two subgroups based on all pathology scores: group 1, pathologic mild CKD, for those with no grade 3 and < 2 of grade 2, and group 2, pathologic moderate to severe CKD, for those with at least 2 of grade 2 or 1 of grade 3.
All kidney biopsy specimens were interpreted by pathologists who have more than 30 years’ (SVS) and 5 years’ (SPS) experience in interpreting native kidney biopsy pathology and who were blinded regarding the result of QUI. However, they were aware of the subjects suspected of having CKD.
Statistical Analysis
All variables including kidney length, cortical thickness, parenchyma pixel-intensity, renal artery PSV, EDV, RI, and parenchymal SWV are expressed with mean and standard deviation (SD).
Analysis Of Variance (ANOVA) was used to assess statistical significance of differences in mean QUI measurements between healthy controls and those with mild and moderate CKD. Bonferroni correction was then applied to test the difference in the paired groups. Pearson correlation coefficient was calculated between QUI parameters and each kidney biopsy pathology score, between QUI parameters and eGFR, as well as between total kidney pathology score and kidney function (eGFR). Correlation coefficients are presented in relation to p values. The significance of the correlation coefficient (r) is scored such that r=0–0.25 indicates little or no correlation; r=0.25–0.50 indicates a fair degree of correlation; r=0.5–0.75 indicates moderate to good correlation; and r>0.75 indicates very good to excellent correlation. 30 The diagnostic performance of each QUI variable for estimating pathologic moderate to severe CKD and eGFR <60 was estimated by the area under the receiver operating characteristic curve (AUROC). 31 A p value less than 0.05 is considered a statistically significant difference.
Results
The demographic and clinical information including etiology, age, gender, body mass index (BMI, body weight in kilograms divided by the square of height in meters), the pathology results of the 25 subjects with CKD, and the demographic information of the 10 healthy controls are listed in Table 1. Both pathologists evaluated biopsies separately and reached a consensus. There was no difference in pathologic interpretation between the two pathologists.
Table 1.
Demographic characteristics of 25 subjects with CKD and 10 healthy controls
| Parameters | Healthy controls | Mild CKD | Moderate to severe CKD | Note |
|---|---|---|---|---|
| Gender (M/F) | 5/5 | 3/8 | 10/4 | 13/12 |
| Age | 39±16 | 55±16 | P= .02 | |
| eGFR (mL/min/1.73 m2) | >60 | 59.9±0.32 | 33.87±14.14 | P< .001 |
| Body mass index (BMI) | 27.8±4.9 | 28.7±5.4 | 28.8±5.8 | P= .95 |
| CKD stage | ≤ II | III and IV | ||
| Etiology | Total | |||
| Diabetic nephropathy | 1 | 3 | 4 | |
| Glomerulonephritis | 1 | 1 | 2 | |
| Lupus nephritis | 1 | 2 | 3 | |
| Ig A nephritis | 1 | 1 | 2 | |
| Hypertensive nephrosclerosis | 0 | 5 | 5 | |
| Membranous | 2 | 0 | 2 | |
| Toxic and non-specific | 4 | 3 | 7 | |
| Race | Total | |||
| African American | 2 | 2 | 3 | 5 |
| Asian | 2 | 1 | 1 | 2 |
| Latino | 2 | 1 | 2 | 3 |
| White | 3 | 4 | 4 | 8 |
| Mixed and others | 1 | 2 | 5 | 7 |
Note: Based on all scores of four kidney biopsy pathology parameters (glomerulosclerosis, arteriosclerosis, IF/TA, and interstitial inflammation), a pathologic mild CKD (Mild CKD) is for those with no grade 3 and < 2 of grade 2; and a pathologic moderate to severe CKD is for those with at least 2 of grade 2 or 1 of grade 3.
The difference in PSV, EDV, maximal pixel-intensity, minimal pixel-intensity, and cortical thickness among healthy controls, mild CKD, and moderate to severe CKD was significant (all p < 0.01) while kidney length, RI, or SWV was not (p> 0.05, Table 2). The values of PSV, EDV, and cortical thickness were inversely correlated with the kidney pathology scores (Table 3) whereas they were positively correlated with eGFR (Table 4). On the other hand, pixel-intensities were correlated positively with the pathology scores and inversely with eGFR. However, there was no statistically significant correlation of RI and SWV to pathology scores (Table 3) or to eGFR (Table 4).
Table 2.
QUI parameters in 10 healthy controls and 25 subjects with chronic kidney disease
| Parameters | Healthy control | Mild CKD * | Moderate to severe CKD | ANOVA F | AVOVA p |
|---|---|---|---|---|---|
| Subjects (n) | 10 | 11 | 14 | ||
| PSV (cm/s) | 35.03±5.45 | 33.46±5.08 | 25.13±5.33 | 12.61 | 0.000 |
| EDV (cm/s) | 14.02±2.58 | 12.8±1.66 | 8.17±1.89 | 28.19 | 0.000 |
| Resistive index | 0.60±0.04 | 0.64±0.05 | 0.66±0.05 | 4.72 | 0.016§ |
| SWV (m/s) | 2.75±0.62 | 2.86±0.32 | 2.94±0.54 | 0.41 | 0.67 |
| Maximal p-intensity | 66.7±9.02 | 78.82±9.8 | 99.18±31.05 | 7.32 | 0.002 |
| Minimal p-intensity | 14.22±3.24 | 22.55±5.64 | 29.21±15.78 | 5.75 | 0.007 |
| Kidney length (cm) | 10.86±0.73 | 11.27±0.91 | 10.99±0.99 | 0.58 | 0.56 |
| Cortex thickness (mm) | 16.16±1.21 | 14.31±1.89 | 12.58±1.88 | 12.68 | 0.000 |
Note
Pathologic mild and moderate to severe CKD groups are divided based on all scores in four kidney biopsy pathology parameters (glomerulosclerosis, arteriosclerosis, IF/TA, and interstitial inflammation). A pathologic mild CKD (Mild CKD) is for those with no grade 3 and < 2 of grade 2; and pathologic moderate to severe CKD is for those with at least 2 of grade 2 or 1 of grade 3. EDV, end diastolic velocity; p-intensity, pixel intensity; PSV, peak systolic velocity; SWV, shear wave velocity.
No significant difference in resistive index between healthy control and pathologic mild CKD, or between pathologic mild CKD and pathologic moderate to severe CKD.
Table 3.
PCC of kidney pathology scores to QUI parameters
| Parameters | GRS | IF/TA | Arteriosclerosis | Infla/Edema | Total score |
|---|---|---|---|---|---|
| Peak systolic velocity | −0.58* | −0.62 | −0.50 | −0.66 | −0.70 |
| P=0.002 | P=0.0009 | P=0.01 | P=0.0003 | P=0.0001 | |
| End diastolic velocity | −0.71 | −0.57 | −0.64 | −0.75 | −0.79 |
| P=0.00007 | P=0.003 | P=0.0005 | P=0.00002 | p=0.00 | |
| Resistive index | 0.14 | 0.38 | 0.30 | 0.34 | 0.35 |
| P=0.5 | P=0.06 | P=0.14 | P=0.09 | P=0.09 | |
| Maximal P-Intensity | 0.55 | 0.53 | 0.24 | 0.44 | 0.52 |
| P=0.004 | P=0.005 | P=0.24 | P=0.03 | P=0.008 | |
| Minimal P-Intensity | 0.45 | 0.73 | 0.28 | 0.47 | 0.57 |
| P=0.02 | P=0.00003 | P=0.18 | P=0.02 | P=0.003 | |
| Cortical thickness | −0.45 | −0.45 | −0.45 | −0.43 | −0.52 |
| P=0.02 | P=0.02 | P=0.02 | P=0.03 | P=0.008 | |
| Kidney length | −0.3 | −0.16 | −0.05 | −0.1 | −0.17 |
| P=0.15 | P=0.44 | P=0.81 | P=0.63 | P=0.42 | |
| Shear wave velocity | −0.11 | −0.21 | −0.11 | −0.01 | 0.12 |
| P=0.63 | P=0.31 | P=0.60 | P=0.97 | P=0.56 | |
| eGFR | −0.43 | −0.67 | −0.53 | −0.82 | −0.74 |
| P=0.03 | P=0.0002 | P=0.006 | P=0.000005 | P=0.00002 |
Note
R score of Pearson correlation coefficient (PCC); eGFR, estimated glomerular filtration rate; GRS, glomerulosclerosis; Infla/Edema, inflammation/edema; IF/TA, interstitial fibrosis/tubular atrophy; P-intensity, pixel intensity. P value, two-tailed. QUI, quantitative ultrasound imaging. Total score, the sum of all scores of four kidney pathologic parameters.
Table 4.
Correlation of QUI parameters to eGFR in 25 subjects with CKD
| Parameters | eGFR ≥60(n=10) | eGFR <60(n=15) | P (t-test)§ | PCC*/ p value |
|---|---|---|---|---|
| Gender M/F | 4/6 | 7/8 | ||
| Age | 35±11 | 56±16 | 0.001 | −0.47/p=0.018 |
| Disease duration (month) | 21±31 | 29±10 | 0.49 | −0.22/p=0.29 |
| eGFR (mL/min/1.73 m2) | ≥60 | 37.4±15.2 | 0.0001 | |
| Peak systolic velocity (cm/s) | 32.5±6.48 | 26.29±5.62 | 0.0007 | 0.58 / p=0.002 |
| End diastolic velocity (cm/s) | 12.16±2.07 | 8.78±2.70 | 0.0027 | 0.63 / p=0.0007 |
| Resistive index | 0.63±0.03 | 0.67±0.05 | 0.0284 | −0.33 / p=0.107 |
| Maximal P-Intensity | 81.5±8.58 | 98.03±30.58 | 0.111 | −0.58 / p=0.002 |
| Minimal P-Intensity | 20.95±8.35 | 98.03±13.29 | 0.053 | −0.47/ p=0.018 |
| Cortical thickness (mm) | 15±1.56 | 12.4±1.88 | 0.0015 | 0.47 / p=0.018 |
| Kidney length (cm) | 11.55±1 | 11.1±0.89 | 0.2489 | −0.08 / p=0.704 |
| Shear wave velocity (m/s) | 2.860.34 | 0.940.52 | 0.6618 | −0.05 / p=0.812 |
Note
PCC, Pearson correlation coefficient is used to test the correlation of QUI parameters to eGFR; eGFR <60 mL/min/1.73 m2 indicates a moderate CKD;
unpaired two tailed t-test for analyzing normally distributed data.
The area under the ROC curve (AUROC), cutoff value, sensitivity, and specificity of QUI parameters for determining pathologic moderate to severe CKD and eGFR< 60 are listed in Table 5. PSV and EDV had better diagnostic performance than other QUI parameters for determining moderate to severe CKD by both pathologies (Fig. 5a and Fig. 5b) and eGFR (Fig. 6a and Fig. 6b). The top two AUROCs for assessing pathologic moderate to severe CKD and eGFR<60 are PSV (0.88 and 0.76) and EDV (0.97 and 0.86) (Table 5).
Table 5.
ROC curve analyses of QUI parameters for pathologic moderate CKD* and eGFR <60
| Parameter | Cutoff value | AUROC | Sensitivity (%) | Specificity (%) | |||
|---|---|---|---|---|---|---|---|
| M-CKD* | eGFR<60 | M-CKD | eGFR<60 | M-CKD | eGFR<60 | ||
| PSV | 30.71 (cm/s) | 0.88 | 0.76 | 93 | 80 | 73 | 60 |
| EDV | 9.7 (cm/s) | 0.97 | 0.86 | 86 | 73 | 100 | 90 |
| RI | 0.64 | 0.65 | 0.78 | 71 | 73 | 64 | 70 |
| SWV | 2.83 (m/s) | 0.50 | 0.49 | 57 | 53 | 64 | 60 |
| Max-PI | 86.5 | 0.70 | 0.59 | 64 | 60 | 73 | 70 |
| Min-PI | 32.5 | 0.61 | 0.68 | 50 | 48 | 91 | 90 |
| Kidney Length | 10.85 (cm) | 0.63 | 0.77 | 64 | 73 | 73 | 90 |
| Cortical thickness | 14.5 (mm) | 0.75 | 0.77 | 85 | 87 | 55 | 60 |
Note
M-CKD, Pathologic moderate to severe CKD is defined as at least 2 of grade 2 or 1 of grade 3 based on all scores in four kidney pathology parameters. AUROC, the area under the receiver operating characteristics; EDV, end diastolic velocity; Max-PI, maximal pixel-intensity; Min-PI, minimal pixel-intensity; PSV, peak systolic velocity; RI, resistive index; SWV, shear wave velocity.
Fig. 5a–b.
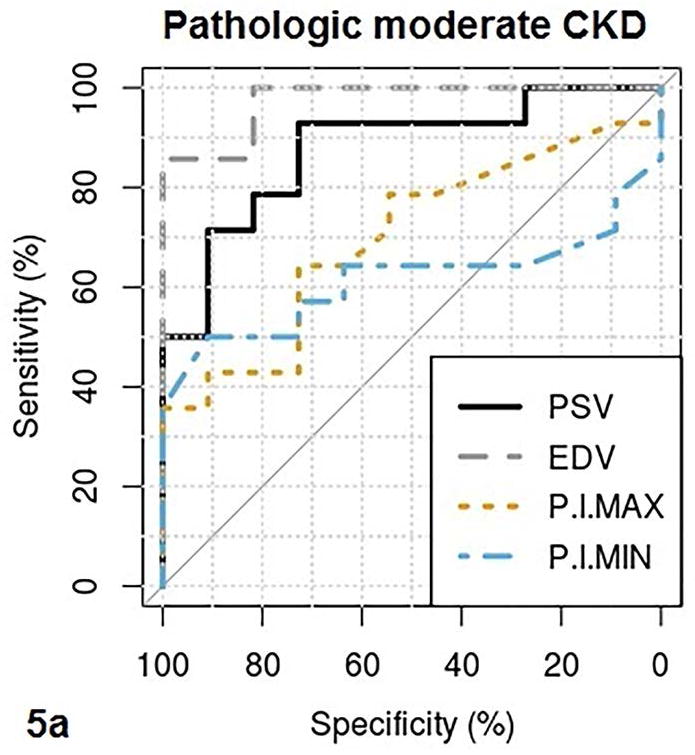
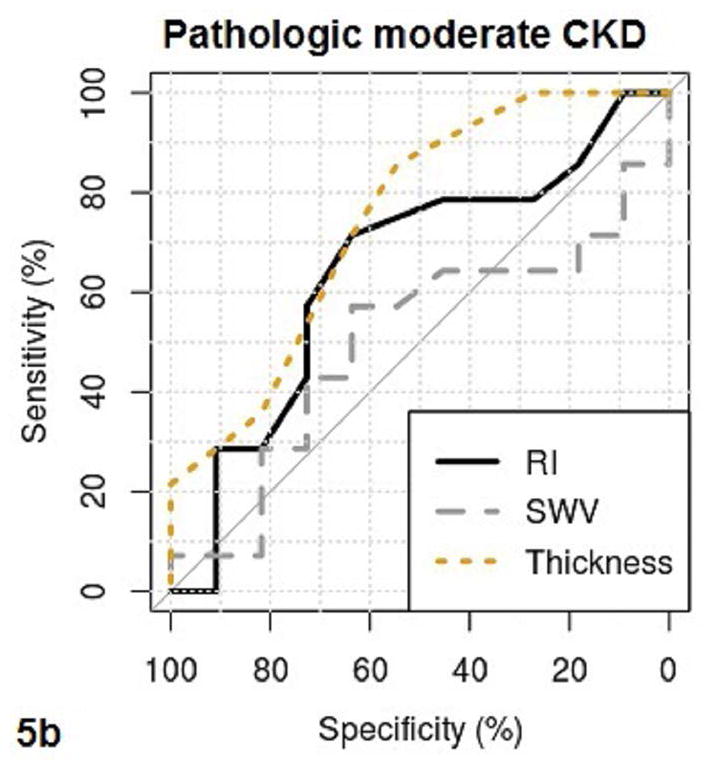
These figures show the area under the receiver operating characteristics (AUROC) of QUI parameters of PSV, EDV, maximal pixel-intensity (P.I.Max), minimal pixel-intensity (P.I.Min) (5a), and RI, SWV, cortical thickness (Thickness) (5b) for determining pathologic moderate to severe CKD. The cutoff value, sensitivity and specificity of each QUI parameter in determining pathologic moderate to severe CKD are listed in Table 5.
Fig. 6a–b.
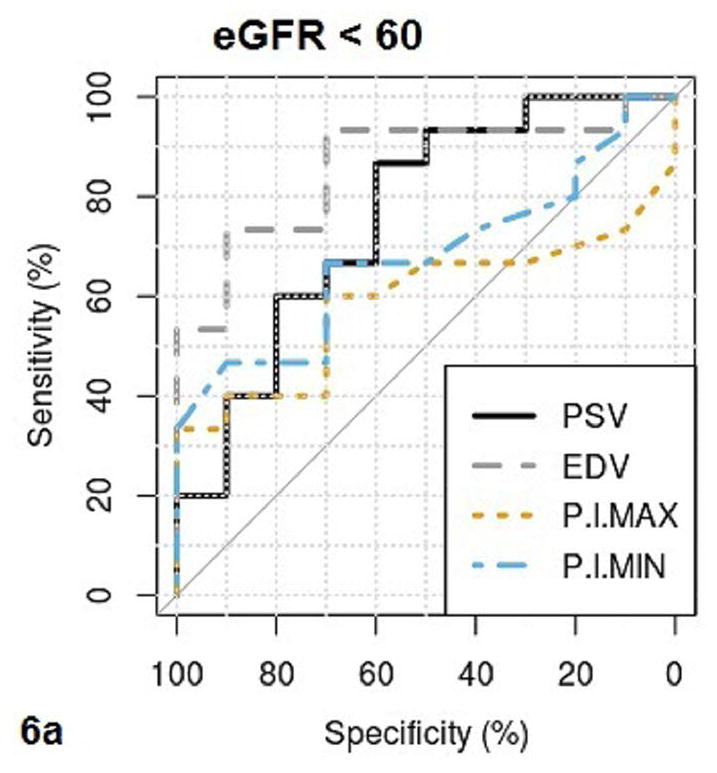
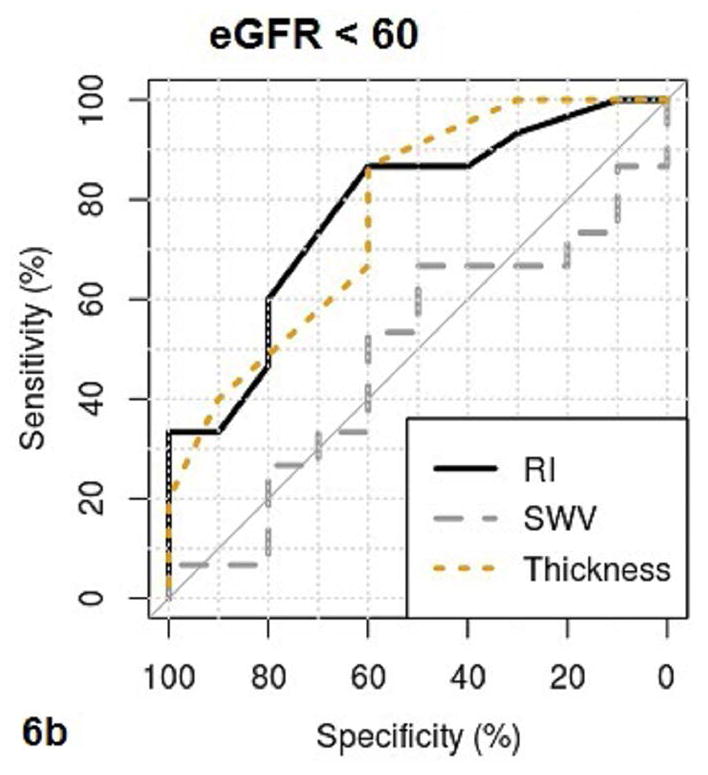
These figures show the area under the receiver operating characteristics (AUROC) of QUI parameters of PSV, EDV, maximal pixel-intensity (P.I.Max), minimal pixel-intensity (P.I.Min) (6a), and RI, SWV, cortical thickness (Thickness) (6b) for determining CKD with eGFR <60. The cutoff value, sensitivity and specificity of each QUI parameter in determining eGFR <60 are listed in Table 5.
The value of eGFR was fairly and inversely correlated to the age in CKD (r= −0.47, p=0.018) whereas it was not to the disease duration (r= −0.22, p=0.219).
All QUI parameters including the SWV measurement were successfully measured in all subjects. The overall rate of repeating the SWV measurement was 20%.
Discussion
It is established that CKD is a pathologic syndrome with variable progression that is frequently characterized by an extended subclinical period. During the progression of CKD, pathologic changes in glomeruli, interstitial space, and vasculature regions can therefore dynamically alter morphology, hemodynamics, and biomechanical properties of the renal parenchyma. However, the means to detect early and precisely grade these pathologic changes in the disease process using non-invasive imaging techniques is considered challenging because of the complexity of etiology and pathology in CKD.
In a small group of patients, we observed correlations between multiparametric QUI parameters and pathologic findings in renal biopsies in patients with CKD. It is not unanticipated that the resistive index (RI) and kidney length weakly correlated with pathologic findings. RI represents compliance and resistance of the renal arterial vasculature and cannot directly quantify intrarenal blood flow. A decrease in renal length only occurs in the late stages of CKD.9, 14 We have also observed that PSV and EDV are moderately correlated with IF/TA and arteriosclerosis. Extracellular fibrosis in IF/TA and lesions in the artery reduce the compliance and distensibility of the arteries and may diminish intrarenal blood flow in both systole and diastole (Fig. 2b). These results are consistent with our previous report describing the change of PSV and EDV in lupus nephritis with moderate interstitial fibrosis.19 Lastly, we found that PSV and EDV have a strong inverse correlation with interstitial inflammation/edema. Our results suggest that interstitial inflammation/edema appears to have the strongest effect among all pathologic changes on the reduction of intrarenal blood flow. Theoretically, moderate to severe interstitial inflammation/edema may increase the pressure in the interstitial space that ultimately limits the distensibility of the renal arteries. Consequentially, reduced intrarenal artery blood flow (perfusion) is a precursor of renal failure in CKD, which is demonstrated by significant positive correlations of both PSV and EDV, quantitative measures of intrarenal blood flow to kidney function (eGFR) in our study. Among the proposed QUI parameters, two top performance parameters in determining both pathologic moderate to severe CKD and eGFR<60 are PSV and EDV.
We also demonstrated that increased pixel-intensity was moderately correlated not only with IF/TA and glomerulosclerosis, but with interstitial inflammation/edema as well (Table 3). Pixel-intensity is a quantitative measure of the echogenicity in grayscale image. A high pixel-intensity value represents the region of interest that appears hyperechoic (Fig. 1b). Thus, a sonographic appearance of increased renal parenchymal echogenicity may result from multiple pathologic changes in CKD. In addition, we observed that kidney parenchymal pixel-intensity had a moderately inverse correlation to eGFR (Table 4). Finally, it is not surprising to note a moderately inverse correlation between total kidney pathology score and renal function, eGFR (r = − 0.74).
In this study, we did not observe the value of SWV in determining moderate CKD although ARFI imaging, a novel ultrasound elasticity technique in the assessment of liver parenchyma disease, has gained recognition.32 To date, the role of shear wave elastography for evaluating CKD is still unclear.24, 33, 34 There are several factors that may contribute to the failure of SWV in the assessment of CKD. First, compartmentalization, high tissue heterogeneities, and intrinsic tissue anisotropy in kidney parenchyma strongly affect shear wave propagation. Thus measured SWV may vary depending on the relationship of the ultrasound beam to the examined kidney tissue.21, 23, 34 Therefore, we measured SWV with the same orientation to avoid issues with anisotropy. Second, the complexity of pathologic changes may limit the value of SWV in assessing cortical stiffness. IF/TA and glomerulosclerosis may increase the stiffness of the cortex which in turn increases the SWV, whereas interstitial inflammation/edema may decrease the stiffness of the cortex which in turn decreases the speed of shear wave propagation in the tissue. Furthermore, poor cortical perfusion causing a decrease of kidney shear wave speed has been reported. 23, 35 Unfortunately, we did not find a statistically significant correlation between the kidney shear wave speed (SWV) and renal blood flow measured using spectral Doppler (PSV and EDV, all p >0.05). It is not clear the reason that our result differed from the published data. On one hand, a decreased renal cortical blood flow is a single factor, however it is not the only factor affecting the kidney shear wave speed. On the other hand, the effect on kidney shear wave speed by an acute reduction of kidney perfusion 23 may not be the same as a chronic process of decreasing cortical perfusion in CKD. Nevertheless, the tradeoffs and/or overlaps among those pathologies in CKD may magnify the heterogeneity and tissue anisotropy of renal parenchyma and the complexity of the correlation between kidney pathology and SWV, as well as mask the effect of a decreased renal blood flow on the kidney shear wave speed. Therefore, the counterpart pathological status in such a complex organ may not be fully reflected by one QUI parameter alone. Finally, the native kidneys are located deep within the retroperitoneum. SWV cannot be measured in tissue deeper than 8 cm from the skin and therefore the value of SWV measured in superficial tissues may differ from the deeper ones.34, 36 Fortunately, we were able to measure SWV at the depth of 3–6 cm from the skin in this study.
To our knowledge, this is the first report to comprehensively analyze the correlations between multiparametric QUI parameters and all kidney pathological scores in CKD (Table 3). In comparison with conventional sonography, the proposed multiparametric QUI has several advantages. First, pixel-intensity estimation can provide quantitative and objective measures of renal parenchymal echogenicity on grayscale images which overcomes the limits of conventional non-quantitative and subjective observation (where the difference in the echogenicity between the liver parenchyma and the kidney cortex is interpreted by the observer). Second, quantitative parameters of interlobar artery PSV and EDV are superior to RI in the assessment of renal hemodynamics associated with kidney pathologic changes19 and eGFR. Third, multiparametric QUI parameters have correlations with each individual kidney pathologic change as well as with the sum of changes, and such comprehensive information may improve the sensitivity in diagnosing and monitoring CKD. Finally, QUI parameters of PSV, EDV, maximal pixel-intensity, and minimal pixel-intensity have more significant correlations to kidney pathologies than to eGFR. Our results suggest that these QUI parameters seem to have higher diagnostic performance in determining pathologic moderate to severe CKD than in assessing eGFR<60.
It is anticipated that renal function (eGFR) has an inverse correlation with age in CKD because the relevance of hypertensive nephrosclerosis with the development of renal failure tends to become higher with age. 1 Lack of a significant correlation between eGFR and disease duration in this report may be the result of the heterogeneous etiology of the CKD group in the study.
There are several limitations in this study. First, the number of subjects in our study is small. We were not able to assess the feasibility of staging CKD using the proposed multiparametric QUI due to the sample size. Second, the criteria for classifying pathologic mild and moderate to severe CKD groups in the study may have limitations when interpreting the results since the kidney pathologic changes are complex. It is not unanticipated that one pathologic parameter may be significantly more dominant than the other three or that all four pathologic parameters may have similar grades. Therefore, further testing the value of multiparametric QUI in assessing CKD using standard criteria for classifying pathologic subgroups and the combination of all pathologic parameters in a large CKD patient population is warranted. Third, a single ultrasound scanner was used in the study. The difference in renal parenchyma pixel-intensity, spectral Doppler, and SWV values measured by scanners made by different manufactures was thus not tested. Finally, we provided preliminary observations of the value of the proposed multiparametric QUI parameters in determining moderate to severe CKD, however, the feasibility of using those QUI parameters to assess treatment response in patient with CKD was not investigated. Therefore, a pilot study on using the proposed multiparametric QUI markers in the early diagnosis of subclinical cases, long term monitoring of disease progression, and assessing treatment response in CKD should be encouraged.
In conclusion, our results suggest that multiparametric QUI markers may correlate with findings on kidney biopsy pathology and renal function, eGFR. Although ultrasound cannot replace kidney biopsy to establish a clinical diagnosis currently, it may be able to shed light on the chronicity of disease. As a result, ultrasound could determine whether or not obtaining a biopsy would be helpful at all in changing the management of a particular disease. Interstitial inflammation/edema may have a stronger effect than IF/TA on the change of intrarenal hemodynamics. PSV and EDV have high sensitivity and specificity in assessing moderate to severe CKD. The value of SWV in evaluating CKD needs further investigation. Validating the proposed multiparametric QUI in a large CKD patient population is warranted.
Acknowledgments
The authors acknowledge Siemens Medical Solutions for loaning S3000 ultrasound scanner to support this study.
The study was supported by WCM-CTSC and NIH/NCATS Grant # UL1TR000457.
Abbreviations
- ARFI
Acoustic radiation force impulse
- CKD
chronic kidney disease
- EDV
end diastolic velocity
- eGFR
estimated glomerular filtration rate
- PSV
peak systolic velocity
- QUI
quantitative ultrasound imaging
- RI
resistive index
- SWV
shear wave velocity
References
- 1.Levey AS, Stevens LA, Schmid CH, et al. CKD-EPI (Chronic Kidney Disease Epidemiology Collaboration). A new equation to estimate glomerular filtration rate. Ann Intern Med. 2009;150:604–612. doi: 10.7326/0003-4819-150-9-200905050-00006. [DOI] [PMC free article] [PubMed] [Google Scholar]
- 2.El Nahas M. The global challenge of chronic kidney disease. Kidney Int. 2005;68:2918–2929. doi: 10.1111/j.1523-1755.2005.00774.x. [DOI] [PubMed] [Google Scholar]
- 3.Liu Y. Cellular and molecular mechanisms of renal fibrosis. Nat Rev Nephrol. 2011;7:684–696. doi: 10.1038/nrneph.2011.149. [DOI] [PMC free article] [PubMed] [Google Scholar]
- 4.Boffa JJ, Lu Y, Placier S, Stefanski A, Dussaule JC, Chatziantoniou C. Regression of renal vascular and glomerular fibrosis: role of angiotensin II receptor antagonism and matrix metalloproteinases. J Am Soc Nephrol. 2003;14:1132–1144. doi: 10.1097/01.asn.0000060574.38107.3b. [DOI] [PubMed] [Google Scholar]
- 5.Jha V, Garcia-Garcia G, Iseki K, et al. Chronic kidney disease: global dimension and perspectives. Lancet. 2013;382:260–272. doi: 10.1016/S0140-6736(13)60687-X. [DOI] [PubMed] [Google Scholar]
- 6.Chatziantoniou C, Boffa JJ, Tharaux PL, Flamant M, Ronco P, Dussaule JC. Progression and regression in renal vascular and glomerular fibrosis. Int J Exp Pathol. 2004;85:1–11. doi: 10.1111/j.0959-9673.2004.00376.x. [DOI] [PMC free article] [PubMed] [Google Scholar]
- 7.Di Angelantonio E, Chowdhury R, Sarwar N, Aspelund T, Danesh J, Gudnason V. Chronic kidney disease and risk of major cardiovascular disease and non-vascular mortality: prospective population based cohort study. BMJ. 2010 Sep 30;341:c4986. doi: 10.1136/bmj.c4986. [DOI] [PMC free article] [PubMed] [Google Scholar]
- 8.Hallan SI, Dahl K, Oien CM, et al. Screening strategies for chronic kidney disease in the general population: follow-up of cross sectional health survey. BMJ. 2006;333(7577):1047. doi: 10.1136/bmj.39001.657755.BE. Epub 2006 Oct 24. [DOI] [PMC free article] [PubMed] [Google Scholar]
- 9.Tao JL, Li H, Li C, et al. Risk factors of postrenal biopsy bleeding. Acta Acad Med Sin. 2008;30:313–317. [PubMed] [Google Scholar]
- 10.Paige NM, Nagami GT. The top 10 things nephrologists wish every primary physician knew. Mayo Clin Proc. 2009;84:180–186. doi: 10.4065/84.2.180. [DOI] [PMC free article] [PubMed] [Google Scholar]
- 11.Pei XL, Xie JX. Functional MRI: Evaluation of chronic kidney disease with perfusion imaging. Acad Radiol. 2009;16:88–95. doi: 10.1016/j.acra.2008.07.002. [DOI] [PubMed] [Google Scholar]
- 12.Thomsen HS. Nephrogenic systemic fibrosis: A serious late adverse reaction to gadodiamide. Eur Radiol. 2006;16:2619–2621. doi: 10.1007/s00330-006-0495-8. [DOI] [PMC free article] [PubMed] [Google Scholar]
- 13.Gleeson TG, Bulugahapitiya S. Contrast-induced nephropathy. AJR. 2004;183:1673–1689. doi: 10.2214/ajr.183.6.01831673. [DOI] [PubMed] [Google Scholar]
- 14.Krumme B. Renal Doppler sonography - update in clinical nephrology. Nephron Clin Pract. 2006;103:c24–c28. doi: 10.1159/000090605. [DOI] [PubMed] [Google Scholar]
- 15.Manley JA, O’Neill WC. How echogenic is echogenic? Quantitative acoustics of the renal cortex. AJKD. 2001;37:706–711. doi: 10.1016/s0272-6386(01)80118-9. [DOI] [PubMed] [Google Scholar]
- 16.Shivashankara VU, Shivalli S, Pai BH, et al. A comparative study of sonographic grading of renal parenchymal changes and estimated glomerular filtration rate (eGFR) using modified diet in renal disease formula. J Clin Diagn Res. 2016;10:TC09–TC11. doi: 10.7860/JCDR/2016/16986.7233. [DOI] [PMC free article] [PubMed] [Google Scholar]
- 17.Bigé N, Lévy PP, Callard P, et al. Renal arterial resistive index is associated with severe histological changes and poor renal outcome during chronic kidney disease. BMC Nephrol. 2012;13:139. doi: 10.1186/1471-2369-13-139. [DOI] [PMC free article] [PubMed] [Google Scholar]
- 18.Chen QK, He F, Feng XR, et al. Correlation of Doppler parameters with renal pathology: A study of 992 patients. Experimental and Therapeutic Medicine. 2014;7:439–442. doi: 10.3892/etm.2013.1442. [DOI] [PMC free article] [PubMed] [Google Scholar]
- 19.Gao J, Chevalier J, Auh YH, et al. Correlation between Doppler parameters and renal cortical fibrosis in lupus nephritis: a preliminary observation. Ultrasound Med Biol. 2013;39:275–282. doi: 10.1016/j.ultrasmedbio.2012.10.009. [DOI] [PubMed] [Google Scholar]
- 20.Hanamura K, Tojo A, Kinugasa S, Asaba K, Fujita T. The resistive index is a marker of renal function, pathology, prognosis, and responsiveness to steroid therapy in chronic kidney disease patients. Int J Nephrol. 2012:1395–1365. doi: 10.1155/2012/139565. [DOI] [PMC free article] [PubMed] [Google Scholar]
- 21.Brenier N, Gennisson JL, Cornelis F, Le Bras Y, Couzi L. Renal ultrasound elastography. Diagn Interv Imaging. 2013;94:545–550. doi: 10.1016/j.diii.2013.02.003. [DOI] [PubMed] [Google Scholar]
- 22.Gallotti A, D’Onofrio M, Pozzi Mucelli R. Acoustic radiation force impulse (ARFI) technique in ultrasound with virtual touch tissue quantification of the upper abdomen. Radiol Med. 2010;115:889–892. doi: 10.1007/s11547-010-0504-5. [DOI] [PubMed] [Google Scholar]
- 23.Gennisson JL, Grenier N, Combe C, Tanter M. Supersonic shear wave elastography of in vivo pig kidney: influence of blood pressure, urinary pressure and tissue anisotropy. Ultrasound Med Biol. 2012;38:1559–1567. doi: 10.1016/j.ultrasmedbio.2012.04.013. [DOI] [PubMed] [Google Scholar]
- 24.Goya C, Kilinc F, Hamidi C, et al. Acoustic radiation force impulse imaging for evaluation of renal parenchyma elasticity in diabetic nephropathy. AJR. 2015;204:324–329. doi: 10.2214/AJR.14.12493. [DOI] [PubMed] [Google Scholar]
- 25.Emamian SA, Nielen MB, Pedersen JF. Intraobserver and interobserver variations in sonographic measurements of kidney size in adult volunteers: A comparison of linear measurements and volumetric estimates. Acta Radiologica. 1995;36:399–401. [PubMed] [Google Scholar]
- 26.Gao J, Hentel K, Zhu Q, et al. Doppler angle correction in the measurement of intrarenal parameters. Int J Nephrol Renovasc Dis. 2011;4:49–55. doi: 10.2147/IJNRD.S17811. [DOI] [PMC free article] [PubMed] [Google Scholar]
- 27.Bob F, Bota S, Sporea I, Sirli R, Popescu A, Schiller A. Relationship between the estimated glomerular filtration rate and kidney shear wave speed values assesses by acoustic radiation force impulse elastography. J Ultrasound Med. 2015;34:649–54. doi: 10.7863/ultra.34.4.649. [DOI] [PubMed] [Google Scholar]
- 28.National Kidney Foundation. K/DOQI clinical practice guidelines for chronic kidney disease: evaluation, classification, and stratification. Am J Kidney Dis. 2002;39(Suppl 1):S1–S266. [PubMed] [Google Scholar]
- 29.Racusen LC, Solez K, Colvin RB, et al. The Banff 97 working classification of renal allograft pathology. Kidney Int. 1999;55:713–723. doi: 10.1046/j.1523-1755.1999.00299.x. [DOI] [PubMed] [Google Scholar]
- 30.Levey AS, Eckardt KU, Tsukamoto Y, et al. Definition and classification of chronic kidney disease: A position statement from kidney disease: Improve global outcome (KDIGO) Kidney Int. 2005;67:2089–2100. doi: 10.1111/j.1523-1755.2005.00365.x. [DOI] [PubMed] [Google Scholar]
- 31.Hanley JA, McNeil BJ. The meaning and use of the area under a Receiver Operating Characteristic (ROC) curve. Radiology. 1982;143:29–36. doi: 10.1148/radiology.143.1.7063747. [DOI] [PubMed] [Google Scholar]
- 32.Barr RG, Ferraioli G, Palmeri ML, et al. Elastography assessment of liver fibrosis: Society of radiology in ultrasound consensus conference statement. Radiology. 2015;276:845–861. doi: 10.1148/radiol.2015150619. [DOI] [PubMed] [Google Scholar]
- 33.Guo LH, Xu HX, Fu HJ, Peng A, Zhang YF, Liu LN. Acoustic radiation force impulse imaging for noninvasive evaluation of renal parenchyma elasticity: preliminary findings. PloS One. 2013;8:e68925. doi: 10.1371/journal.pone.0068925. [DOI] [PMC free article] [PubMed] [Google Scholar]
- 34.Wang L, Xia P, Han J, et al. Assessment of renal tissue elasticity by acoustic radiation force impulse quantification with histopathological correlation: preliminary experience in chronic kidney disease. Eur Radiol. 2014;24:1694–1699. doi: 10.1007/s00330-014-3162-5. [DOI] [PubMed] [Google Scholar]
- 35.Warner L, Yin M, Glaser KJ, et al. Noninvasive in vivo assessment of renal tissue elasticity during graded renal ischemia suing MR elastography. Invest Radiol. 2011;46:509–514. doi: 10.1097/RLI.0b013e3182183a95. [DOI] [PMC free article] [PubMed] [Google Scholar]
- 36.Bruno C, Minniti S, Bucci A, Mucelli RP. ARFI: from basic principles to clinical applications in diffuse chronic disease- a review. Insights Imaging. 2016;7:735–746. doi: 10.1007/s13244-016-0514-5. [DOI] [PMC free article] [PubMed] [Google Scholar]


