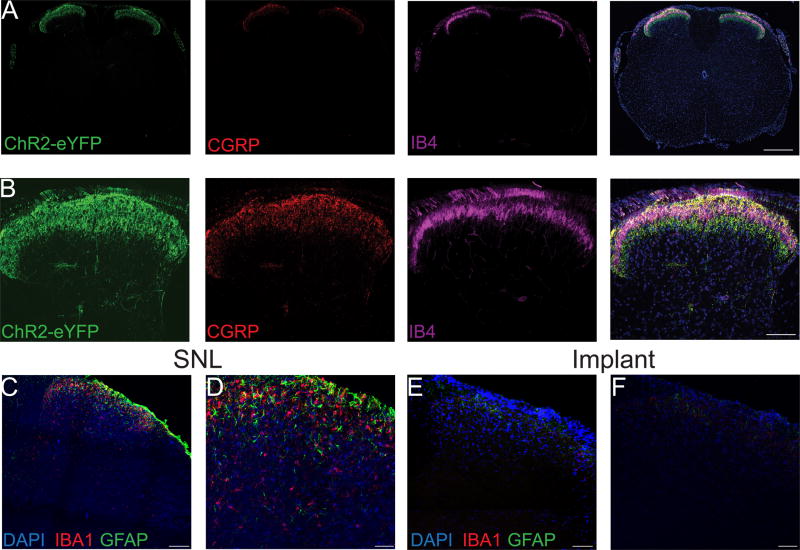
Figure 3. Anatomical and histological characterization of the spinal cord in TRPV1-ChR2 mice.
Transverse sections of spinal cord from TRPV1-ChR2 mice at low (A) and high (B) magnification showing ChR2+ (green) terminals in the dorsal horn overlapping with CGRP (red) in lamina I and IB4 (magenta) in lamina II. Low magnification and high magnification confocal images of a transverse section of the lumbar spinal cord from a mouse with spinal nerve ligation. Scale bar is 350 µm for low magnification images and 125 µm for high magnification images. (C, D) and from a mouse implanted with the optoelectronic device (E, F) for three weeks. DAPI (blue), GFAP (green) marks reactive astrocytes and Iba1 (red) marks activated microglia. Scale bar is 125 µm for low magnification images and 80 µm for high magnification images.

