

Summary
Chemical libraries paired with phenotypic screens can now readily identify compounds with therapeutic potential. A central limitation to exploiting these compounds, however, has been in identifying their relevant cellular targets. Here, we present a two-tiered CRISPR-mediated chemical-genetic strategy for target identification: combined genome-wide knockdown and overexpression screening as well as focused, comparative chemical-genetic profiling. Application of these strategies to rigosertib, a drug in phase 3 clinical trials for high-risk myelodysplastic syndrome whose molecular target had remained controversial, pointed singularly to microtubules as rigosertib’s target. We showed that rigosertib indeed directly binds to and destabilizes microtubules using cell biological, in vitro, and structural approaches. Finally, expression of tubulin with a structure-guided mutation in the rigosertib-binding pocket conferred resistance to rigosertib, establishing that rigosertib kills cancer cells by destabilizing microtubules. These results demonstrate the power of our chemical-genetic screening strategies for pinpointing the physiologically relevant targets of chemical agents.
Keywords: CRISPRi, CRISPRa, chemical genetics, genome-wide CRISPR screening, drug target identification, drug mechanism of action, rigosertib, microtubules
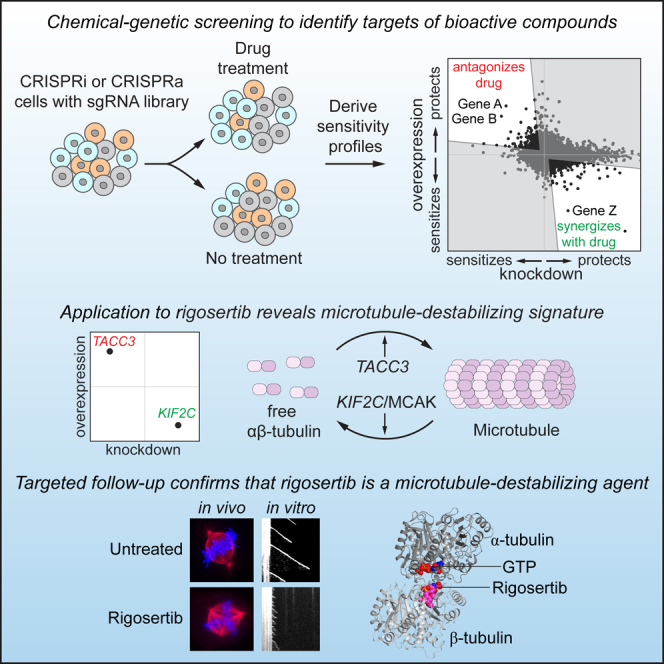
Graphical Abstract
Highlights
-
•
Combined CRISPRi/a chemical-genetic screening reveals targets of therapeutic agents
-
•
Focused chemical-genetic profiling rapidly classifies agents by mechanism of action
-
•
Chemical-genetic screens with rigosertib reveal a microtubule-destabilizing signature
-
•
Targeted in vivo and in vitro approaches confirm rigosertib’s mechanism of action
Jost et al. present a two-tiered strategy to identify molecular targets of bioactive compounds using CRISPRi/a-mediated chemical-genetic screens. Application to rigosertib, an anti-cancer drug with an unclear mechanism of action, points to rigosertib being a microtubule-destabilizing agent. Targeted cell biological, biochemical, and structural approaches confirm this mechanism of action.
Introduction
The ready availability of genomic sequence information, combined with conceptual advances in our understanding of the molecular etiology of diseases, is enabling precision medicine efforts, which seek to develop rational therapies that specifically address the molecular and genetic basis of a disease (Ashley, 2016). Critical to these efforts are therapeutic agents with well-defined targets and high specificity for these targets as well as a comprehensive understanding of how the efficacy of these agents is affected by different genetic backgrounds. Identifying the targets, off-target activities, and genetic dependencies of chemical agents, however, remains one of the principal obstacles in drug development (Nijman, 2015). This obstacle has hampered the use of natural products and small molecules identified as lead compounds in cell-based screens, creating an urgent need for methods that enable accurate and comprehensive characterization of mechanisms of action of small molecules to guide further development and treatment applications.
Hypothesis-free evaluation of a molecule’s mechanism of action using systematic genetic screening provides a potential solution to these challenges (Ho et al., 2011, Smith et al., 2010). Extensive efforts in yeast have yielded high-throughput chemical-genetic methods for identifying the molecular targets of drugs, in which drug sensitivity is systematically profiled for a library of strains with increased or decreased gene expression levels (reviewed in Ho et al., 2011, Smith et al., 2010). These methods are based on the principle that sensitivity to a drug is generally correlated to the expression levels of the components of the pathway it targets. Combining knockdown and overexpression profiling has provided particular utility, as both the direct target and modifiers of sensitivity can be identified with high precision (Hoon et al., 2008). In human cells, knockdown and knockout screens have already aided the identification of drug targets and of biomarkers predictive of responsive patient populations in selected cases (reviewed in Kampmann, 2017), and the value of overexpression has been demonstrated in targeted approaches, for example in validating the AAA-ATPase p97 (VCP) as the target of CB-5083 (Anderson et al., 2015), underscoring the potential of these methods for drug target identification. With the advent of CRISPR-based screening platforms for inhibiting (CRISPRi) or activating (CRISPRa) gene expression (reviewed in Dominguez et al., 2016), it has now become feasible to combine genome-wide overexpression and knockdown screens, laying the groundwork for a systematic chemical-genetic strategy to identify the targets of drug candidates and other small molecules in human cells.
The challenges in identifying the targets of drug candidates are clearly illustrated in the development of rigosertib (Estybon, ON 01910.Na; Figure 1A), a promising small molecule under clinical evaluation as an anti-cancer drug whose molecular target and mechanism of action remain unresolved. Rigosertib’s promise stems from its cytotoxic activity against a broad range of cancer cell lines, inducing mitotic arrest and apoptosis in these cells, as well as potent inhibition of tumor growth in mouse models (Gumireddy et al., 2005, Reddy et al., 2011). Rigosertib was originally identified in a screen for inhibitors of polo-like kinase 1 (PLK1) (Gumireddy et al., 2005), but comparison of the cellular phenotypes elicited by treatment with rigosertib and the well-characterized PLK1 inhibitor BI2536 revealed marked differences (Steegmaier et al., 2007). It was also proposed that rigosertib inhibits phosphatidylinositol 3-kinase (PI3K) signaling (Prasad et al., 2009), but it is unclear whether this effect is through direct inhibition of PI3K. In addition, a microscopy-based screen classified rigosertib with microtubule-destabilizing agents (Twarog et al., 2016), but in vitro assays of rigosertib’s activity against microtubules have yielded conflicting results (Gumireddy et al., 2005, Lu et al., 2015, Oussenko et al., 2011). Finally, rigosertib was proposed to serve as a molecular RAS mimetic that inhibits RAS signaling (Athuluri-Divakar et al., 2016), but it was subsequently argued that rigosertib impacts RAS signaling indirectly through JNK-mediated inactivation of SOS1, B-Raf, and C-Raf (Ritt et al., 2016). Thus, despite a decade of studies and encouraging efficacy and tolerance in early clinical trials (Silverman et al., 2015), rigosertib’s molecular target(s) remains undefined, impeding its clinical development. Results from a recent phase 3 clinical trial indicated that rigosertib has no overall benefit in treatment of myelodysplastic syndrome, but detailed analysis suggested that rigosertib could benefit a subgroup of patients, which has motivated an ongoing phase 3 clinical trial (Garcia-Manero et al., 2016). Clearly, efforts to identify a cohort of patients who could benefit from rigosertib would be facilitated by knowledge of its targets and genetic dependencies. More broadly, the example of rigosertib underscores the difficulty in definitively identifying the molecular target and mechanism of action of a small molecule even when it has robust cell biological effects, a challenge that has plagued both clinical pharmacology and chemical-genetic efforts (Arrowsmith et al., 2015, Munoz, 2017).
Figure 1.

Genome-Scale Screens for Rigosertib Sensitivity Connect Rigosertib to Microtubules
(A) Chemical structure of rigosertib.
(B) Schematic of rigosertib sensitivity screens and formula for calculation of sensitivity phenotypes (ρ). Doubling differences refer to differences in population doublings between untreated and treated populations.
(C) Rigosertib sensitivity phenotypes for all sgRNAs from two biological replicates of genome-scale CRISPRi (top) and CRISPRa (bottom) screens.
(D) CRISPRi and CRISPRa rigosertib sensitivity phenotypes for all genes. Spots are colored by their strongest untreated growth phenotype (γ), as indicated (CRISPRi and CRISPRa untreated growth phenotypes are mutually exclusive for most genes; Gilbert et al., 2014). Microtubule-associated genes with strong phenotypes are labeled (black). Other hits with anticorrelated CRISPRi/CRISPRa phenotypes are also labeled (gray) but could reflect effects specific to our BCR-ABL-transformed myeloid K562 cell line (e.g., KLF1 and BCR) or could affect sensitivity by modulating cell death pathways (e.g., apoptosis factors BAK1 and BCL2L1 or proliferation-associated genes MAP2K3 and SOS1).
(E) DAVID annotation clusters of genes with strong phenotypes in both the CRISPRi and CRISPRa screen.
(F) Schematic representation of the tubulin/microtubule equilibrium and the effects of various genes and drugs.
See also Figure S1.
Here, we present a generalizable chemical-genetic strategy that combines CRISPRi and CRISPRa screens to define the mechanism of action of chemical agents, and we apply it to identify the target of rigosertib. A challenge facing any chemical-genetic approach is that modulating expression of many genes can impact sensitivity to a drug through indirect effects (e.g., by slowing cell growth), impeding identification of the direct target. We show that our integrated CRISPRi/a approach overcomes this challenge by providing a filter for removing genes that impact drug sensitivity through such indirect mechanisms, enabling identification of genes whose protein levels directly dictate drug sensitivity. Indeed, genome-wide profiling of rigosertib sensitivity in this manner strongly implicated microtubule destabilization as rigosertib’s main mechanism of action. Comparison to other drugs using focused chemical-genetic profiling similarly suggested that rigosertib acts as a microtubule-destabilizing agent, which we then confirmed using targeted approaches. Our results reveal the mechanism of cancer cell killing by rigosertib as well as genetic dependencies of rigosertib sensitivity, possibly informing patient selection and providing routes for rational engineering toward improved clinical utility. More broadly, this work serves as a general blueprint for the use of CRISPR-based chemical-genetic screens in drug target identification.
Results
Genome-wide CRISPRi and CRISPRa Screens Connect Rigosertib to Microtubule Destabilization
We first sought to identify genetic modulators of rigosertib sensitivity in a genome-wide and unbiased manner. For this purpose, we leveraged our CRISPRi/CRISPRa functional genomics platform to screen for genes whose knockdown or overexpression affects sensitivity to rigosertib (Figure 1B). Briefly, we infected chronic myeloid leukemia (K562) cells expressing either dCas9-KRAB (CRISPRi) (Gilbert et al., 2013) or dCas9 fused to the SunTag (SunCas9) and a SunTag-binding single-chain antibody fused to VP64 (CRISPRa) (Tanenbaum et al., 2014) with our first-generation genome-scale CRISPRi and CRISPRa sgRNA (single-guide RNA) libraries (targeting 15,977 genes) (Gilbert et al., 2014). After harvesting a subpopulation at the outset of the experiment (t0), we cultured the remaining cells at a coverage of >1,000 cells/sgRNA without treatment or with rigosertib treatment. We then measured the relative abundance of each sgRNA in each population by next-generation sequencing to reveal how each sgRNA affects growth in the absence of rigosertib (γ) and sensitivity to rigosertib (ρ). In particular, ρ represents the normalized difference in abundance between the treated and untreated populations for each sgRNA (Figure 1B; STAR Methods) (Kampmann et al., 2013), with ρ > 0 indicating that expression of the sgRNA confers protection against treatment and ρ < 0 indicating sensitization. Rigosertib sensitivity phenotypes of targeting sgRNAs were well correlated in biological replicates (for sgRNAs with |ρ| > 0.1 in either replicate, Pearson r2 [CRISPRi] = 0.70, Pearson r2 [CRISPRa] = 0.61), whereas those of non-targeting control sgRNAs were clustered around zero (Figure 1C). The resulting gene-level phenotypes revealed 1,102 genes for which knockdown or overexpression strongly affects rigosertib sensitivity (|ρ| > 0.15; Figures 1D and S1A; Data S1).
The majority of genes with strong effects on rigosertib sensitivity have protective phenotypes only in either the CRISPRi or the CRISPRa screens (hits along the axes in Figure 1D). Most of these protective phenotypes, however, are correlated with substantial negative effects on growth in the absence of rigosertib (Figure S1B), suggesting that the protective phenotypes could be caused by indirect effects on rigosertib sensitivity mediated through broader changes in cell physiology. For example, knockdown of carbamoyl phosphate synthetase 2 (CAD) strongly protects cells against rigosertib, but it also reduces untreated cell growth dramatically (γ = −0.51) and leads to cell-cycle arrest in S phase (Adamson et al., 2016). Thus, CAD knockdown could protect against rigosertib simply by preventing cells from reaching mitosis, the cell-cycle phase that is likely affected by rigosertib (Gumireddy et al., 2005). Other essential genes, such as those encoding subunits of the mitochondrial ribosome, similarly have protective phenotypes in CRISPRi but no phenotypes in CRISPRa. Conversely, genes with growth phenotypes in CRISPRa have protective phenotypes in CRISPRa but generally no phenotypes in CRISPRi. Gene enrichment analyses of hits from either screen alone show the strongest enrichments for categories comprising these essential genes (Figures S1C and S1D).
To prioritize hits, we therefore compared the CRISPRi and CRISPRa phenotypes for all genes (Figures 1D and 1E), reasoning that genes directly involved in the process(es) targeted by rigosertib might have strong and oppositely signed phenotypes. In this comparison, two genes stood out: KIF2C and TACC3. KIF2C is the most sensitizing hit in the CRISPRa screen and a strongly protective hit in the CRISPRi screen, whereas KIF2C knockdown has no effect on untreated growth. Conversely, TACC3 knockdown sensitizes cells to rigosertib, whereas overexpression is protective. Notably, both genes are involved in regulating microtubule dynamics (Figure 1F): KIF2C encodes the microtubule depolymerase MCAK (Tanenbaum et al., 2011) and TACC3 is a microtubule-binding protein that, directly or indirectly, promotes microtubule stability, especially during mitosis (Hood and Royle, 2011). Similarly, rigosertib sensitivity is affected by modulation of several tubulin isoform-encoding genes as well as other microtubule-associated genes, including TACC3- and KIF2C-interacting proteins such as CKAP5 and KIF18B (Figure 1D). Thus, genetic manipulations that destabilize microtubules sensitize cells to rigosertib, whereas stabilization of microtubules protects cells against rigosertib, suggesting that rigosertib’s cytotoxicity, directly or indirectly, arises from a perturbation of the microtubule network (Figure 1F).
The Genetic Interaction between Rigosertib and Microtubules Is Robust and Found in Multiple Cell Lines
To validate the screen results, we measured the effects of KIF2C and TACC3 knockdown or overexpression on rigosertib sensitivity in individual re-tests. We infected K562 CRISPRi and CRISPRa cells with constructs expressing KIF2C- or TACC3-targeting sgRNAs or a non-targeting control sgRNA and used flow cytometry to monitor how the fraction of sgRNA-expressing cells changed after treatment with rigosertib (Kampmann et al., 2013, Gilbert et al., 2014). In this internally controlled growth assay, an increase or decrease in the fraction of sgRNA-expressing cells indicates that sgRNA-expressing cells grow faster or slower than untransduced cells, respectively. Thus, relative enrichment >1 indicates that expression of the sgRNA confers protection against treatment, whereas enrichment <1 indicates sensitization. Consistent with the screen phenotypes, K562 CRISPRi cells expressing a KIF2C-targeting sgRNA were enriched after rigosertib treatment, whereas K562 CRISPRi cells expressing a TACC3-targeting sgRNA were depleted after rigosertib treatment (Figure 2A). K562 CRISPRa cells exhibited the opposite behavior (Figure S2A). We confirmed knockdown or overexpression of KIF2C and TACC3 by qRT-PCR (Figure S2B). Thus, the expression levels of KIF2C and TACC3 reproducibly dictate rigosertib sensitivity and resistance.
Figure 2.

Rigosertib’s Chemical-Genetic Interactions Are Reproducible and Found in Multiple Cell Lines
(A) Internally controlled rigosertib sensitivity assays performed with sgRNAs targeting KIF2C or TACC3 in K562 CRISPRi cells. Cells transduced with the sgRNA expression constructs (marked with blue fluorescent protein [BFP]) were treated with rigosertib or DMSO 4 days after transduction. Enrichment of sgRNA-expressing cells was measured 5 days after treatment by flow cytometry as the enrichment of BFP-positive cells [e = fraction(BFP+) / (1 − fraction(BFP+)], calculated relative to the DMSO-treated control cells.
(B) Sensitivity assay in HeLa CRISPRi cells, as in (A).
(C) Sensitivity assay in H358 CRISPRi cells, as in (A) with the following changes: sgRNA expression constructs were marked with GFP, and cells were treated 7 days after transduction.
All data represent mean ± SD for replicate infections and treatments (n = 3). See also Figure S2.
Knockdown of KIF2C also protected both HeLa (cervical carcinoma) and H358 cells (non-small-cell lung cancer) against rigosertib, as indicated by enrichment of sgRNA-expressing cells, and knockdown of TACC3 sensitized both cell lines to rigosertib (Figures 2B, 2C, S2C, and S2D). By contrast, knockdown of KIF2C or TACC3 did not alter the sensitivity of the H358 cells, which are driven by an activating G12C mutation in KRAS, to the specific K-RAS(G12C) inhibitor ARS-853 (Patricelli et al., 2016), indicating that rigosertib does not act on the RAS pathway, as had been suggested recently (Athuluri-Divakar et al., 2016). Together, these results suggest that rigosertib’s genetic interactions and consequently its mechanism of action are conserved across different cell types.
The Chemical-Genetic Profile of Rigosertib Resembles Those of Microtubule-Destabilizing Agents
The genome-wide screen indicated that genetic destabilization of microtubules potentiates rigosertib’s cytotoxicity, which would be consistent with direct or indirect microtubule destabilization by rigosertib or with other modes of inhibition of mitosis. To distinguish between these possibilities, we devised a focused chemical-genetic profiling strategy to compare rigosertib’s pattern of drug-gene interactions (the set of drug-sensitivity phenotypes) to those of drugs that directly target the microtubule network or various other steps of mitosis, with the expectation that drugs with the same target would have similar patterns of drug-gene interactions (Figure 3A) (Jiang et al., 2011).
Figure 3.

Focused Chemical-Genetic Profiling Reveals a Similar Genetic Signature of Cellular Response to Rigosertib and Microtubule-Destabilizing Agents
(A) Schematic of focused chemical-genetic profiling strategy.
(B) Pairwise correlations (squared Pearson correlation, r2) between focused CRISPRi sublibrary phenotype sets (514 genes) derived from treatments with the indicated drugs (sensitivity phenotypes, ρ) or untreated growth (γ). Phenotype sets were clustered using the euclidean distance metric, as indicated by the dendogram. Biological replicates of the same condition clustered adjacent to each other for all conditions.
(C) CRISPRa rigosertib and ABT-751 sensitivity phenotypes for all genes in the CRISPRa focused chemical-genetic screens (257 genes).
(D) KIF2C CRISPRi and CRISPRa sensitivity phenotypes (ρ) against the indicated drugs. Data represent mean ± SD for replicate infections and treatments (n = 3).
See also Figure S3.
We selected 514 genes with strong rigosertib-sensitivity phenotypes in our genome-wide CRISPRi screen and generated a sublibrary of 5,390 sgRNAs targeting these genes (STAR Methods). Using a pooled screening strategy, we evaluated how knockdown of each of these genes affects sensitivity to rigosertib as well as to a panel of mitosis-targeting drugs: ABT-751 and vinblastine (two microtubule-destabilizing agents that bind to different sites on tubulin), BI2536 (a PLK1 inhibitor), blebbistatin (a myosin II inhibitor that inhibits cytokinesis), S-trityl-l-cysteine (STLC; an inhibitor of the mitotic kinesin Eg5), and alisertib (an aurora A kinase inhibitor). Sensitivity phenotypes (ρ) derived from replicate drug treatments were highly correlated (r2 ≥ 0.84 for all drugs tested; Figures 3B and S3A; Data S1), and the rigosertib-sensitivity phenotypes were well correlated with those from the genome-wide screen (Figure S3B). Comparing the phenotypes across the different drug treatments revealed a high overall correlation of phenotypes between rigosertib and ABT-751 (r2 ≥ 0.86 for each pairwise comparison of replicate phenotype sets) as well as, to a slightly lower extent, between rigosertib and vinblastine (r2 ≥ 0.79) (Figures 3B and S3C). In contrast, rigosertib’s sensitivity phenotypes were less correlated with those of the other drugs. Indeed, in hierarchical clustering, rigosertib, ABT-751, and vinblastine formed a cluster separate from the other drugs (Figure 3B). The similarity between the sensitivity phenotypes of rigosertib and ABT-751 also extended to analogous CRISPRa sublibrary screens (257 genes; Figure 3C; Data S1). Thus, rigosertib’s pattern of drug-gene interactions closely resembles those of microtubule-destabilizing agents, particularly that of ABT-751, which binds to the colchicine site on tubulin (Dorléans et al., 2009).
In analyzing these data, we observed that knockdown of several genes required for cell growth in the absence of drugs appeared to confer resistance to all tested drugs (Figures S3C and S3D), a pattern that was also observed in the genome-wide screen and may reflect indirect effects (Figure S1B). To test if the sensitivity phenotypes of these essential genes affected the comparison of the genetic profiles of the different drugs, we segregated the genes in our dataset into clusters (Figure S3E), removed the cluster of genes with strong negative effects on untreated growth and uniformly protective effects against all drugs, and repeated the comparison between the different drugs (Figure S3F). With these genes excluded, the sensitivity phenotypes for all drugs were correlated slightly less well, but rigosertib clustered even more closely with the microtubule-destabilizing agents ABT-751 and vinblastine compared to the drugs targeting other essential mitotic proteins.
As KIF2C expression levels were a strong determinant of sensitivity to microtubule-destabilizing agents in our screens, we next tested whether KIF2C expression levels could be used more generally to classify microtubule-targeting drugs. We individually re-tested the effects of KIF2C knockdown or overexpression on sensitivity to a range of drugs. ABT-751, vinblastine, and colchicine, another microtubule-destabilizing agent, showed the same phenotype pattern as rigosertib, with KIF2C knockdown and overexpression conferring strong resistance and sensitization, respectively (Figure 3D). Notably, Taxol/paclitaxel, a taxane-class microtubule stabilizer, showed the opposite behavior. Other mitosis-targeting drugs did not elicit these strongly anticorrelated phenotypes (Figure 3D), indicating that the CRISPRi/a phenotypes of KIF2C could be signatures of microtubule-destabilizing agents.
Rigosertib Treatment Causes Spindle and Mitotic Defects, and Spindle Defects Are Modulated by KIF2C Levels
Our genetic experiments suggested a clear hypothesis: rigosertib causes cellular toxicity through microtubule destabilization. Since microtubule destabilization causes cellular toxicity by perturbing mitotic spindle assembly and inhibiting cell division, we examined whether rigosertib triggers such spindle assembly defects in cells and whether such spindle defects are modulated by KIF2C levels. For these experiments, we used human retinal pigment epithelial (RPE1) cells, which are flat, adherent cells ideally suited for fluorescence microscopy. RPE1 CRISPRa cells expressing either a control sgRNA or a KIF2C-targeting sgRNA contained robust bipolar spindles in which chromosomes normally aligned at the metaphase plate (Figures 4A, S4A, and S4B). When control cells were treated with 400 nM rigosertib, a moderately high dose, the overall tubulin polymer mass in the cell was unaffected, although subtle defects were observed in spindle architecture and chromosome alignment to the metaphase plate (Figures 4A, S4A, and S4B), suggestive of a mild defect in microtubule dynamics at this dose. However, when cells in which KIF2C levels were increased by CRISPRa were treated with the same dose of rigosertib, tubulin polymer mass was severely reduced and spindle architecture and chromosome alignment were disrupted (Figures 4A, S4A, and S4B), suggesting that KIF2C overexpression indeed enhances microtubule destabilization by rigosertib.
Figure 4.

Rigosertib Inhibits Cell Division and Microtubule Growth in Cells
(A–D) Imaging of RPE1 CRISPRa (A and B) or CRISPRi (C and D) cells expressing either a control sgRNA or a KIF2C-targeting sgRNA after treatment with indicated concentrations of rigosertib.
(A) Representative images of fixed cells immunostained for tubulin (red). DNA was visualized with DAPI (blue).
(B) Mitosis durations of cells determined by fluorescence time-lapse microscopy. At least 60 cells were scored for each condition over 3 independent experiments. ∗p < 0.05; one-tailed paired t test.
(C and D) Spinning disk confocal microscopy of cells expressing EB3-GFP.
(C) Representative maximum intensity projections of 50 time points (50 s). See also Movie S1.
(D) Quantification of microtubule growth speeds (left). Number of cells and microtubules scored over 3 independent experiments for each experimental condition: no rigosertib: control sgRNA (12, 177), KIF2C sgRNA (9, 152); 75 nM rigosertib: control sgRNA (7, 113), KIF2C sgRNA (8, 128). Quantification of microtubule-cortex contacts (right). Number of cells scored over 3 independent experiments: no rigosertib: control sgRNA (21), KIF2C sgRNA (18); 75 nM rigosertib: control sgRNA (29), KIF2C sgRNA (18).
All data represent mean ± SEM. Scale bars, 5 μm. See STAR Methods for details. See also Figure S4.
To determine the effect of rigosertib treatment on cell division and the dependence on KIF2C levels, we monitored dividing cells by time-lapse microscopy. Whereas cell division occurred normally in control cells and KIF2C-overexpressing cells, with fewer than 5% of cells showing an arrest in mitosis of more than 2 hr, rigosertib induced a dose-dependent mitotic arrest in both control and KIF2C-overexpressing cells (Figure 4B). However, mitotic arrest occurred at substantially lower doses of rigosertib in KIF2C-overexpressing cells (Figure 4B). Inversely, lowering KIF2C levels by CRISPRi reduced the mitotic arrest caused by rigosertib treatment (Figure S4C), consistent with the reduced rigosertib sensitivity of cells with KIF2C knockdown observed in the genetic experiments.
We next examined microtubule dynamics in rigosertib-treated cells. To measure microtubule dynamics, cells expressing the microtubule plus-end tracking protein EB3 fused to GFP were followed by time-lapse microscopy (Stepanova et al., 2003). We focused on astral microtubule dynamics, as the high density of microtubules in the spindle precludes tracking of individual microtubules. As astral microtubules were very sensitive to rigosertib treatment, a lower dose (75 nM) of rigosertib was used for these experiments. We found that microtubule growth speeds were largely unaffected by rigosertib treatment, but microtubule growth persistence was strongly reduced, as determined by a reduction in microtubule-cortex contacts (Figures 4C and 4D; Movie S1). KIF2C knockdown by CRISPRi restored microtubule growth persistence in the presence of rigosertib, while it had no detectable effect on microtubule growth speeds (Figures 4C and 4D). Together, these results show that KIF2C synergizes with rigosertib to decrease microtubule growth persistence, which exaggerates spindle defects caused by rigosertib and results in increased mitotic arrest and decreased cellular proliferation.
Rigosertib Directly Affects Microtubule Dynamics In Vitro
The experiments described above confirmed that rigosertib causes microtubule destabilization in cells. We next sought to establish if rigosertib acts on microtubules directly. Previous studies regarding rigosertib’s direct effect on microtubule polymerization had yielded conflicting results; whereas some studies reported that rigosertib does not detectably inhibit microtubule growth in vitro even at high concentrations (5 μM) (Gumireddy et al., 2005, Oussenko et al., 2011), another study reported that 60 nM rigosertib completely blocks microtubule polymerization in vitro (Lu et al., 2015). The origin of this discrepancy is unclear, but all previous studies used bulk tubulin polymerization, which is a relatively insensitive assay.
To assay the effects of rigosertib on microtubule dynamics more accurately, we reconstituted dynamic microtubules in vitro and used fluorescence time-lapse microscopy to track individual microtubules. Consistent with previous reports (Gumireddy et al., 2005, Oussenko et al., 2011), we found no significant effect of 5 μM rigosertib on microtubule catastrophe frequency (i.e., a switch from growth to shrinkage) (p = 0.06, Mann-Whitney U test), although we observed a small but significant reduction in microtubule growth rates (Figures 5A–5C). At higher rigosertib concentrations (10 or 20 μM), however, both microtubule growth rate and microtubule catastrophe frequency were significantly affected (p < 0.001) (Figures 5A–5C). Next, we repeated the microtubule dynamics measurements in the presence of EB3, which ubiquitously binds to microtubule plus ends in cells and makes microtubules more dynamic (Akhmanova and Steinmetz, 2015). EB3 is also known to sensitize microtubules to a wide range of microtubule-destabilizing agents (Mohan et al., 2013). Indeed, rigosertib’s potency was increased >20-fold in the presence of EB3. Even at 1 μM rigosertib, microtubule catastrophe frequency was increased by 2.2-fold (compared with a 2.0-fold increase in catastrophes with 20 μM rigosertib in the absence of EB3), and growth rates were reduced by 1.3-fold (Figures 5D–5F). Although the rigosertib concentrations required in these in vitro experiments are still higher than those required to kill cells, this phenomenon is typical for microtubule-destabilizing agents (Mohan et al., 2013), as their activities can be enhanced by additional microtubule-binding proteins in cells, and they may get concentrated inside cells. Altogether, these results show that rigosertib is a direct and potent inhibitor of microtubule polymerization.
Figure 5.

Rigosertib Inhibits Microtubule Growth In Vitro
(A) Kymographs illustrating in vitro dynamics of microtubules grown in the presence of 15 μM tubulin in the absence (control) or presence of 5, 10, or 20 μM rigosertib. Rhodamine-labeled-tubulin (0.5 μM) was added in the reaction to visualize the microtubules.
(B and C) Quantification of microtubule growth rate (B) and catastrophe frequency (C) with 15 μM tubulin alone or with 5, 10, or 20 μM rigosertib as illustrated in (A). n = 102 for control; n = 102, 137, and 110 for 5, 10, and 20 μM rigosertib, respectively.
(D) Kymographs of fluorescently labeled EB3 illustrating in vitro dynamics of microtubules grown in the presence of 15 μM tubulin along with EB3 (20 nM) and in the absence (control) or presence of 1, 5, or 10 μM rigosertib.
(E and F) Quantification of microtubule growth rate (E) and catastrophe frequency (F) with 15 μM tubulin along with EB3 (20 nM) without or with 1, 5, or 10 μM rigosertib as illustrated in (D). n = 75 for control; n = 102, 110, and 82 for 1, 5, and 10 μM rigosertib, respectively.
Data are presented as mean ± SEM.
Rigosertib Binds to the Colchicine Site of Tubulin
To demonstrate that rigosertib directly interacts with tubulin and to visualize this interaction, we determined the crystal structure of the tubulin-rigosertib complex to 2.4 Å resolution by X-ray crystallography (Figures 6A and 6B; Table 1). The complex was obtained by soaking rigosertib into preformed crystals of a protein complex composed of two αβ-tubulin heterodimers (T2), the stathmin-like protein RB3 (R) and tubulin tyrosine ligase (TTL; the complex is denoted T2R-TTL) (Prota et al., 2013). The resulting structure revealed rigosertib bound at the intradimer interface between the α- and β-tubulin subunits in the colchicine site, which is formed by residues of helices βH7 and βH8, strands βS8 and βS9, and loop βT7 of β-tubulin, as well as loop αT5 of α-tubulin (Figures 6A, 6B, and S5A) (Ravelli et al., 2004). Rigosertib is deeply buried in this site, stabilized by hydrophobic interactions primarily with the β-tubulin subunit as well as by hydrogen bonds between the amine group of the ligand and the carbonyl groups of the side chain and main chain of βAsn258 and αThr179, respectively (Figure 6B). Moreover, the carboxy group of rigosertib forms hydrogen bonds to the side chains of αSer178, βLys352, and βAsn349. Comparing the tubulin-rigosertib structure with previously reported structures of tubulin bound to colchicine and ABT-751 (Ravelli et al., 2004, Dorléans et al., 2009), two other colchicine-site binders, revealed that these structures are nearly identical overall (rigosertib/colchicine structures, root-mean-square deviation [RMSD] 0.3 Å over 2,672 atoms; rigosertib/ABT-751 structures, RMSD 0.6 Å over 2,496 atoms) and that all three ligands are positioned similarly in the binding site (Figures 6C and S5B). Thus, rigosertib’s binding mode at the αβ-tubulin interface resembles those of colchicine and ABT-751.
Figure 6.

Rigosertib Binds to Tubulin in the Colchicine Site
(A) Overall view of the αβ-tubulin-rigosertib complex. The α- and β-tubulin subunits are shown in dark and light gray ribbon representation, respectively. Bound rigosertib (light magenta) and GTP (orange) are shown in sphere representation.
(B) Close-up view of the interactions between rigosertib (magenta sticks) and tubulin. Interacting residues are shown as gray sticks. Hydrogen bonds are represented with black dashed lines. For clarity, not all interacting residues are displayed. Secondary structure elements are labeled in blue.
(C) Superimposition of the tubulin-rigosertib (magenta) and tubulin-colchicine (PDB: 4O2B; green) complex structures, shown as in (B).
See also Figure S5.
Table 1.
Crystallographic Data Collection and Refinement Statistics
| T2R-TTL-Rigosertib | |
|---|---|
| Data Collection | |
| Space group | P212121 |
| a, b, c (Å) | 104.7, 156.8, 182.6 |
| Resolution (Å)a,b | 48.1–2.40 (2.49–2.40) |
| Rmeas (%)a | 14.9 (229.9) |
| CC1/2a,c | 99.8 (28.2) |
| < I / σ(I) >a | 12.8 (0.88) |
| Completeness (%)a | 99 (98) |
| Multiplicitya | 6.9 (6.5) |
| Refinement | |
| Resolution (Å) | 48.1–2.40 |
| No. of unique reflections | 116,426 |
| Rwork/Rfree (%) | 21.5/26.2 |
| Average B-Factors (Å2) | |
| Complex | 70.2 |
| Solvent | 54.3 |
| Ligand | 63.0 |
| Wilson B-factor | 54.3 |
| RMSD from Ideality | |
| Bond lengths (Å) | 0.015 |
| Bond angles (°) | 1.77 |
| Ramachandran Statisticsd | |
| Favored regions (%) | 95 |
| Allowed (%) | 4.5 |
| Outliers (%) | 0.5 |
RMSD, root-mean-square deviation.
Values in parentheses indicate highest-resolution bin
The resolution cutoff was selected based on I/σI and CC1/2 according to Karplus and Diederichs (2012)
CC1/2 = percentage of correlation between intensities from random half-datasets
Ramachandran statistics as defined by MolProbity
Next, we sought to determine how rigosertib binding to tubulin could affect microtubule growth. Free tubulin has a characteristic “curved” conformation but adopts a “straight” conformation when incorporated into the microtubule lattice (reviewed in Brouhard and Rice, 2014). Comparison of the rigosertib-bound and rigosertib-free tubulin structures revealed that rigosertib binding induces a minor conformational change around the βT7 loop of β-tubulin (Figure S5C). Notably, this βT7 loop is known to undergo a conformational change during the “curved-to-straight” structural transition. Rigosertib binding sterically prevents the βT7 loop from adopting its conformation characteristic of the straight tubulin state (Figure S5D), similar to other colchicine-site ligands (Ravelli et al., 2004). Thus, rigosertib likely destabilizes microtubules by preventing the curved-to-straight structural transition in tubulin, a conformational change that is necessary for microtubule polymerization.
A L240F Tubulin Mutant Protects Cells from Rigosertib-Induced Cytotoxicity
Finally, to validate that tubulin binding underlies rigosertib’s cytotoxicity, we sought to identify a β-tubulin (TUBB) mutant that confers resistance to rigosertib. Inspection of the tubulin-rigosertib crystal structure revealed several amino acids in the rigosertib-binding pocket as candidates for mutation, such as a L242 (L240 in human TUBB) to phenylalanine mutation (Figures 7A and S6A). To test whether expression of such TUBB mutants would be tolerated and confer resistance to rigosertib, we developed lentiviral constructs for stable expression of TUBB variants together with an mCherry marker from a doxycycline-inducible promoter (Figure 7B), which allowed us to both control the timing of TUBB expression and monitor the growth of TUBB-expressing cells in competition with untransduced cells. Nineteen of the 20 tested TUBB mutants were toxic when overexpressed, as indicated by depletion of TUBB-expressing cells (Figures S6B and S6C). A single TUBB mutant, L240F, was non-toxic and functional, as indicated by its ability to compensate for CRISPRi-mediated knockdown of endogenous TUBB, which is otherwise severely toxic to cells (Figures S6B–S6D).
Figure 7.

A L240F Tubulin Mutant Confers Resistance to Rigosertib
(A) Location of L242 (L240 in human numbering) and modeling of the L240F mutation (gray surface) in the tubulin-rigosertib structure (tubulin: gray ribbons; rigosertib: magenta surface), highlighting the potential steric clash.
(B) Schematic of constructs used in TUBB mutant assays.
(C) Enrichment of K562 cells expressing L240F TUBB or WT TUBB after treatment with rigosertib or vinblastine in internally controlled growth assays. Enrichment was measured as the enrichment of mCherry-positive cells [e = fraction(mCh+) / (1 − fraction(mCh+)] by flow cytometry, calculated relative to the first time point. The ratio for each time point was normalized to the same ratio for DMSO-treated control cells.
(D) Enrichment of K562 cells expressing the indicated sgRNA (targeting the endogenous TUBB locus or non-targeting control) within the population of cells expressing the indicated TUBB construct after treatment with rigosertib in internally controlled growth assays. Enrichment of sgRNA-expressing cells within the population of TUBB-expressing cells was measured as the enrichment of GFP-positive cells within the population of mCherry-positive cells by flow cytometry, calculated relative to the first time point. The ratio for each time point was normalized to the same ratio for DMSO-treated control cells.
Data represent mean ± SD of replicate treatments (n = 3). See STAR Methods for details. See also Figure S6.
We next tested whether expression of L240F TUBB affects the rigosertib sensitivity of cells using an internally controlled growth assay akin to our sgRNA phenotype re-test assay (see Figure 2). Strikingly, K562 cells expressing L240F TUBB were resistant to rigosertib, as indicated by strong enrichment of mCherry-positive cells over untransduced cells upon rigosertib treatment (Figure 7C, green lines), whereas cells expressing wild-type (WT) TUBB from an analogous background were as sensitive to rigosertib as untransduced cells (Figure 7C, blue lines). Expression of L240F TUBB also conferred resistance to ABT-751 (Figure S6E), which binds to the same pocket on tubulin as rigosertib (Dorléans et al., 2009), but not to vinblastine, which also promotes microtubule destabilization but binds to a different site on tubulin than rigosertib (Gigant et al., 2005); instead, cells expressing L240F TUBB appeared to be mildly sensitized to vinblastine, possibly because the L240F mutation causes a minor defect in microtubule function (Figure 7C). Thus, the L240F TUBB mutant confers resistance to rigosertib, and this resistance is due to a compromised rigosertib-binding site rather than neomorphic effects.
The resistance mediated by expression of L240F TUBB is complete at lower rigosertib concentrations (60–80 nM), as indicated by identical growth rates of rigosertib-treated cells and DMSO-treated control cells, but partial at higher rigosertib concentrations (>100 nM) (Figure S6F). This partial resistance is likely a consequence of the presence of endogenous TUBB and other partially redundant β-tubulin isoforms, all of which rigosertib is likely able to bind. In addition, it is possible that the L240F TUBB mutant has a residual ability to bind rigosertib. The resistance to ABT-751 is similarly complete at lower doses but partial at higher doses, following the pattern observed for rigosertib at similar selective pressures (Figure S6F). To test whether partial resistance to rigosertib at higher concentrations was due, in part, to rigosertib binding to endogenous TUBB, we next asked whether depletion of endogenous TUBB in the background of L240F TUBB expression provided an additional growth advantage for cells (Figure 7B). Indeed, cells expressing both L240F TUBB and an sgRNA targeting endogenous TUBB were more resistant to rigosertib than cells expressing only L240F TUBB (Figure 7D) As expected, the rigosertib sensitivity of cells expressing WT TUBB from an analogous context was not affected by expression of a TUBB-targeting sgRNA. Finally, HeLa and H358 cells expressing L240F TUBB also enriched over untransduced cells upon rigosertib treatment (Figure S6G), demonstrating that the L240F TUBB mutant confers resistance to rigosertib in these cell lines as well. Altogether, these results establish that rigosertib’s cytotoxity across a broad range of cell types depends on binding to tubulin and subsequent depolymerization of microtubules.
Discussion
Here, we present a combined CRISPRi/a chemical-genetic approach for pinpointing the mechanism of action of therapeutic agents. This approach enables comprehensive profiling of drug-gene interactions in disease-relevant mammalian systems, using principles derived from a rich history of chemical-genetic efforts in yeast and related efforts in mammalian cells such as CRISPR cutting-mediated loss-of-function screening (Wang et al., 2014). The resulting genome-wide sensitivity profiles reveal molecular targets and genetic dependencies of therapeutic agents with high precision. We demonstrate the potential of this screening approach by establishing that rigosertib acts as a microtubule-destabilizing agent, resolving the long-standing discussion regarding its mechanism of action.
The history of rigosertib’s development illustrates the challenges of identifying molecular targets of therapeutic agents, particularly ones that target central cellular processes, because inhibition of these processes results in diverse indirect and pleiotropic effects. Indeed, targeted cellular assays for rigosertib’s activity had provided support for a range of disparate proposed targets, but these results appear to have been confounded by indirect effects (Ritt et al., 2016). A clear strength of our hypothesis-free CRISPRi/a screening approach is that it can systematically evaluate many pathways and processes in parallel. From this approach, microtubules singularly emerged as the candidate for rigosertib’s molecular target. In particular, microtubule-associated genes were highly enriched among genes for which knockdown and overexpression showed anticorrelated sensitivity phenotypes. A single screen would not have provided this clear signal, as illustrated by the lack of enrichment of microtubule-related hits in the individual screens (Figures S1C and S1D), highlighting the power of combined knockdown and overexpression screening in overcoming redundancy and pleiotropy. Indeed, the microtubule signature emerged despite functional redundancy among tubulin isoforms, which is usually problematic for genetic approaches and likely contributes to the relatively mild phenotypes of knockdown and overexpression of TUBB itself. Our focused chemical-genetic profiling strategy similarly pointed to microtubules and provided a mechanistic hypothesis by genetically classifying rigosertib with other microtubule-destabilizing agents. We confirmed this hypothesis both in cells and in vitro. Most compellingly, a β-tubulin mutant (L240F) rationally designed based on our tubulin-rigosertib crystal structure, confers resistance to rigosertib, but not to vinblastine, a microtubule destabilizer known to bind at a remote site on tubulin compared to rigosertib. Interestingly, an analogous tubulin mutation has been found to confer resistance to microtubule-destabilizing fungicides of the methyl benzimidazole carbamate class in fungal plant pathogens (Carter et al., 2013). Although polypharmacology formally is a possibility given previous reports of rigosertib’s putative targets, the observations that cells from diverse backgrounds can tolerate higher doses of rigosertib when expressing the L240F tubulin mutant or when KIF2C is repressed strongly suggest that microtubules are the dominant target of rigosertib in cells.
Rigosertib’s tubulin-binding mode mirrors that of other colchicine-site microtubule-destabilizing agents such as ABT-751 (Dorléans et al., 2009). Strikingly, ABT-751 and rigosertib also have more highly correlated phenotypes in our focused chemical-genetic screens than vinblastine and rigosertib, suggesting that the focused, comparative chemical-genetic approach can distinguish agents that have similar mechanisms of action and targets but different target-binding modes. This resolution coupled with the throughput enabled by the small library size (∼500–5,000 sgRNAs) suggests that the focused approach will be generally useful to compare and classify the mechanism of action of small molecules and classify hits from genome-wide screens.
Our tubulin-rigosertib complex structure suggests that rigosertib binding inhibits the curved-to-straight transition required for microtubule formation. In vitro, in the absence of microtubule-binding proteins, this activity manifests itself as a reduction in microtubule growth rate, similar to other ligands that bind to the colchicine-site (Mohan et al., 2013). The addition of a single microtubule-binding protein, EB3, which is ubiquitously present on growing microtubule tips in vivo, to the in vitro reaction greatly sensitizes microtubules to rigosertib by increasing the catastrophe rate, consistent with the effect of rigosertib on microtubule growth persistence in cells. These results also help to explain why several previous in vitro studies failed to detect the microtubule-destabilizing activity of rigosertib, as these studies were performed in the absence of EB3 (Gumireddy et al., 2005, Oussenko et al., 2011). Overall, rigosertib’s mechanism of action appears to be similar to those of other colchicine-site drugs, destabilizing microtubules by increasing the catastrophe rate in a fashion that is dependent on the presence of microtubule-binding proteins.
Microtubules are well-validated drug targets (Dumontet and Jordan, 2010). For example, vincristine and vinblastine have been a mainstay of multiple anticancer regimens for decades, but their efficacy is limited in part by resistance mechanisms such as expression of β-tubulin isoforms with altered binding properties (Kavallaris, 2010), which has motivated the development of new agents such as the recently approved eribulin (Halaven). Similarly, microtubule-destabilizing agents that target the colchicine-site could bypass these resistance mechanisms, but no colchicine-site drugs have yet been approved as anticancer therapies in part due to poor solubility or pharmacokinetics or strong toxicity (Lu et al., 2012). Extensive data such as favorable pharmacokinetics and toxicity of rigosertib from clinical trials (Silverman et al., 2015) make rigosertib an attractive candidate for clinical development for cancers that have acquired resistance to vinblastine or vincristine as well as for other treatment applications. The identification of rigosertib’s molecular target now facilitates rational, structure-, and target-guided engineering and selection of targeted patient groups and treatment applications. In this context, the strong genetic interaction with KIF2C and TACC3 can serve as a marker both to validate on-target activity in a medicinal chemistry campaign and to identify patient cohorts that might most benefit from treatment.
Despite significant advances, target identification stands as a major bottleneck in drug development. A number of elegant strategies for target identification have been developed, but each come with caveats. For example, approaches based on proteome-wide profiling of drug-induced protein stabilization (Savitski et al., 2014) or drug derivatization and affinity pull-down (Rix and Superti-Furga, 2009) report on binding but do not inherently reveal function and may fail for compounds that bind with low affinity or target membrane proteins. Screening for resistant mutants can be remarkably successful in specific cases (Heitman et al., 1991) but is challenging to implement and relies on dominant effects in diploid organisms. Our CRISPRi/a approach is robust, reproducible, and simple to implement and helps pinpoint direct functional targets of agents with a wide variety of mechanisms of action and thus provides a powerful tool that can complement and in many cases replace previously developed approaches. Altogether, this study serves as a blueprint for the use of CRISPR-based chemical-genetic screens to elucidate the mechanisms of action of drug candidates and will be applicable to compounds derived from large-scale cell-based chemical screens and newly discovered natural products.
STAR★Methods
Key Resources Table
| REAGENT or RESOURCE | SOURCE | IDENTIFIER |
|---|---|---|
| Antibodies | ||
| Mouse monoclonal anti-α-Tubulin (clone DM1A) | Sigma-Aldrich | Cat#T9026; RRID: AB_477593 |
| Chemicals, Peptides, and Recombinant Proteins | ||
| Rigosertib | Selleck Chemicals | Cat#S1362 |
| Deposited Data | ||
| Cell imaging data | This paper, Mendeley Data | https://doi.org/10.17632/dfdxy4ksh3.1 |
| In vitro microtubule polymerization assay imaging data, no EB3 (Figure 5A) | This paper, Mendeley Data | https://doi.org/10.17632/tm22dtht9x.1 |
| In vitro microtubule polymerization assay imaging data, with EB3 (Figure 5D) | This paper, Mendeley Data | https://doi.org/10.17632/t6g8bfpgvk.1 |
| Tubulin:rigosertib crystal structure | This paper | PDB: 5OV7 |
| Rigosertib sensitivity and untreated growth phenotypes from genome-wide and focused sublibrary screens | This paper | Data S1 |
| Experimental Models: Cell Lines | ||
| K562 CRISPRi | Gilbert et al., 2014 | N/A |
| K562 CRISPRa | Gilbert et al., 2014 | N/A |
| cMJ009 (K562 constitutive CRISPRi with rtTA) | This paper | N/A |
| RPE1 CRISPRi | This paper | N/A |
| RPE1 CRISPRa | This paper | N/A |
| Oligonucleotides | ||
| See Table S1 for protospacer sequences | This paper | N/A |
| Recombinant DNA | ||
| CRISPRi-v1 library | Gilbert et al., 2014 | Addgene Cat#62217 |
| CRISPRa-v1 library | Gilbert et al., 2014 | Addgene Cat#60956 |
| hCRISPRi-v2 rigosertib sublibrary | This paper | N/A |
| hCRISPRa-v2 rigosertib sublibrary | This paper | N/A |
| pU6-sgRNA EF1alpha-puro-T2A-BFP | Gilbert et al., 2014 | Addgene Cat#60955 |
| pU6-sgRNA EF1alpha-puro-T2A-GFP | Gilbert et al., 2014 | N/A |
| pCRISPRia-v2 | Horlbeck et al., 2016 | Addgene Cat#84832 |
| Software and Algorithms | ||
| ScreenProcessing pipeline | Horlbeck et al., 2016 | https://github.com/mhorlbeck/ScreenProcessing |
| Micro-Manager microscope control software | Edelstein et al., 2014 | https://micro-manager.org/ |
Contact for Reagent and Resource Sharing
Further information and requests for resources and reagents should be directed to and will be fulfilled by the Lead Contact, Jonathan S. Weissman (jonathan.weissman@ucsf.edu).
Experimental Model and Subject Details
K562 cells were grown in RPMI 1640 (GIBCO) with 25 mM HEPES, 2 mM l-glutamine, 2 g/L NaHCO3 and supplemented with 10% (v/v) fetal bovine serum (FBS), 100 units/mL penicillin, 100 μg/mL streptomycin, 2 mM l-glutamine. HEK293T cells were grown in Dulbecco’s modified eagle medium (DMEM, GIBCO) with 25 mM d-glucose, 3.7 g/L NaHCO3, 4 mM l-glutamine and supplemented with 10% (v/v) FBS, 100 units/mL penicillin, 100 μg/mL streptomycin. HeLa and H358 cells were grown in the same media as HEK293T cells with the additional supplementation of 2 mM l-glutamine. RPE1 cells were grown in DMEM:F12 (1:1) medium (GIBCO) supplemented with 10% (v/v) FBS, 100 units/mL penicillin, and 100 μg/mL streptomycin. K562, HeLa, and RPE-1 cells are derived from female patients/donors. H358 cells are derived from a male patient. HEK293T are derived from a female fetus. All cell lines were grown at 37°C. All cell lines were periodically tested for Mycoplasma contamination using the MycoAlert Plus Mycoplasma detection kit (Lonza).
Method Details
Reagents
Rigosertib, vinblastine, blebbistatin, BI2536, alisertib, and paclitaxel were purchased from Selleck chemicals. ABT-751 was purchased from ApexBio. STLC and colchicine were purchased from Tocris. ARS-853 was generously provided by the Shokat lab (UCSF).
DNA transfections and virus production
Lentivirus was generated by transfecting HEK39T cells with standard packaging vectors using TransIT-LT1 Transfection Reagent (Mirus Bio). Viral supernatant was harvested 2-3 days after transfection and filtered through 0.44 μm PVDF filters and/or frozen prior to transduction.
Generation of cell lines
To generate the H358 cell line stably expressing dCas9-KRAB, WT H358 cells (ATCC) were stably transduced with a lentiviral vector expressing dCas9-BFP-KRAB from an EF1-α promoter with an upstream ubiquitous chromatin opening element (UCOE; UCOE-EF1α-dCas9-BFP-KRAB) and selected for BFP-positive cells using two rounds of fluorescence activated cell sorting (FACS) on a BD FACSAria2. To generate the K562 cell line cMJ009 stably expressing the Tet-On tetracycline transactivator (rtTA) and dCas9-KRAB, an existing clonal K562 cell line stably expressing rtTA (BA002, REF CRISPR screening) was transduced with pMH0001 (UCOE-SFFV-dCas9-BFP-KRAB, Addgene #85969) and selected for BFP-positive cells using FACS on a BD FACSAria2.
Retinal pigment epithelium cells (RPE1) CRISPRi and CRISPRa cell lines were generated as follows: For CRISPRi, RPE1 cells were stably transduced with a lentiviral vector expressing dCas9-BFP-KRAB from an SFFV promoter and BFP-positive cells were isolated by FACS sorting. For CRISPRa, RPE1 cells were first stably transduced with a lentiviral vector expressing dCas9-SunTag10x_v4–P2A-BFP-NLS and BFP-positive cells were isolated by FACS sorting. Next, cells were stably transduced with a lentiviral vector expressing scFv-GCN4-GFP-VP64 and GFP-positive cells were isolated by FACS sorting. To select for CRISPRa cells that showed strong transcriptional activation, cells were transduced with a lentiviral vector expressing an sgRNA targeting the transmembrane protein CXCR4 (which is normally not expressed in RPE1 cells) (Tanenbaum et al., 2014), cells were stained with a fluorescently labeled CXCR4 antibody and RPE1 cells highly expressing CXCR4 were isolated by FACS sorting and grown as monoclonal cell lines. A single clone was selected for further experiments.
Genome-scale CRISPRi and CRISPRa screening
Genome-scale screens were conducted similar to previously described screens (Gilbert et al., 2014, Horlbeck et al., 2016). The CRISPRi or CRISPRa v1 sgRNA libraries (Gilbert et al., 2014) were transduced in duplicate into K562 CRISPRi or CRISPRa cells, respectively, at MOI < 1 (percentage of transduced cells 2 days after transduction: 20%–40%). Replicates were maintained separately in 1.5 L of RPMI-1640 in 3 L spinner flasks for the course of the screen. 2 days after transduction, the cells were selected with 0.75-0.85 μg/mL puromycin for 2 days, at which point transduced cells accounted for 80%–95% of the population. Cells were allowed to recover for 1-2 days in the absence of puromycin. At this point, t0 samples with a minimum 1000x library coverage (250-300 ∙ 106 cells) were harvested and the remaining cells were split into two populations for untreated growth and rigosertib-treated growth. The cells were maintained in spinner flasks by daily dilution to 0.5 ∙ 106 cells mL−1 at an average coverage of greater than 1000 cells per sgRNA for the duration of the screen. For rigosertib treatment, rigosertib was added to the cells at the concentrations indicated below and removed by centrifugation the following day. Additional pulses of rigosertib treatment were performed as needed until rigosertib-treated cells had undergone 5-7 fewer doublings than untreated cells. Cells were allowed to recover to > 80% cell viability, as measured on an Accuri bench-top flow cytometer (BD BioSciences), and harvested by centrifugation with a minimum 1000x library coverage. The K562 CRISPRa cells were treated with 300 nM rigosertib on day 0, 400 nM rigosertib on day 2, 600 nM rigosertib on day 6, and 900 nM rigosertib on day 10 and harvested on day 15 (6.5 and 6.2 doubling differences between treated and untreated populations for biological replicates). The K562 CRISPRi cells were treated with 900 nM rigosertib on day 0 and harvested on day 7 (5.2 and 5.6 doubling differences between treated and untreated populations for biological replicates). Genomic DNA was isolated from frozen cell pellets and the sgRNA-encoding region was enriched, amplified, and processed for sequencing on Illumina HiSeq 2500 as described previously (Gilbert et al., 2014).
Sequencing reads were aligned to the CRISPRi/a v1 library sequences, counted, and quantified using the Python-based ScreenProcessing pipeline (https://github.com/mhorlbeck/ScreenProcessing; Horlbeck et al., 2016). Generation of negative control genes and calculation of phenotypes and Mann-Whitney p-values was performed as described previously (Gilbert et al., 2014, Horlbeck et al., 2016). Sensitivity phenotypes (ρ) were calculated by calculating the log2 change in enrichment of an sgRNA in the treated and untreated samples, subtracting the equivalent median value for all non-targeting sgRNAs, and dividing by the number of population doubling differences between the treated and untreated populations (Gilbert et al., 2014, Kampmann et al., 2013). Similarly, untreated growth phenotypes (γ) were calculated from the untreated and t0 samples, dividing by the total number of doublings of the untreated population. For the CRISPRi screen, γ phenotypes derived from a previous screen for untreated cell growth were used (Gilbert et al., 2014). Phenotypes from sgRNAs targeting the same gene were collapsed into a single sensitivity phenotype for each gene using the average of the top three scoring sgRNAs (by absolute value) and assigned a p-value using the Mann-Whitney test of all sgRNAs targeting the same gene compared to the non-targeting controls. For genes with multiple independent transcription start sites (TSSs) targeted by the sgRNA libraries, phenotypes and p-values were calculated independently for each TSS and then collapsed to a single score by selecting the TSS with the lowest Mann-Whitney p-value. Read counts and phenotypes for individual sgRNAs are available in Data S1, Tables A (CRISPRi) and C (CRISPRa). Gene-level phenotypes are available in Data S1, Tables B (CRISPRi) and D (CRISPRa). Hits were defined as genes with |ρ| > 0.15. Gene ontology analysis was performed using selected databases (GOTERM_BP_FAT, GOTERM_CC_FAT, GOTERM_MF_FAT, KEGG_PATHWAY) using DAVID Bioinformatic Resources v6.7 (https://david-d.ncifcrf.gov/; Huang et al., 2009). All additional analyses were performed in Python 2.7 using a combination of Numpy (v1.12.1), Pandas (v0.17.1), and Scipy (v0.17.0).
CRISPRi and CRISPRa sublibrary generation
Genes for the sublibraries were selected using the rigosertib sensitivity phenotypes from the genome-wide screen. For the CRISPRi sublibrary, genes with average ρ > 0.15 or average ρ < −0.10 in the genome-wide CRISPRi screen were included in the sublibrary. For the CRISPRa sublibrary, genes with |average ρ| > 0.10 in the genome-wide CRISPRa screen were included in the sublibrary. For each gene, the top 10 sgRNAs (for each targeted transcription start site) from our recently developed hCRISPRi/a-v2 library (Horlbeck et al., 2016) were included in the sublibraries, as well as 110 non-targeting control sgRNAs. Oligonucleotide pools were designed with flanking PCR and restriction sites, synthesized by Agilent Technologies, and cloned into the sgRNA expression vector pCRISPRia-v2 (Addgene #84832), essentially as described previously (Horlbeck et al., 2016).
CRISPRi and CRISPRa sublibrary screening
The sublibrary screens were conducted in a similar manner as the genome-wide screen with modifications indicated below. Cells were maintained in replicates in standard T175 cell culture flasks throughout the screen. Each CRISPRi replicate was split into eight populations for untreated growth or treatment with different drugs on day 0. Cells were treated for one day as follows: Rigosertib: 300 nM on days 0, 4, and 8, harvested on day 13; ABT-751: 400 nM on days 0, 3, and 9, harvested on day 13; Vinblastine: 10 nM on day 0 and day 7, harvested on day 14; BI2536: 40 nM on day 0 and day 7, harvested on day 14; Alisertib: 450 nM on day 0 and day 7, harvested on day 14; Blebbistatin: 50 μM on day 0 and day 7, harvested on day 14; STLC: 15 μM on days 0, 5, and 9, harvested on day 14. Each CRISPRa replicate was split into three populations for untreated growth or treatment with rigosertib or ABT-751. Cells were treated as follows: Rigosertib: 300 nM on days 0, 3, and 8, harvested on day 13; ABT-751: 400 nM on days 0, 3, and 8, harvested on day 13. Genomic DNA was isolated from frozen cell pellets and the sgRNA-encoding region was enriched, amplified, and processed for sequencing on Illumina HiSeq 4000 as described previously (Horlbeck et al., 2016). Alignment of sequencing reads and phenotype calculation was performed as described above. Read counts and phenotypes for individual sgRNAs are available in Data S1, Tables E (CRISPRi) and G (CRISPRa). Gene-level phenotypes are available in Data S1, Tables F (CRISPRi) and H (CRISPRa).
Data analysis was performed in Python. For clustering of drug sensitivity phenotypes (Figure 3B), the drug-drug correlation matrix for each set of drug sensitivity phenotypes using all genes in the dataset was calculated and clustered using the euclidean distance matrix. For removal of essential genes with uniformly protective phenotypes against all tested drugs (Figures S3E and S3F), genes were segregated into 3 clusters in Cluster 3.0 (http://bonsai.hgc.jp/∼mdehoon/software/cluster/software.htm) using the k-means algorithm and the euclidean distance metric and the cluster containing essential genes was excluded from subsequent analyses.
Individual evaluation of sgRNA phenotypes
For individual evaluation and re-testing of sgRNA phenotypes, sgRNA protospacers targeting KIF2C or TACC3 or a non-targeting control protospacer (neg_ctrl-1) were individually cloned by annealing complementary synthetic oligonucleotide pairs (Integrated DNA Technologies) with flanking BstXI and BlpI restriction sites and ligating the resulting double-stranded segment into either BstXI/BlpI-digested pCRISPRia-v2 (marked with a puromycin resistance cassette and BFP, Addgene #84832; Horlbeck et al., 2016) or BstXI/BlpI-digested pU6-sgRNA EF1α-puro-t2a-GFP (marked with a puromycin resistance cassette and GFP; Gilbert et al., 2014). Protospacer sequences used for individual evaluation are listed in Table S1. The resulting sgRNA expression vectors were individually packaged into lentivirus. Internally controlled growth assays to evaluate sgRNA drug sensitivity phenotypes were performed by transducing cells with sgRNA expression constructs at MOI < 1 (15 – 30% infected cells), treating cells with the corresponding drugs at approximately LD60 or DMSO 4-7 days after infection, and measuring the fraction of sgRNA-expressing cells 3-5 days after treatment as BFP- or GFP-positive cells by flow cytometry on an LSR-II (BD Biosciences). A population of infected cells was selected to purity with puromycin (1.5 – 3 μg/mL), allowed to recover for 1 day, and harvested for measurement of mRNA levels by RT-qPCR (see below). Experiments were performed in triplicates either from the infection step or from the treatment step.
RT-qPCR
To generate cDNA, total RNA was isolated from frozen cell samples using TRIzol reagent (Thermo Fisher Scientific) and Phase Lock Gel tubes (VWR), treated with Turbo DNase (Thermo Fisher Scientific), and reverse-transcribed using SuperScript II or SuperScript III Reverse Transcriptase (Thermo Fisher Scientific) with oligo(dT) primers in the presence or absence of RNaseOUT Recombinant Ribonuclease Inhibitor (Thermo Fisher Scientific). Quantitative PCR (qPCR) reactions by adding 20 μL master mix containing 1.1X Colorless GoTaq Reaction Buffer (Promega), 0.7 mM MgCl2, dNTPs (0.2 mM each), primers (0.75 μM each), and 0.1X SYBR Green with GoTaq DNA polymerase (Promega) to 2 μL cDNA, mock-RT samples, or water in 22 μL reactions. Reactions were run on a LightCycler 480 Instrument (Roche). Experiments were performed in technical triplicates. RT-qPCR primers used were against ACTB (oBA74: GCTACGAGCTGCCTGACG, oBA75: GGCTGGAAGAGTGCCTCA), KIF2C (oMYC032: CAACTCCAAAATTCCTGCTCC, oMYC033: GAACTGAAAACTGCTTGCGG), TACC3 (oMYC038: ACAGACGCACAGGATTCTAAG, oMYC039: GTTTTGGCATCCACTTCCTTG).
Visualizing mitotic spindles
RPE1 CRISPRi or CRISPRa cells were infected with lentivirus encoding a sgRNA targeting the KIF2C promoter or a nontargeting control sgRNA (sequences provided in Table S1) and co-expressing BFP and a puromycin resistance gene. 4 days (CRISPRa) or 5 days (CRISPRi) after infection, cells were treated with indicated concentrations of rigosertib for 3 hr and fixed and stained with the DM1a monoclonal antibody for α-tubulin (Sigma, 1:10,000 dilution). DNA was visualized by DAPI staining.
Mitotic RPE1 imaging
RPE1 CRISPRi or CRISPRa cells were infected with lentivirus as described above. Subsequently, cells were selected using 10 μg/ml puromycin for 7 days. The cells were seeded in 96-wells glass bottom dishes (Matriplate, Brooks). Immediately prior to imaging the medium was replaced by Leibovitz’s L-15 (GIBCO) CO2-independent medium supplemented with the indicated concentrations of rigosertib. The cells were imaged using a Yokogawa CSU-X1 spinning disk confocal attached to an inverted Nikon TI microscope with Nikon Perfect Focus system, CFI Plan Apochromat 20X NA 0.75 objective, an Andor iXon Ultra 897 EM-CCD camera, and Micro-Manager software (Edelstein et al., 2014). Cells were imaged every 15 min for 10 hr. For RPE1 CRISPRa cells, nuclear envelope breakdown and reformation was determined by nuclear localization of the scFv-GFP-NLS and was defined as mitotic entry and exit, respectively. For RPE1 CRISPRi cells, which do not express scFv-GFP-NLS, the duration of mitosis was determined as the moment of mitotic cell rounding until the moment of cleavage furrow ingression, as determined by fluorescence of BFP expressed from the sgRNA expression construct.
EB3-GFP tracking
RPE1 stably expressing dCas9-BFP-KRAB and EB3-GFP were infected with lentivirus encoding individual sgRNAs (sequences provided in Table S1) targeting the KIF2C promoter or a nontargeting control, along with BFP and a puromycin resistance gene. Ccells were selected using 10 μg/ml puromycin for 7 days. The cells were seeded in 96-wells glass bottom dishes (Matriplate, Brooks). Immediately prior to imaging the medium was replaced by Leibovitz’s L-15 (GIBCO) CO2-independent medium supplemented with the indicated concentrations of rigosertib. The cells were imaged using a Yokogawa CSU-X1 spinning disk confocal attached to an inverted Nikon TI microscope with Nikon Perfect Focus system, 100 × NA 1.49 objective, an Andor iXon Ultra 897 EM-CCD camera, and Micro-Manager software (Edelstein et al., 2014). 50 images were acquired for each movie at 1 s time interval in a single z section through the middle of the cell. To measure microtubule growth speeds, maximum intensity projections of EB3-GFP fluorescence of all time-points were generated in ImageJ, and kymographs were created along growing microtubules. Microtubule growth speeds were calculated based on the slope of lines in the kymographs. To determine microtubule-cortex interactions, a single z-slice was imaged that contained the spindle pole and the number of microtubules plus-ends that contacted the cortex surrounding the spindle pole was scored.
In vitro microtubule polymerization assays
To monitor the direct effects of rigosertib on microtubule dynamics, in vitro assays (as described previously; Doodhi et al., 2016) were performed with the reaction mixtures in MRB80 buffer containing tubulin (15 μM), Rhodamine-tubulin (0.5 μM) when indicated, methyl cellulose (0.1%), KCl (50 mM), k-casein (0.5 mg/ml), GTP (1 mM), oxygen scavenging system (20 mM glucose, 200 μg/ml catalase, 400 μg/ml glucose-oxidase, 4 mM DTT), mCherry-EB3 (20 nM) and with different concentrations of rigosertib. Movies were acquired in total internal reflection fluorescence (TIRF) microscopy mode using a Nikon Eclipse Ti-E (Nikon) microscope supplemented with the perfect focus system (PFS) (Nikon), equipped with a Nikon CFI Apo TIRF 100x 1.49 N.A. oil objective (Nikon) and a photometrics CoolSNAP HQ2 CCD (Roper Scientific) camera with triple-band TIRF polychroic ZT405/488/561rpc (Chroma) and triple-band laser emission filter ZET405/488/561 m (Chroma), mounted in the metal cube (Chroma, 91032) together with emission filter wheel Lambda 10-3 (Sutter instruments) with ET460/50 m, ET525/50 m and ET630/75 m emission filters (Chroma). Vortran Stradus 488 nm (150 mW) and Cobolt Jive 561 nm (100 mW) lasers were used for excitation (the laser launch was part of ILas system (Roper Scientific France/ PICT-IBiSA, Institut Curie)). Images were acquired with MetaMorph 7.7 software (Molecular Devices) at 63 nm per 1 pixel. Kymographs were generated by ImageJ using the KymoResliceWide plugin. Two independent assays were performed for each condition to collect the reported data.
Crystallization, data collection, and structure solution
Crystals of T2R-TTL were grown as previously described (Prota et al., 2013) and soaked for 2 days at 20°C in the reservoir solution (10% PEG 4k, 16% glycerol) containing 2 mM rigosertib. Crystals were fished directly from the drop and flash-cooled in a nitrogen stream at the beamline after a transfer into cryo-solution containing 20% glycerol. Standard data collection at beamline X06SA at the Swiss Light Source (Paul Scherrer Institut, Villigen, Switzerland), data processing, and structure solution using the difference Fourier method were performed as described previously (Prota et al., 2013). Data collection and refinement statistics are summarized in Table 1.
Structural figures were prepared using the PyMOL Molecular Graphics System, version 1.7.6.1 (Schrödinger, LLC). Chains in the T2R-TTL complex were defined as follows: chain A, α-tubulin-1; chain B, β-tubulin-1; chain C, α-tubulin-2; chain D, β-tubulin-2; chain E, RB3; and chain F, TTL. Chains B and D were used throughout for the structural analyses and figure preparation.
Design and generation of TUBB-expression constructs
To generate the construct for doxycycline-inducible expression of WT TUBB, pHR-TRE3G-TUBB-IRES-mCherry, WT TUBB, an encephalomyocarditis virus (EMCV) internal ribosome entry site (IRES), and mCherry were separately PCR-amplified and joined by Gibson assembly. Briefly, WT TUBB was PCR amplified from K562 cDNA, generated by poly-A-directed reverse transcription of total RNA extracted using the RNeasy kit (QIAGEN), using primers flanking the start and stop codons. DNA encoding an EMCV IRES was PCR-amplified from pMIG-w (a gift from Luk Parijs, Addgene #12282) using primers flanking the 5′ multiple cloning site and the 3′ start codon. DNA encoding mCherry was PCR-amplified from pHR-TRE3G-dCas9-P2A-mCherry using primers flanking the start and stop codons. The three PCR products were joined together by Gibson assembly using the NEBuilder HiFi DNA assembly kit (New England BioLabs) and the product was used as a PCR template to amplify TUBB-IRES-mCherry, which was then inserted into SmaI/SbfI-digested pHR-TRE3G-dCas9-P2A-mCherry by two-piece Gibson assembly, yielding pHR-TRE3G-TUBB-IRES-mCherry. For cloning of mutant TUBB variants, the variants were obtained as two separate synthetic DNA segments (Integrated DNA technologies), an N-terminal segment without mutations and various C-terminal segments carrying the desired mutations, and inserted into SmaI/PflFI-digested pHR-TRE3G-TUBB-IRES-mCherry by three-piece Gibson assembly. The following mutant TUBB constructs were generated: C239F, C239Y, L240F, L240Y, A248F, A248Y, A314F, A314Y, C239F/L240F, C239F/A248F, C239F/A248Y, C239F/A314F, C239F/A314Y, C239F/K350A, L240F/A248F, L240F/A248Y, L240F/A314F, L240F/A314Y, L240F/K350A, A248F/A314F. All mutants are numbered according to their position in human TUBB and correspond to the following residues in the structure: C239 – C241; L240 – L242; A248 – A250; A314 – A316; K350 – K352. To generate constructs for stable expression of WT TUBB or L240F TUBB from a SFFV promoter, the corresponding TUBB-IRES-mCherry cassette was amplified by PCR and inserted into BamHI/NotI digested pHR-SFFV-Tet3G by two-piece Gibson assembly, yielding pHR-SFFV-TUBB-IRES-mCherry.
L240F TUBB rescue assay
Constructs for expression of WT TUBB or mutant TUBB variants as well as constructs for expression of a TUBB-targeting sgRNA or a non-targeting control sgRNA (neg_ctrl-2; Table S1), generated as described above, were individually packaged into lentiviruses. Constructs for doxycycline-inducible expression of WT TUBB or mutant TUBB were individually transduced into cMJ009 K562 cells and expression was induced 2 days after transduction with 50 ng/mL doxycycline. Cells were maintained in 50 ng/mL doxycycline for the remainder of the experiment, with daily replenishing of doxycycline assuming a half life of 24 hr. To measure effects on untreated cell growth, the fraction of TUBB-expressing cells was measured 2 days after induction and then every 2 days as mCherry-positive cells by flow cytometry on an LSR-II (BD Biosciences). To measure effects on drug sensitivity, cells were treated with drugs or DMSO 2 days after induction and the fraction of TUBB-expressing cells was measured 2 days after treatment and then every day by flow cytometry. For assays also involving sgRNAs, cells were first infected with the corresponding TUBB expression construct and then infected with the corresponding sgRNA expression construct 2 days later and induced the same day. To measure covering of knockdown of endogenous TUBB, the fraction of TUBB- and sgRNA-expressing cells was measured 2 days after the second infection and then every 2 days as mCherry- and GFP-positive cells by flow cytometry. To measure the effect of knockdown of endogenous TUBB on rigosertib sensitivity, cells were treated with rigosertib or DMSO 4 days after the second infection and the fraction of TUBB- and sgRNA-expressing cells was measured 2 days after treatment and then every day by flow cytometry.
For experiments in HeLa and H358 cells, constructs for stable expression of WT TUBB or L240F TUBB were individually transduced into WT HeLa “Kyoto” or WT H358 cells at multiplicity of infection > 1. For rigosertib sensitivity assays in HeLa cells, a mixture of transduced and WT cells was treated with rigosertib or DMSO 3 days after transduction and the fraction of TUBB-expressing cells was measured 2 days after treatment as mCherry-positive cells by flow cytometry on an LSR-II (BD Biosciences). Rigosertib sensitivity assays in H358 cells were carried out a similar fashion, with the following modification: cells were treated with rigosertib or DMSO for 2 days, at which point the compounds were washed out and cells were allowed to recover for 1 day prior to measurement.
Related to Figure 7C: Assays were performed in K562 cells constitutively expressing rtTA and dCas9-KRAB (cMJ009, described above) and transduced with doxycycline-inducible constructs for expression of L240F or WT TUBB (marked with mCherry). TUBB Expression was induced 2 d after transduction. Cells were treated with the indicated concentrations of rigosertib or vinblastine or with DMSO 4 d after transduction.
Related to Figure 7D: Assays were performed in K562 cells constitutively expressing rtTA and dCas9-KRAB (cMJ009, described above). Cells were first transduced with indicated doxycycline-inducible constructs for expression of L240F or WT TUBB (marked with mCherry) and 3 d later transduced with constructs for expression of an sgRNA targeting the endogenous TUBB locus or a non-targeting control sgRNA (marked with GFP). TUBB expression was induced on the same day. Cells were treated with the indicated concentrations of rigosertib or DMSO 4 d after transduction with the sgRNA construct.
Quantification and Statistical Analysis
Sequencing counts from CRISPR screens were processed using the Python-based ScreenProcessing pipeline (https://github.com/mhorlbeck/ScreenProcessing; Horlbeck et al., 2016). Details of methods to calculate phenotypes and p-values have been described previously (Gilbert et al., 2014, Horlbeck et al., 2016). All additional CRISPR screen data analyses were performed in Python 2.7 using a combination of Numpy (v1.12.1), Pandas (v0.17.1), and Scipy (v0.17.0). For all experiments, details of quantification and statistical methods used are described in the corresponding figure legends or results sections. The methods used to quantify microtubule growth properties in cells and in vitro are described above.
Data and Software Availability
Imaging data presented in Figures 4 and S4 have been deposited with Mendeley Data and are available at https://doi.org/10.17632/dfdxy4ksh3.1. Imaging data presented in Figures 5A and 5D have been deposited with Mendeley data and are available at https://doi.org/10.17632/tm22dtht9x.1 and https://doi.org/10.17632/t6g8bfpgvk.1, respectively. The accession number for the crystal structure of the tubulin-rigosertib complex reported in this paper is PDB: 5OV7.
Author Contributions
M.J., L.A.G., M.A.H., M.E.T., and J.S.W. contributed to the study’s general conception, design, and interpretation. M.J., G.M., M.O.S., M.E.T., and J.S.W. wrote the manuscript, with critical input from all authors. M.J., Y.C., L.A.G., M.A.H., J.J.S., and M.Y.C. designed, performed, and interpreted genetic experiments, with guidance from M.K. and J.S.W. L.K. and M.E.T. designed, performed, and interpreted mitotic imaging and microtubule tracking experiments. A.R. designed, performed, and interpreted in vitro microtubule polymerization experiments, with guidance from A.A. G.M. designed, performed, and interpreted crystallography experiments, with guidance from A.E.P. and M.O.S.
Acknowledgments
We thank Eric Chow, Derek Bogdanoff (UCSF Center for Advanced Technology), Vincent Olieric, and Meitian Wang (Swiss Light Source) for technical assistance; Jeffrey Hussmann for help with data analysis; Marco Hein for sharing constructs; Kevan Shokat for pointing out rigosertib as a promising drug with a poorly characterized molecular target; Lynn McGregor (Shokat lab) for sharing ARS-853 and the H358 cell line; and Carol Gross and members of the Weissman lab for helpful discussions. This work was funded by the NIH (grants P50 GM102706, U01 CA168370, and R01 DA036858 to J.S.W. and post-doctoral fellowship F32 GM116331 to M.J.), the Swiss National Science Foundation (grant 31003A_166608 to M.O.S.), the European Research Council (starting grant ERC-STG 677936-RNAREG to M.E.T.), a fellowship from the Dutch Cancer Society (KWF) to M.E.T., NWO CW ECHO grant 711.015.005 to A.A., NIH/NCI Pathway to Independence Award K99 CA204602 to L.A.G., and an NIH/NCI Pathway to Independence Award (K99 CA181494) and Stand Up To Cancer Innovative Research Grant to M.K. J.S.W. is a Howard Hughes Medical Institute Investigator. M.A.H., L.A.G., M.K., and J.S.W. have filed a patent application related to CRISPRi and CRISPRa screening (PCT/US15/40449). M.E.T., L.A.G., and J.S.W. have filed a patent application for the SunTag technology (PCT/US2015/040439). J.S.W. is a founder of KSQ Therapeutics, a CRISPR functional genomics company. Oligonucleotide pools were provided courtesy of the Innovative Genomics Institute.
Published: October 5, 2017
Footnotes
Supplemental Information includes six figures, one table, one movie, and one data file and can be found with this article online at https://doi.org/10.1016/j.molcel.2017.09.012.
Contributor Information
Marvin E. Tanenbaum, Email: m.tanenbaum@hubrecht.eu.
Jonathan S. Weissman, Email: jonathan.weissman@ucsf.edu.
Supplemental Information
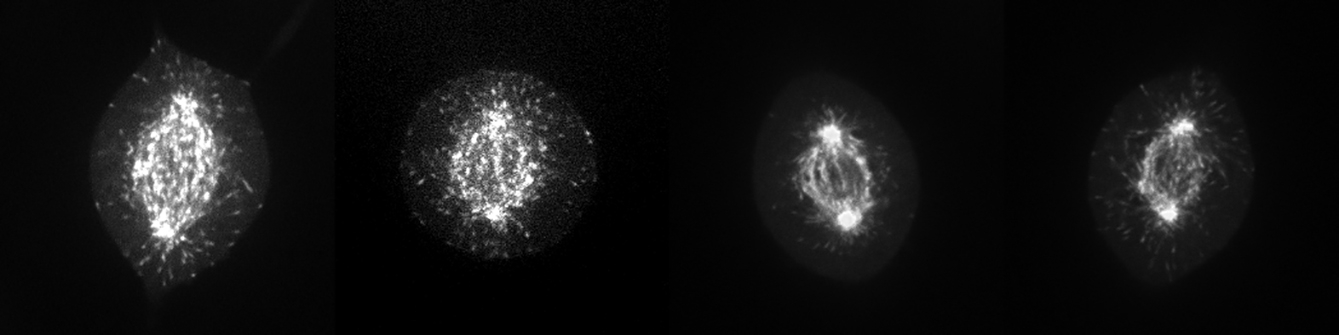
A: sgRNA read counts and phenotypes for genome-wide CRISPRi screen (related to Figure 1). B: Gene rigosertib sensitivity and untreated growth phenotypes and p-values for genome-wide CRISPRi screen (related to Figure 1). C: sgRNA read counts and phenotypes for genome-wide CRISPRa screen (related to Figure 1). D: Gene rigosertib sensitivity and untreated growth phenotypes and p-values for genome-wide CRISPRa screen (related to Figure 1). E: sgRNA read counts and phenotypes for sublibrary CRISPRi screen (related to Figure 3). F: Gene sensitivity and untreated growth phenotypes and p-values for sublibrary CRISPRi screen (related to Figure 3). G: sgRNA read counts and phenotypes for sublibrary CRISPRa screen (related to Figure 3). H: Gene sensitivity and untreated growth phenotypes and p-values for sublibrary CRISPRa screen (related to Figure 3).
References
- Adamson B., Norman T.M., Jost M., Cho M.Y., Nuñez J.K., Chen Y., Villalta J.E., Gilbert L.A., Horlbeck M.A., Hein M.Y. A multiplexed single-cell CRISPR screening platform enables systematic dissection of the unfolded protein response. Cell. 2016;167:1867–1882. doi: 10.1016/j.cell.2016.11.048. [DOI] [PMC free article] [PubMed] [Google Scholar]
- Akhmanova A., Steinmetz M.O. Control of microtubule organization and dynamics: two ends in the limelight. Nat. Rev. Mol. Cell Biol. 2015;16:711–726. doi: 10.1038/nrm4084. [DOI] [PubMed] [Google Scholar]
- Anderson D.J., Le Moigne R., Djakovic S., Kumar B., Rice J., Wong S., Wang J., Yao B., Valle E., Kiss von Soly S. Targeting the AAA ATPase p97 as an approach to treat cancer through disruption of protein homeostasis. Cancer Cell. 2015;28:653–665. doi: 10.1016/j.ccell.2015.10.002. [DOI] [PMC free article] [PubMed] [Google Scholar]
- Arrowsmith C.H., Audia J.E., Austin C., Baell J., Bennett J., Blagg J., Bountra C., Brennan P.E., Brown P.J., Bunnage M.E. The promise and peril of chemical probes. Nat. Chem. Biol. 2015;11:536–541. doi: 10.1038/nchembio.1867. [DOI] [PMC free article] [PubMed] [Google Scholar]
- Ashley E.A. Towards precision medicine. Nat. Rev. Genet. 2016;17:507–522. doi: 10.1038/nrg.2016.86. [DOI] [PubMed] [Google Scholar]
- Athuluri-Divakar S.K., Vasquez-Del Carpio R., Dutta K., Baker S.J., Cosenza S.C., Basu I., Gupta Y.K., Reddy M.V.R., Ueno L., Hart J.R. A small molecule RAS-mimetic disrupts RAS association with effector proteins to block signaling. Cell. 2016;165:643–655. doi: 10.1016/j.cell.2016.03.045. [DOI] [PMC free article] [PubMed] [Google Scholar]
- Brouhard G.J., Rice L.M. The contribution of αβ-tubulin curvature to microtubule dynamics. J. Cell Biol. 2014;207:323–334. doi: 10.1083/jcb.201407095. [DOI] [PMC free article] [PubMed] [Google Scholar]
- Carter H.E., Cools H.J., West J.S., Shaw M.W., Fraaije B.A. Detection and molecular characterisation of Pyrenopeziza brassicae isolates resistant to methyl benzimidazole carbamates. Pest Manag. Sci. 2013;69:1040–1048. doi: 10.1002/ps.3585. [DOI] [PubMed] [Google Scholar]
- Dominguez A.A., Lim W.A., Qi L.S. Beyond editing: repurposing CRISPR-Cas9 for precision genome regulation and interrogation. Nat. Rev. Mol. Cell Biol. 2016;17:5–15. doi: 10.1038/nrm.2015.2. [DOI] [PMC free article] [PubMed] [Google Scholar]
- Doodhi H., Prota A.E., Rodríguez-García R., Xiao H., Custar D.W., Bargsten K., Katrukha E.A., Hilbert M., Hua S., Jiang K. Termination of protofilament elongation by eribulin induces lattice defects that promote microtubule catastrophes. Curr. Biol. 2016;26:1713–1721. doi: 10.1016/j.cub.2016.04.053. [DOI] [PubMed] [Google Scholar]
- Dorléans A., Gigant B., Ravelli R.B.G., Mailliet P., Mikol V., Knossow M. Variations in the colchicine-binding domain provide insight into the structural switch of tubulin. Proc. Natl. Acad. Sci. USA. 2009;106:13775–13779. doi: 10.1073/pnas.0904223106. [DOI] [PMC free article] [PubMed] [Google Scholar]
- Dumontet C., Jordan M.A. Microtubule-binding agents: a dynamic field of cancer therapeutics. Nat. Rev. Drug Discov. 2010;9:790–803. doi: 10.1038/nrd3253. [DOI] [PMC free article] [PubMed] [Google Scholar]
- Edelstein A.D., Tsuchida M.A., Amodaj N., Pinkard H., Vale R.D., Stuurman N. Advanced methods of microscope control using μManager software. J. Biol. Methods. 2014;1:e10. doi: 10.14440/jbm.2014.36. [DOI] [PMC free article] [PubMed] [Google Scholar]
- Garcia-Manero G., Fenaux P., Al-Kali A., Baer M.R., Sekeres M.A., Roboz G.J., Gaidano G., Scott B.L., Greenberg P., Platzbecker U., ONTIME study investigators Rigosertib versus best supportive care for patients with high-risk myelodysplastic syndromes after failure of hypomethylating drugs (ONTIME): a randomised, controlled, phase 3 trial. Lancet Oncol. 2016;17:496–508. doi: 10.1016/S1470-2045(16)00009-7. [DOI] [PubMed] [Google Scholar]
- Gigant B., Wang C., Ravelli R.B.G., Roussi F., Steinmetz M.O., Curmi P.A., Sobel A., Knossow M. Structural basis for the regulation of tubulin by vinblastine. Nature. 2005;435:519–522. doi: 10.1038/nature03566. [DOI] [PubMed] [Google Scholar]
- Gilbert L.A., Larson M.H., Morsut L., Liu Z., Brar G.A., Torres S.E., Stern-Ginossar N., Brandman O., Whitehead E.H., Doudna J.A. CRISPR-mediated modular RNA-guided regulation of transcription in eukaryotes. Cell. 2013;154:442–451. doi: 10.1016/j.cell.2013.06.044. [DOI] [PMC free article] [PubMed] [Google Scholar]
- Gilbert L.A., Horlbeck M.A., Adamson B., Villalta J.E., Chen Y., Whitehead E.H., Guimaraes C., Panning B., Ploegh H.L., Bassik M.C. Genome-scale CRISPR-mediated control of gene repression and activation. Cell. 2014;159:647–661. doi: 10.1016/j.cell.2014.09.029. [DOI] [PMC free article] [PubMed] [Google Scholar]
- Gumireddy K., Reddy M.V.R., Cosenza S.C., Boominathan R., Baker S.J., Papathi N., Jiang J., Holland J., Reddy E.P. ON01910, a non-ATP-competitive small molecule inhibitor of Plk1, is a potent anticancer agent. Cancer Cell. 2005;7:275–286. doi: 10.1016/j.ccr.2005.02.009. [DOI] [PubMed] [Google Scholar]
- Heitman J., Movva N.R., Hall M.N. Targets for cell cycle arrest by the immunosuppressant rapamycin in yeast. Science. 1991;253:905–909. doi: 10.1126/science.1715094. [DOI] [PubMed] [Google Scholar]
- Ho C.H., Piotrowski J., Dixon S.J., Baryshnikova A., Costanzo M., Boone C. Combining functional genomics and chemical biology to identify targets of bioactive compounds. Curr. Opin. Chem. Biol. 2011;15:66–78. doi: 10.1016/j.cbpa.2010.10.023. [DOI] [PubMed] [Google Scholar]
- Hood F.E., Royle S.J. Pulling it together: the mitotic function of TACC3. BioArchitecture. 2011;1:105–109. doi: 10.4161/bioa.1.3.16518. [DOI] [PMC free article] [PubMed] [Google Scholar]
- Hoon S., Smith A.M., Wallace I.M., Suresh S., Miranda M., Fung E., Proctor M., Shokat K.M., Zhang C., Davis R.W. An integrated platform of genomic assays reveals small-molecule bioactivities. Nat. Chem. Biol. 2008;4:498–506. doi: 10.1038/nchembio.100. [DOI] [PubMed] [Google Scholar]
- Horlbeck M.A., Gilbert L.A., Villalta J.E., Adamson B., Pak R.A., Chen Y., Fields A.P., Park C.Y., Corn J.E., Kampmann M., Weissman J.S. Compact and highly active next-generation libraries for CRISPR-mediated gene repression and activation. eLife. 2016;5:e19760. doi: 10.7554/eLife.19760. [DOI] [PMC free article] [PubMed] [Google Scholar]
- Huang W., Sherman B.T., Lempicki R.A. Bioinformatics enrichment tools: paths toward the comprehensive functional analysis of large gene lists. Nucleic Acids Res. 2009;37:1–13. doi: 10.1093/nar/gkn923. [DOI] [PMC free article] [PubMed] [Google Scholar]
- Jiang H., Pritchard J.R., Williams R.T., Lauffenburger D.A., Hemann M.T. A mammalian functional-genetic approach to characterizing cancer therapeutics. Nat. Chem. Biol. 2011;7:92–100. doi: 10.1038/nchembio.503. [DOI] [PMC free article] [PubMed] [Google Scholar]
- Kampmann M. Elucidating drug targets and mechanisms of action by genetic screens in mammalian cells. Chem. Commun. (Camb.) 2017;53:7162–7167. doi: 10.1039/c7cc02349a. [DOI] [PMC free article] [PubMed] [Google Scholar]
- Kampmann M., Bassik M.C., Weissman J.S. Integrated platform for genome-wide screening and construction of high-density genetic interaction maps in mammalian cells. Proc. Natl. Acad. Sci. USA. 2013;110:E2317–E2326. doi: 10.1073/pnas.1307002110. [DOI] [PMC free article] [PubMed] [Google Scholar]
- Karplus P.A., Diederichs K. Linking crystallographic model and data quality. Science. 2012;336:1030–1033. doi: 10.1126/science.1218231. [DOI] [PMC free article] [PubMed] [Google Scholar]
- Kavallaris M. Microtubules and resistance to tubulin-binding agents. Nat. Rev. Cancer. 2010;10:194–204. doi: 10.1038/nrc2803. [DOI] [PubMed] [Google Scholar]
- Lu Y., Chen J., Xiao M., Li W., Miller D.D. An overview of tubulin inhibitors that interact with the colchicine binding site. Pharm. Res. 2012;29:2943–2971. doi: 10.1007/s11095-012-0828-z. [DOI] [PMC free article] [PubMed] [Google Scholar]
- Lu T., Laughton C.A., Wang S., Bradshaw T.D. In vitro antitumor mechanism of (E)-N-(2-methoxy-5-(((2,4,6-trimethoxystyryl)sulfonyl)methyl)pyridin-3-yl)methanesulfonamide. Mol. Pharmacol. 2015;87:18–30. doi: 10.1124/mol.114.093245. [DOI] [PubMed] [Google Scholar]
- Mohan R., Katrukha E.A., Doodhi H., Smal I., Meijering E., Kapitein L.C., Steinmetz M.O., Akhmanova A. End-binding proteins sensitize microtubules to the action of microtubule-targeting agents. Proc. Natl. Acad. Sci. USA. 2013;110:8900–8905. doi: 10.1073/pnas.1300395110. [DOI] [PMC free article] [PubMed] [Google Scholar]
- Munoz L. Non-kinase targets of protein kinase inhibitors. Nat. Rev. Drug Discov. 2017;16:424–440. doi: 10.1038/nrd.2016.266. [DOI] [PubMed] [Google Scholar]
- Nijman S.M.B. Functional genomics to uncover drug mechanism of action. Nat. Chem. Biol. 2015;11:942–948. doi: 10.1038/nchembio.1963. [DOI] [PubMed] [Google Scholar]
- Oussenko I.A., Holland J.F., Reddy E.P., Ohnuma T. Effect of ON 01910.Na, an anticancer mitotic inhibitor, on cell-cycle progression correlates with RanGAP1 hyperphosphorylation. Cancer Res. 2011;71:4968–4976. doi: 10.1158/0008-5472.CAN-10-1603. [DOI] [PubMed] [Google Scholar]
- Patricelli M.P., Janes M.R., Li L.S., Hansen R., Peters U., Kessler L.V., Chen Y., Kucharski J.M., Feng J., Ely T. Selective inhibition of oncogenic KRAS output with small molecules targeting the inactive state. Cancer Discov. 2016;6:316–329. doi: 10.1158/2159-8290.CD-15-1105. [DOI] [PubMed] [Google Scholar]
- Prasad A., Park I.W., Allen H., Zhang X., Reddy M.V., Boominathan R., Reddy E.P., Groopman J.E. Styryl sulfonyl compounds inhibit translation of cyclin D1 in mantle cell lymphoma cells. Oncogene. 2009;28:1518–1528. doi: 10.1038/onc.2008.502. [DOI] [PubMed] [Google Scholar]
- Prota A.E., Bargsten K., Zurwerra D., Field J.J., Díaz J.F., Altmann K.H., Steinmetz M.O. Molecular mechanism of action of microtubule-stabilizing anticancer agents. Science. 2013;339:587–590. doi: 10.1126/science.1230582. [DOI] [PubMed] [Google Scholar]
- Ravelli R.B.G., Gigant B., Curmi P.A., Jourdain I., Lachkar S., Sobel A., Knossow M. Insight into tubulin regulation from a complex with colchicine and a stathmin-like domain. Nature. 2004;428:198–202. doi: 10.1038/nature02393. [DOI] [PubMed] [Google Scholar]
- Reddy M.V.R., Venkatapuram P., Mallireddigari M.R., Pallela V.R., Cosenza S.C., Robell K.A., Akula B., Hoffman B.S., Reddy E.P. Discovery of a clinical stage multi-kinase inhibitor sodium (E)-2-2-methoxy-5-[(2′,4′,6′-trimethoxystyrylsulfonyl)methyl]phenylaminoacetate (ON 01910.Na): synthesis, structure-activity relationship, and biological activity. J. Med. Chem. 2011;54:6254–6276. doi: 10.1021/jm200570p. [DOI] [PMC free article] [PubMed] [Google Scholar]
- Ritt D.A., Abreu-Blanco M.T., Bindu L., Durrant D.E., Zhou M., Specht S.I., Stephen A.G., Holderfield M., Morrison D.K. Inhibition of Ras/Raf/MEK/ERK pathway signaling by a stress-induced phospho-regulatory circuit. Mol. Cell. 2016;64:875–887. doi: 10.1016/j.molcel.2016.10.029. [DOI] [PMC free article] [PubMed] [Google Scholar]
- Rix U., Superti-Furga G. Target profiling of small molecules by chemical proteomics. Nat. Chem. Biol. 2009;5:616–624. doi: 10.1038/nchembio.216. [DOI] [PubMed] [Google Scholar]
- Savitski M.M., Reinhard F.B.M., Franken H., Werner T., Savitski M.F., Eberhard D., Martinez Molina D., Jafari R., Dovega R.B., Klaeger S. Tracking cancer drugs in living cells by thermal profiling of the proteome. Science. 2014;346:1255784. doi: 10.1126/science.1255784. [DOI] [PubMed] [Google Scholar]
- Silverman L.R., Greenberg P., Raza A., Olnes M.J., Holland J.F., Reddy P., Maniar M., Wilhelm F. Clinical activity and safety of the dual pathway inhibitor rigosertib for higher risk myelodysplastic syndromes following DNA methyltransferase inhibitor therapy. Hematol. Oncol. 2015;33:57–66. doi: 10.1002/hon.2137. [DOI] [PubMed] [Google Scholar]
- Smith A.M., Ammar R., Nislow C., Giaever G. A survey of yeast genomic assays for drug and target discovery. Pharmacol. Ther. 2010;127:156–164. doi: 10.1016/j.pharmthera.2010.04.012. [DOI] [PMC free article] [PubMed] [Google Scholar]
- Steegmaier M., Hoffmann M., Baum A., Lénárt P., Petronczki M., Krssák M., Gürtler U., Garin-Chesa P., Lieb S., Quant J. BI 2536, a potent and selective inhibitor of polo-like kinase 1, inhibits tumor growth in vivo. Curr. Biol. 2007;17:316–322. doi: 10.1016/j.cub.2006.12.037. [DOI] [PubMed] [Google Scholar]
- Stepanova T., Slemmer J., Hoogenraad C.C., Lansbergen G., Dortland B., De Zeeuw C.I., Grosveld F., van Cappellen G., Akhmanova A., Galjart N. Visualization of microtubule growth in cultured neurons via the use of EB3-GFP (end-binding protein 3-green fluorescent protein) J. Neurosci. 2003;23:2655–2664. doi: 10.1523/JNEUROSCI.23-07-02655.2003. [DOI] [PMC free article] [PubMed] [Google Scholar]
- Tanenbaum M.E., Medema R.H., Akhmanova A. Regulation of localization and activity of the microtubule depolymerase MCAK. BioArchitecture. 2011;1:80–87. doi: 10.4161/bioa.1.2.15807. [DOI] [PMC free article] [PubMed] [Google Scholar]
- Tanenbaum M.E., Gilbert L.A., Qi L.S., Weissman J.S., Vale R.D. A protein-tagging system for signal amplification in gene expression and fluorescence imaging. Cell. 2014;159:635–646. doi: 10.1016/j.cell.2014.09.039. [DOI] [PMC free article] [PubMed] [Google Scholar]
- Twarog N.R., Low J.A., Currier D.G., Miller G., Chen T., Shelat A.A. Robust classification of small-molecule mechanism of action using a minimalist high-content microscopy screen and multidimensional phenotypic trajectory analysis. PLoS ONE. 2016;11:e0149439. doi: 10.1371/journal.pone.0149439. [DOI] [PMC free article] [PubMed] [Google Scholar]
- Wang T., Wei J.J., Sabatini D.M., Lander E.S. Genetic screens in human cells using the CRISPR-Cas9 system. Science. 2014;343:80–84. doi: 10.1126/science.1246981. [DOI] [PMC free article] [PubMed] [Google Scholar]
Associated Data
This section collects any data citations, data availability statements, or supplementary materials included in this article.
Supplementary Materials
A: sgRNA read counts and phenotypes for genome-wide CRISPRi screen (related to Figure 1). B: Gene rigosertib sensitivity and untreated growth phenotypes and p-values for genome-wide CRISPRi screen (related to Figure 1). C: sgRNA read counts and phenotypes for genome-wide CRISPRa screen (related to Figure 1). D: Gene rigosertib sensitivity and untreated growth phenotypes and p-values for genome-wide CRISPRa screen (related to Figure 1). E: sgRNA read counts and phenotypes for sublibrary CRISPRi screen (related to Figure 3). F: Gene sensitivity and untreated growth phenotypes and p-values for sublibrary CRISPRi screen (related to Figure 3). G: sgRNA read counts and phenotypes for sublibrary CRISPRa screen (related to Figure 3). H: Gene sensitivity and untreated growth phenotypes and p-values for sublibrary CRISPRa screen (related to Figure 3).