Abstract
Chronic Kidney Disease-Mineral Bone Disorder(CKD-MBD) is a systemic disorder of the mineral and bone metabolism seen in patients with Chronic Kidney Disease(CKD). It is manifested by either one or a combination of the following: (a) Abnormalities of calcium, phosphorus, PTH, or vitamin D metabolism. (b) Abnormalities in bone turnover, mineralization, volume, linear growth, or strength. (c) Vascular or other soft- tissue calcification. Renal osteodystrophy measures the skeletal component of CKD-MBD. To study the histomorphology of bone marrow biopsy in patients with CKD-MBD and correlate the histological features of bone biopsy with the clinicobiochemical parameters. 32 cases of diagnosed CKD-MBD formed the study group. Detailed clinical history and biochemical analysis was done for them. Bone marrow trephine biopsies were conducted and the histology was studied. The clinicobiochemical and the histomorphological findings were correlated. Based on the bone biopsy findings, Hyperparathyroid bone disease consisted of-14 cases (44%), Mixed uremic osteodystrophy of-16 cases (50%) and one case (3%) each of Low turnover disease (Adynamic bone disease) and Normal histology. The mean blood urea, S. Creatinine, S Phosphate and the S. Vit D3 were found to be statistically significant between the two major subgroups. The area of the bone trabeculae and the osteoid percentage was found to be more in the MUO group and was found to be statistically significant. Conclusion: A trephine biopsy helps us in understanding the skeletal symptoms of the CKD when the clinical and biochemical parameters are not conclusive. A biopsy in unexplained bone pain/fractures, unexplained hypercalcemia and elevated phosphate levels helps in guiding the proper management of the patient.
Introduction
Chronic kidney disease is associated with abnormalities in bone and minerals [1]. This disorder previously termed as renal osteodystrophy (ROD) has now been termed chronic kidney disease-related mineral and bone disorder (CKD-MBD) by the Kidney Disease Improving Global Outcomes (KDIGO) foundation [1].
The major disorders of bone can be classified into those associated with high parathyroid hormone (PTH) levels (osteitis fibrosa cystica) and those with low or normal PTH levels (adynamic bone disease) [2]. Within the past two decades the predominance of hyperparathyroid bone disease (high-turnover disease) has diminished as more adynamic renal osteodystrophy (low-bone turnover disease) are being diagnosed especially in the dialysis population.[3−5].
Recent studies have shown that more than 50% of patients with only moderate renal failure have abnormal bone histology [6, 7], indicating that skeletal changes may be initiated years before the symptoms arise and at least in some patients at very early stages in CRF.
The bone biopsy remains the gold standard for diagnosing the abnormalities of the bone turnover. It is the parameter to which all other non-invasive parameters must be compared for bone turnover [8]. In addition bone biopsies have been helpful in determining the clinical course and response to treatment. It is necessary to have a rational approach to the diagnosis and assessment of CKD-MBD in order to devise a treatment plan that will lead to improved outcome of the patients.
This study was carried out to study the histomorphology of bone marrow biopsy and correlate the histological features of bone biopsy with the clinico-biochemical parameters.
Materials and Methods
32 diagnosed cases of Chronic Kidney Disease-Mineral Bone Disorder (CKD-MBD) were included. 15 Bone Marrow biopsies with normal histology and cases without any bony or biochemical abnormalities were included as controls. The study was conducted after getting clearance from the institute ethics committee. Each case was assessed with relevant clinical history including bone pains and fractures. Complete hematological workup including peripheral smear examination for red cell morphology especially burr cells was carried out. The biochemical profile included blood urea, S.Creatinine, uric acid, Calcium, Phosphate, alkaline phosphatase (ALP), S.PTH and 25-hydroxycholecalciferol.
BM trephine biopsy was carried out in all cases and imprints were made. Each biopsy was then cut into two- one embedded in plastic and the other in paraffin. Sections were then used for H & E staining, Masson’s trichrome(MT), Von Kossa and other special stains carried out wherever indicated. Each BMB was assessed for trabecular surface and number of osteoblasts and osteoclasts, peritrabecular fibrosis, thickness of osteoid seams and calcium content. The measurements were calculated with a scale fitted into the eyepiece of the microscope. The histomorphology of BMB was correlated with clinico-biochemical profile.
Based on the classification by Malluche [8] and by Goce B Spasovski [9], the cases were classified as: (a) Hyperparathyroid bone disease(HPT) (b) Mixed Uremic Osteodystrophy(MUO) and (c) Low Turnover Uremic Osteodystrophy.
Statistical Analysis
Statistical analysis will be done using the Student –t test and Chi square to correlate the bone histology with the clinico-biochemical parameters.
Observations and Results
Thirty-two cases of the study group consisting of chronic kidney disease and 15 cases (biopsies) of the control group were taken.
Based on the bone biopsy findings, the cases were divided into the following sub-groups-Hyperparathyroid bone disease-14 cases (44%), Mixed uremic osteodystrophy-16 cases (50%), Low turnover disease (Adynamic bone disease)-1 case(3%) and Normal histology- 1 case(3%). Mean age of all the cases was 45.87 with an age range of 20–75 years, however that of the control, mean was 40.6 age range was 21–70 years. The male cases surpassed the female population by a minimal margin (ratio = 1.13:1).
The most common association of the cases was seen with hypertension. A lone case of adynamic bone disease was seen in an elderly diabetic. A 45 years old lady with MUO showed osteoporosis on radiological examination. Only six patients were on dialysis and the rest (26/32) of the study population was in the predialysis group.
Biochemical tests were carried out to assess patient’s kidney functions (Table 1). The mean blood urea level was 147.84 mg/dl and the mean S. Creatinine level was 5.94 mg/dl. Mean blood urea and S. Creatinine were higher in the HPT group than the MUO group and was found to be statistically significant (p < 0.013 and p < 0.0039 respectively). The S. Calcium level was low in the study population with a mean of 7.19 mg/dl. The mean Calcium level of MUO cases was lower than HPT at 6.98 mg/dl. The mean S. phosphate level was 4.76 mg/dl. The mean phosphate was higher in HPT than the MUO group. The mean ALP was 186.5 IU/L. The mean ALP was higher in MUO than the HPT group. Statistical evaluation showed the S. Phosphate to have a correlation between the two histologic group with a p < 0.035. However no correlation was seen between the S. Calcium and S.ALP and the two predominant histologic types. Mean Vitamin D3 levels in the study group was10.90 ng/ml. It was higher in MUO than in the HPT group. It was found to be statistically significant with a p < 0.0033. The mean PTH level was 367.76 and was higher in the HPT than the MUO, however no correlation was seen between the two histologic types.
Table 1.
Biochemical profile of the types of ROD compared to the total population as mean + SD
| B. urea | S. Creat | S Ca | S PO4 | S ALP | S Vit D3 | S PTH | |
|---|---|---|---|---|---|---|---|
| Total cases (32) | 147.84 + 83.39 | 5.94 + 4.76 | 7.19 + 1.09 | 4.76 + 1.91 | 186.5 + 121.45 | 10.90 + 7.43 | 367.76 + 294.55 |
| HPT (14) | 189 + 101.56 | 7.55 + 6.58 | 7.27 + 0.98 | 5.59 + 2.37 | 185.42 + 127.55 | 7.06 + 5.33 | 430.45 + 343.10 |
| MUO (16) | 109 + 40.48 | 4.87 + 2.12 | 6.98 + 1.20 | 4.45 + 0.99 | 202.25 + 127.23 | 14.66 + 7.55 | 350.46 + 230.83 |
| Adynamic(1) | 34 | 1.4 | 7.9 | 3.7 | 233 | 3.56 | 34.85 |
30 patients were anemic with a mean hemoglobin of 8.26 g/dl. Peripheral smear showed burr cells in 4 cases. Bone marrow aspirate/imprint findings: 7 cases with hypercellular marrow, 1 hypocellular and rest normocellular. 2 cases demonstrated multiple myeloma. 4 cases on BMA/BMI showed osteoclastic and osteoblastic proliferation.
The various parameters observed in the bone marrow biopsies were: area of bony trabeculae (Table 2), osteoid width (Table 3), fibrosis and osteoblastic & osteoclastic proliferation.
Table 2.
Area of the bony trabeculae as %
| HPT (%) | MUO (%) | Adynamic (%) | Controls (%) | |
|---|---|---|---|---|
| Mean | 24.01 | 42.4 | 6.12 | 18.8 |
| SD | 12.76 | 19.2 | – | 1.06 |
| Range (%) | 6.7–45.3 | 19–83.3 | – | 17.8–21.12 |
Table 3.
Osteoid width in the 32 cases
| Type of ROD | Osteoid percentage range (%) | Mean osteoid (%) |
|---|---|---|
| Hyperparathyroid bone Disease | 5–10 | 7.71 |
| Mixed uremic Osteodystrophy | 13–80 | 31.56 |
| Adynamic | 5–6 | – |
| Normal | 8 | – |
| Control | 5.63–8.9 | 6.9 |
Area of the bony trabeculae as percentage of the total bone biopsy was calculated and the MUO group showed more area with a mean of 42.4 than the HPT group with a mean of 24.01. The finding was found to be statistically significant with a p < 0.0002. The osteoid width was calculated as percentage. The mean osteoid of HPT was 7.71% and that of MUO was 31.56% and was found to be statistically significant with a p value of <0.0011.
The predominant histology among the cases consisted of MUO followed by HPT, and one case each of adynamic bone disease(ABD) and normal histology.
The cases of HPT showed bony trabeculae which were irregular in shape and thickness (Fig. 1). There was osteoclastic and osteoblastic proliferation. The bone cells were abnormally high in number, irregular in shape and arrangement. The enlarged osteoclasts were numerous, containing multiple nuclei with prominent nucleoli (Fig. 2). The resorption cavities were deep and irregular and few of them demonstrated dissecting or tunnelling resorption (Fig. 3). There was mild to moderate amount of fibrosis. The collagen fibres were seen being extruded even into the marrow cavity and in some cases the bone marrow was entirely replaced by fibrosis (Fig. 4). There was overproduction of collagen resulting in an increase in osteoid surface and volume and, sometimes, thickened osteoid seam. The osteoid was <12% in this group and it ranged from 5 to 10%. The collagen fibers are accumulated toward the bone surface and were deposited between osteoblasts and toward the bone marrow leading to paratrabecular fibrosis.
Fig. 1.
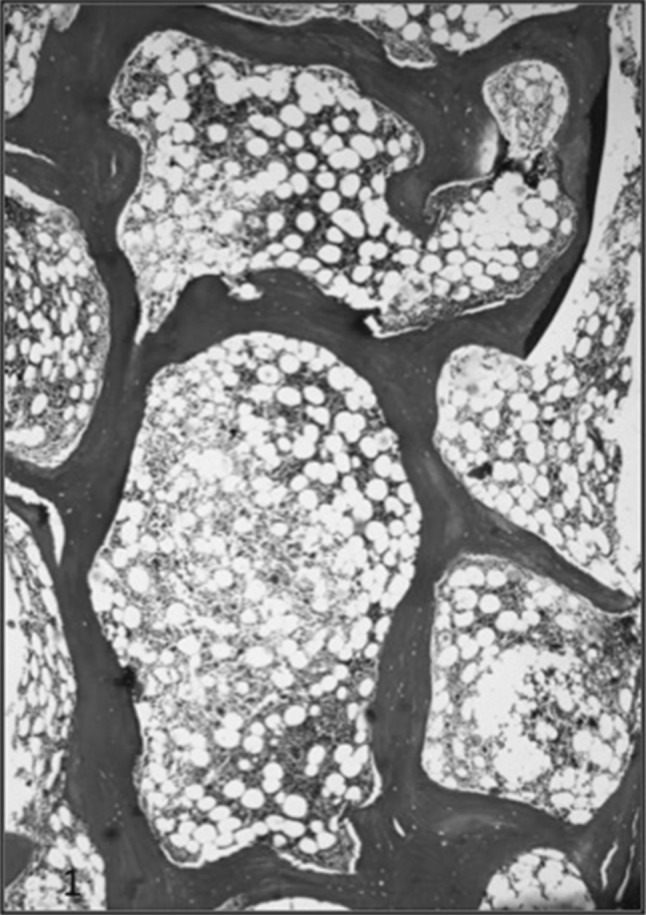
Masson Trichrome on decal section of bone marrow biopsy of a case of CKD showing variable thickness of bony trabeculae with area of lacunar and surface resorption
Fig. 2.
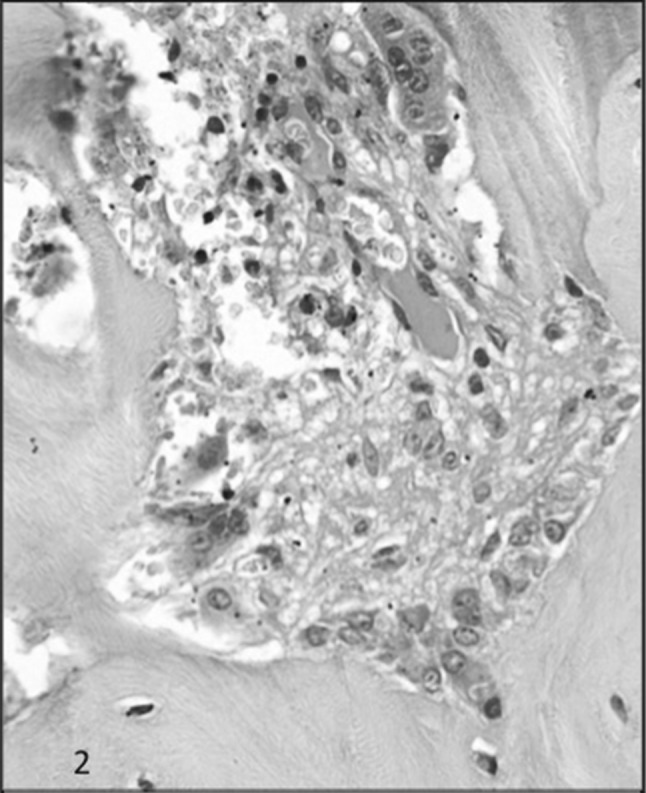
H & E section showing osteoblastic and osteoclastic proliferation along with tunnel resorption and moderate degree of fibrosis in the tunnel in a case of HPT
Fig. 3.
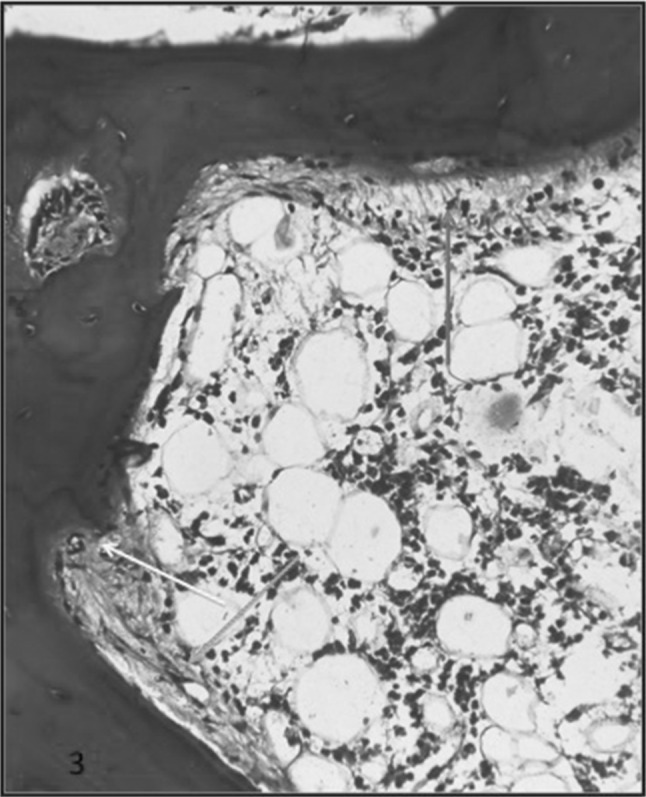
MT on decal section in a case of HPT showing peritrabecular fibrosis (Green arrow), hook resorption (Yellow arrow) and collagen being extruded into the marrow cavity (Red arrow)
Fig. 4.
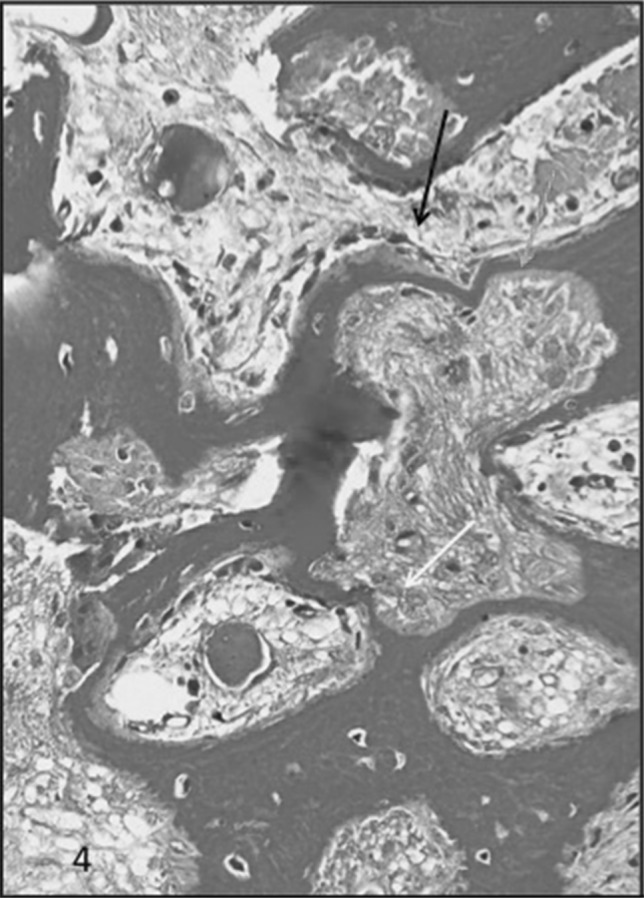
MT on deal section of bone biopsy showing marked variablity of the bony trabeculae along with areas of tunnel resorption (Black arrow), surface resorption (Yellow arrow), hooked resorption (Green arrow) and marked peritrabecular fibrosos (Blue arrow) extending into the marrow spaces in a case of HPT
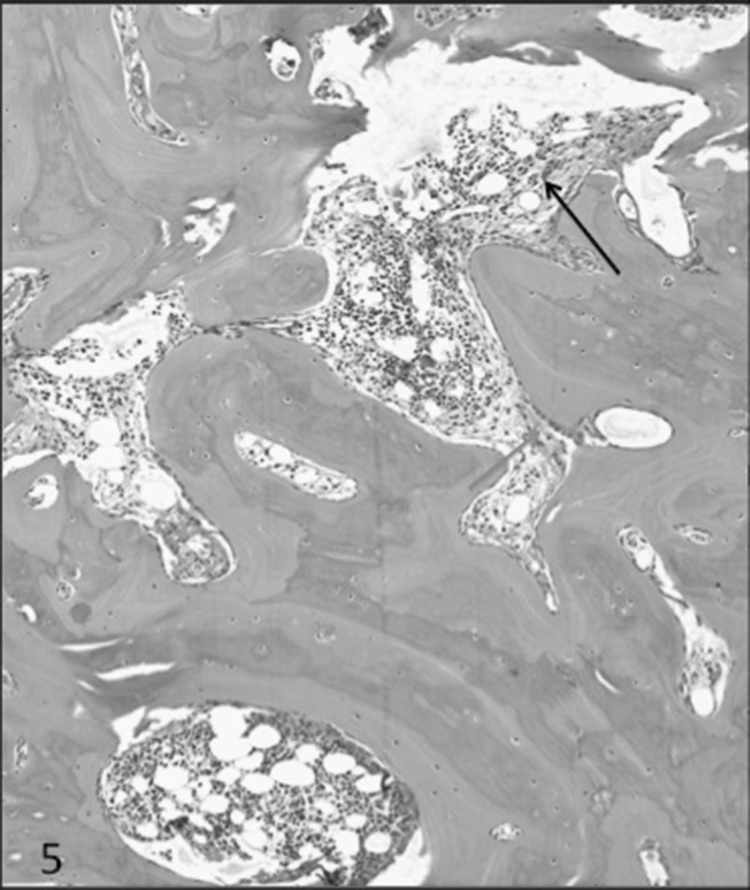
MUO showed features intermediate between adynamic and hyperparathyroid features. This group showed marked variablility in the thickness of bony trabeculae. The bony trabeculae were thickened to an extent that few of them had osteomalacia like picture (Figs. 5, 6). There was presence of both osteoblastic and osteoclastic proliferation; however was less than in HPT. The osteoid was >12% and it ranged from 13 to 80%. Few of them showed surface, hook, lacunar and/tunnel resorption. In ABD the bone volume was reduced. There were few osteoid seams. There was no osteoclastic or osteoblastic proliferation.
Fig. 5.
H & F section of a case of MUO showing marked variability of bony trabeculae. There are areas of osteoblastic proliferation (Blue arrow) and focal areas of peritrabecular fibrosis (Black arrow)
Fig. 6.
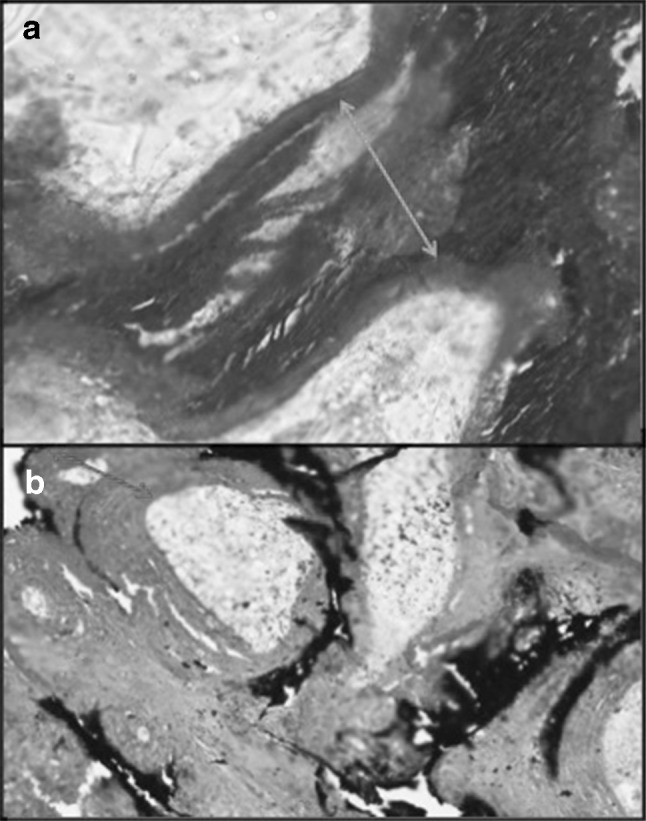
a Masson Trichrome and b Von Kossa on undecalcified sections showing increased osteoid in a case of MUO
Discussion
The average age of the patients was 45.87 with a range of 20–75 years. The age distribution showed a slight lower age of presentation in our study than the studies by Spasvoski [9] and Moore [10]. However, it showed similarities with the study by Sawaya [11]. The only difference being that the latter study was conducted in a study population undergoing dialysis. It matched with the study by Shin [12] on pre-dialysis patients.
The most common etiology in our study was hypertension. Eastwood in 1982 [13] found chronic glomerulonephritis to be the leading cause with hypertension and diabetes occupying the lowest prevalence. Coen G [14] also found glomerulonephritis to be the leading cause. Shin [12] observed the main etiology to be chroic glomerulonephritis followed by diabetes. In our study diabetes was one of the leading causes of CKD. The exact prevalence of chronic glomerulonephritis could not be known, since kidney biopsy could not be carried out. Coen G [14] found that diabetes mellitus was the second leading cause of Adynamic bone disease after chronic glomerulonephritis. Our lone case of adynamic bone disease was also a diabetic. Six cases were on dialysis while the rest 26 were not and 25 of 26 showed bone changes. Thus, in the predialysis phase 96.1% of them showed bone changes. This finding is similar to the one by Shin who noted that 91.4% of the patients of CKD demonstrated bone changes before the start of the dialysis [12].
The other biochemical parameters were correlated with the predominant types. The serum Creatinine was found to be significant (p < 0.0039) similar to Coen G [14] however differing from Spasvoski [9]. The serum Calcium was deranged in the study population and was lower than normal. However no correlation was seen between the bone histology and S Calcium similar to Moore [10] and Malluche [15].
The mean S Phosphate in the HPT subtype was slightly higher than in the MUO group. Correlation was seen between the S. Phosphate and the histological type similar to findings by Coen G. Spasovski [9] however did not find any correlation between the histologic type and the phosphate levels. The mean ALP level in MUO was higher with in MUO than in HPT. This finding corroborated with the findings of Spasvoski [9]. No correlation was found between the histological type and the S. ALP levels. Eastwood [13] did not find any correlation between the ALP and the histologic types. Spasvoski however did find a correlation between histologic types and ALP levels. Malluche et al. [15]. found the levels to be higher in HPT than MUO but there was no correlation between histology and ALP levels. The ALP is usually raised in high turnover bone diseases. The two major subgroups in our study population MUO and HPT being a high turnover the ALP levels were comparable. Hence no significant correlation could be ascertained.
The mean PTH in HPT group was at slightly higher than the MUO group. This finding was similar to the Coen G [14]. Malluche also found the levels of PTH to be higher in HPT than in MUO [15]. However Kazama [16] found that the MUO group had higher levels than HPT. Coen et al. [17] found that the predictive value of intact PTH in the noninvasive diagnosis of renal bone disease is higher in hemodialysis patients than in predialysis patients. However we did not find any correlation between the PTH levels and the 2 major histologic types, HPT and MUO subtypes. PTH has been found to be raised in high turnover diseases viz. HPT and MUO. Probably that is the reason why we got comparable results in the study group even though it was not statistically significant. The iPTH levels may also not be a good marker for bone turn over in mild renal failure [18].
The Vit D3 (25 OH) mean was higher in MUO froup than the HPT group. We found a correlation between the histologic type and the Vitamin D levels. Levin have found that the Vitamin D levels are associated with PTH levels [19]. It was noted that the Vit D3 levels declines early in CKD even before the PTH begins to rise. The Vit D3 levels have an inverse relationship with S.PTH levels. In our group, the PTH was slightly higher in the HPT group. Other causes could be because of the decreased sunlight exposure or malnutrition [19].
Anemia developing in the course of chronic kidney disease is an established finding. Lower hemoglobin may result from the loss of erythropoietin synthesis in the kidneys and/or the presence of inhibitors of erythropoiesis. Numerous articles by Fisher, Erslev and Besarab and others have documented the association of anemia with kidney failure and describe its various causes. [20–22] The severity of anemia in chronic kidney disease is related to the duration and extent of kidney failure.
The incidence of mixed uremic osteodystrophy was 50% in the present study. Its frequency is comparable to the study conducted by Faugere M C, Malluche H and Coen G who found MUO in 54.54%, 45–48% and 63.1% respectively (Table 4). In the latest study by Kazama (2010) the hyperparathyroid and mixed uremic osteodystrophy have similar incidence and in our study the findings are comparable if not similar [15].This study and various other studies as given in Table 4 have shown low turnover renal osteodystrophy to be one of the predominant sub-type. However adynamic bone disease was the lowest in the study by Faugere [23] and Malluche [15].
Table 4.
Comparison of the various studies based on bone marrow biopsy along with our study
| Normal (%) | Low-turnover ODS (%) | Mixed Uremic ODS (%) | Hyperparathyroid bone disease (%) | |
|---|---|---|---|---|
| Faugere et al. [23] | – | 16.35 | 54.54 | 29.09 |
| Sherrard et al. [27] | – | 53.66 | 6.9 | 39.37 |
| Coen et al. [14] | 13.1 | 21 | 63.1 | 2.6 |
| Shin et al. [12] | 8.6 | 34.8 | 12.1 | 42.8 |
| Coen et al. [17] | N | 21.5 | 63.2 | 2 |
| D | 14 | 28 | 57 | |
| Spasovski et al. [9] | 32 | 35 | 18 | 9 |
| Kazama [16] | – | 38.6 | 18.6 | 42.6 |
| Present study | 3 | 3 | 50 | 43.75 |
N Non-Dialysis, D dialysis
There were 81.25% (26/32) pre-dialysis patients in the study group. The histopathology of renal osteodystrophy in patients with predialysis chronic renal failure is less known than in dialysis patients, mainly because of lack of skeletal symptoms in these patients and a less definite indication for a bone biopsy.
The lone case of ABD in the present study had normal PTH but deranged KFT levels. He was a diagnosed case of Diabetes with hypertension with coronary artery disease on regular follow up, cause of nephropthy being unknown.
Most reports on ABD deal with dialysis patients. However, Cohen Solal reported on ABD type in predialysis stage as a consequence of treatment with calcidiol and consequent increase in calcitriol serum levels [24]. Hutchison [25] and Hernandez [26] published studies and in both series, patients with ABD had lower levels of intact PTH compared to the other groups. However the patients in both studies were on calcium carbonate for control of serum phosphate. Therefore, the occurrence of a relatively high percentage of ABD in these series might not be correspondent to the natural prevalence of ROD in uraemic patients on conservative treatment and might probably be assigned to a relative suppression of PTH secretion due to calcium containing phosphate binders, resulting in a more frequent emergence of the ABD pattern.
The study population in our group has more of pre-dialysis than dialysis. This might be the reason why the findings correlate more with that of Coen [17] predialysis group that showed MUO to be more prevalent than the HYt group. Differences in dietary habits, sun exposure or genetic predisposition, treatment being received in the nephrology OPD (e.g. Calcium carbonate) may be the potential explanatory factors of the slightly lower HPT group [9].
Normal histology has also been also documented in similar studies by Coen [14], Shin [12] and Spasvoski et al. [9] The finding by Shin as the lowest group in the study was comparable.
The difference in the spectrum of ROD reported by the various study groups could be due to the difference in the criteria for patient recruitment (selected vs unselected populations), cohort size, genetic and dietary factors, referral rates and use of phosphate binders.
Morphometry of the bony trabeculae revealed that the percentage of bone area showed significant correlation with the histological type. The mean bone area was 42.43% in the MUO while it was 24.01% in the HPT group. The previous studies did not find any correlation between the bone area and the histological groups except the study by Shin [12] who found that there was a significant correlation between the low turnover (adynamic) and the high turnover group(HPT and MUO). They however could not find any correlation between the MUO and HPT group based on the bone area. The osteoid area was higher in the MUP group than that of the HPT. This finding is similar to the findings by Sherrard [27], Shin [12] and Sposvoski et al. [9] where the mean osteoid percentage was almost more than double the osteoid of hyperparathyroid bone disease.
Therapeutic Implications of knowing the different types of ROD are as follows:- in case of severe hyperparathyroidism with marked bone marrow fibrosis, aggressive treatment with IV calcitriol at high doses is indicated. In patients with MUO, Vitamin D analogs are to be given. Low turnover patients require a reduction in therapy aimed at suppression of PTH using Phosphate binders and avoidance of vitamin D over treatment [15].
Conclusion
A bone marrow biopsy should be carried out in CKD-MBD patients when the clinical symptoms and the biochemical parameters are not conclusive. Also, because of the complexity of the disease, the biochemical parameters do not definitely predict the bone histology. Thus a biopsy in patients with unexplained bone pain/fracture, unexplained hypercalcemia and elevated phosphate levels and suspected aluminum related bone disease should be conducted so as to guide the proper management of the CKD-MBD patients.
Compliance with Ethical Standards
Conflict of interest
There is no conflict of interest regarding the manuscript and the study was cleared by the ethical committee of the institute and was conducted under the guidance of the said co- authors.
Informed Consents
Informed consents were taken from the patients included in the study (A blank form enclosed along with the manuscript).
Contributor Information
Khuraijam Bembem, Email: bemkhuraijam@gmail.com.
Tejinder Singh, Email: tsinghmamc54@gmail.com.
Narinder Pal Singh, Email: nanu_singh@yahoo.com.
Alpana Saxena, Email: alpanasaxena@hotmail.com.
Shyama Lata Jain, Email: jainshyama@gmail.com.
References
- 1.KDOQI Clinical practice guidelines for chronic kidney disease: evaluation, classification, and stratification. Part 4. Definition and Classification of stages of Chronic Kidney Disease [Internet]. 2000 [Cited 2012 Feb 20] Available from: http://www.kidney.org/professionals/kdoqi/guidelines_ckd/p4_class_g1.htm
- 2.Eknoyan G, Lameire N, Barsoum R, Eckardt KU, Levin A, Levin N, Locatelli F, MacLeod A, Vanholder R, Walker R, Wang H. The burden of kidney disease: improving global outcomes. Kidney Int. 2004;66:1310–1314. doi: 10.1111/j.1523-1755.2004.00894.x. [DOI] [PubMed] [Google Scholar]
- 3.Sherrard DJ. Aplastic bone: a nondisease of medical progress. Adv Ren Replace Ther. 1995;2:20–23. doi: 10.1016/S1073-4449(12)80068-9. [DOI] [PubMed] [Google Scholar]
- 4.Sherrard DJ, Herez G, Pei Y, Segre G. The aplastic form of renal osteodystrophy. Nephrol Dial Transplant. 1996;11(suppl 3):29–31. doi: 10.1093/ndt/11.supp3.29. [DOI] [PubMed] [Google Scholar]
- 5.Pei Y, Herez G, Greenwood C, Segre G, Manuel A, Saiphoo C, Fenton S, Sherrard D. Risk factor for renal osteodystrophy: a multivariant analysis. J Bone Miner Res. 1995;10:149–156. doi: 10.1002/jbmr.5650100121. [DOI] [PubMed] [Google Scholar]
- 6.Malluche HH, Ritz E, Lange HP, Kutschera J, Hodgson M, Seifert U, Schoeppe U. Bone histology in incipient and advanced renal failure. Kidney Int. 1976;9:355–362. doi: 10.1038/ki.1976.42. [DOI] [PubMed] [Google Scholar]
- 7.Hamdy NAT, Kanis JA, Beneton NC, Brown CB, Juttmann JR, Jordans GM, Josse S, Meyrier A, Lins RL, Fairey IT. Effect of alfacalcidol on natural course of renal bone disease in mild to moderate renal failure. BMJ. 1995;310:358–363. doi: 10.1136/bmj.310.6976.358. [DOI] [PMC free article] [PubMed] [Google Scholar]
- 8.Trueba D, Sawaya BP, Mawad P, Malluche HH. Bone biopsy: indications, techniques and complications. Semin Dial. 2003;16:341–345. doi: 10.1046/j.1525-139X.2003.160631.x. [DOI] [PubMed] [Google Scholar]
- 9.Spasovski GB, Bervoets ARJ, Behets GJS, Ivanovski N, Sikole A, Dams G, Couttenye MM, De Broe ME, D’Haese PC. Spectrum of renal bone disease in end-stage renal failure patients not yet on dialysis. Nephrol Dial Transplant. 2003;18(6):1159–1166. doi: 10.1093/ndt/gfg116. [DOI] [PubMed] [Google Scholar]
- 10.Carol M, Jerry Y, Hartmut M, Rao DS, Monier-Faugere M-C, Adams E, Daramola-Ogunwuyi O, Fehmi H, Bhat S, Osman-Malik Y. Relationship between bone histology and markers of bone and mineral metabolism in African-American hemodialysis patients. Clin J Am Soc Nephrol. 2009;4(9):1484–1493. doi: 10.2215/CJN.01770408. [DOI] [PMC free article] [PubMed] [Google Scholar]
- 11.Sawaya BP, Butros R, Naqvi S, Geng Z, Mawad H, Friedler R, Fanti P, Monier-Faugere M-C, Malluche HH. Differences in bone turnover and intact PTH levels between African American and Caucasian patients with end-stage renal disease. Kidney Int. 2003;64:737–742. doi: 10.1046/j.1523-1755.2003.00129.x. [DOI] [PubMed] [Google Scholar]
- 12.Shin SK, Kim DH, Kim HS, Shin KT, Ma KA, Kim SJ, Kwak YS, Ha SK, Sherrard DJ. Renal osteodystrophy in pre-dialysis patients: ethnic difference? Perit Dial Int. 1999;19(Suppl 2):S402–S407. [PubMed] [Google Scholar]
- 13.Eastwood JB. Quantitative bone histology in 38 patients with advanced renal failure. J Clin Pathol. 1982;35:125–134. doi: 10.1136/jcp.35.2.125. [DOI] [PMC free article] [PubMed] [Google Scholar]
- 14.Coen G, Mazzaferro S, Ballanti P, Sardella D, Chicca S, Manni M, Bonucci E, Taggi F. Renal bone disease in 76 patients with varying degrees of predialysis chronic renal failure: a cross-sectional study. Nephrol Dial Transplant. 1996;11:813–819. doi: 10.1093/oxfordjournals.ndt.a027404. [DOI] [PubMed] [Google Scholar]
- 15.Malluche HH, Faugere MC. Role of bone biopsy in the management of patients of renal osteodystrophy. J Am Soc Nephrol. 1994;4:1631–1642. doi: 10.1681/ASN.V491631. [DOI] [PubMed] [Google Scholar]
- 16.Kazama JJ, Koda R, Yamamoto S, Narita I, Gejyo F, Tokumoto A. Cancellous bone volume is an indicator for trabecular bone connectivity in dialysis patients. Clin J Am Soc Nephrol. 2010;5(2):292–298. doi: 10.2215/CJN.04150609. [DOI] [PMC free article] [PubMed] [Google Scholar]
- 17.Coen G, Ballanti P, Bonucci E, Calabria S, Costantini S, Ferrannini M, Giustini M, Giordano R, Nicolai G, Manni M, Sardella D, Taggi F. Renal osteodystrophy in predialysis and hemodialysis patients: comparison of histologic patterns and diagnostic predictivity of intact PTH. Nephron. 2002;91(1):103–111. doi: 10.1159/000057611. [DOI] [PubMed] [Google Scholar]
- 18.Quarles LD, Lobaugh B, Murphy G. Intact parathyroid hormone overestimates the presence and severity of parathyroid mediated osseus abnormalities in uremia. J Clin Endocrinol Metab. 1992;75:145–150. doi: 10.1210/jcem.75.1.1619003. [DOI] [PubMed] [Google Scholar]
- 19.Levin A, Bakris GL, Molitch M, Smulders M, Tian J, Williams LA, Andress DL. Prevalence of abnormal serum vitamin D, PTH, calcium, and phosphorus in patients with chronic kidney disease: results of the study to evaluate early kidney disease. Kidney Int. 2007;71:31–38. doi: 10.1038/sj.ki.5002009. [DOI] [PubMed] [Google Scholar]
- 20.Erslev AJ, Besarab A. The rate and control of baseline red cell production in hema-tologically stable uremic patients. J Lab Clin Med. 1995;126:283–286. [PubMed] [Google Scholar]
- 21.Fisher JW. Mechanism of the anemia of chronic renal failure. Nephron. 1980;25:106–111. doi: 10.1159/000181764. [DOI] [PubMed] [Google Scholar]
- 22.Besarab A, Levin A. Defining a renal anemia management period. Am J Kidney Dis. 2000;36:S13–S23. doi: 10.1053/ajkd.2000.19927. [DOI] [PubMed] [Google Scholar]
- 23.Faugere MC, Malluche HH. Stainable aluminum and not aluminum content reflects bone histology in dialyzed patients. Kidney Int. 1986;30(5):717–722. doi: 10.1038/ki.1986.246. [DOI] [PubMed] [Google Scholar]
- 24.Cohen Solal ME, Sebert JL, Boudailliez B, Garabedian M, Fournier A. Non-aluminic adynamic bone disease in non dialyzed uremic patients: a new type of osteopathy due to overtreatment? Bone. 1992;13:1–5. doi: 10.1016/8756-3282(92)90354-Y. [DOI] [PubMed] [Google Scholar]
- 25.Hutchison AJ, Whitehouse RW, Boulton HF, Adams JE, Mawer EB, Freemont TJ, Gokal R. Correlation of bone histology with parathyroid hormone, vitamin D3, and radiology in end-stage renal disease. Kidney Int. 1993;44:1071–1077. doi: 10.1038/ki.1993.350. [DOI] [PubMed] [Google Scholar]
- 26.Hernandez D, Concepcion MT, Lorenzo V, Lorenzo V, Martinez ME, Rodriguez A, De Bonis E, Gonzalez-Posada JM, Felsenfeld AJ, Rodriguez M, Torres A. Adynamic bone disease with negative aluminium staining in predialysis patients. Prevalence and evolution after maintenance dialysis. Nephrol Dial Transplant. 1994;9(5):517–523. doi: 10.1093/ndt/9.5.517. [DOI] [PubMed] [Google Scholar]
- 27.Sherrard DJ, Hercz G, Pei Y, Maloney NA, Greenwood C, Manuel A, Saiphoo C, Fenton SS, Segre GV. The spectrum of bone disease in end-stage renal failure—An evolving disorder. Kidney Int. 1993;43:436–442. doi: 10.1038/ki.1993.64. [DOI] [PubMed] [Google Scholar]


