Abstract
The Target of Rapamycin (TOR) is a eukaryotic serine/threonine protein kinase that functions in two distinct complexes, TORC1 and TORC2, to regulate growth and metabolism1,2. GTPases, responding to signals generated by abiotic stressors, nutrients, and, in metazoans, growth factors, play an important3, but poorly understood role in TORC1 regulation. Here, we report that, in budding yeast, glucose withdrawal, which leads to an acute loss of TORC1 kinase activity4, triggers a similarly rapid Rag GTPase-dependent redistribution of TORC1 from being semi-uniform around the vacuolar membrane to a single, vacuole-associated cylindrical structure visible by super-resolution optical microscopy. 3D reconstructions of cryo-electron micrograph images of these purified cylinders demonstrate that TORC1 oligomerizes into a higher-level hollow helical assembly which we name a TOROID (TORC1 Organised in Inhibited Domain). Fitting of the recently described mammalian TORC1 structure into our helical map revealed that oligomerisation leads to steric occlusion of the active site. Guided by the implications from our reconstruction, we present a TOR1 allele that prevents both TOROID formation and TORC1 inactivation in response to glucose withdrawal demonstrating that oligomerisation is necessary for TORC1 inactivation. Our results reveal a novel mechanism by which Rag-GTPases regulate TORC1 activity and suggest that the reversible assembly/disassembly of higher-level structure may be a new paradigm for the regulation of protein kinases.
Rapamycin is an antifungal macrolide produced by the soil bacterium Streptomyces hygroscopicus1. In vivo, rapamycin binds the proline isomerase FKBP12 and this complex subsequently engages the FKBP12-Rapamycin-Binding (FRB) domain of TOR in TORC1, but not in TORC25, resulting in steric occlusion of the active site6,7. TORC1 is dimeric, composed, in yeast, of two copies of each of four proteins: Lst8, Kog1 (the ortholog of mammalian Raptor), Tco89 (yeast specific) and either Tor1 or Tor22,8. TORC1 in mammals and fission yeast, but not in budding yeast, is regulated by the Rheb GTPase downstream of growth factor and nitrogen cues respectively3,9. TORC1 is also regulated by the Rag-family GTPases; Gtr1 and Gtr2 in yeast and RagA/B and RagC/D in mammals. GTP-loading of Gtr1 / RagA/B and GDP-loading of Gtr2 / RagC/D is associated with activation of TORC1. In mammals, this configuration of the Rags is generated when amino acids, particularly leucine and arginine, are abundant, and is thought to activate TORC1 by recruiting it to the lysosomal membrane for activation by Rheb10. The Gtrs in budding yeast are also thought to be activated downstream of amino acid signals11,12; however, the mechanism by which they regulate TORC1 activity is unclear. This is because TORC1 appears to be constitutively associated with the vacuole in this organism, and, Rhb1, the putative budding yeast Rheb ortholog plays no apparent role in TORC1 activation.
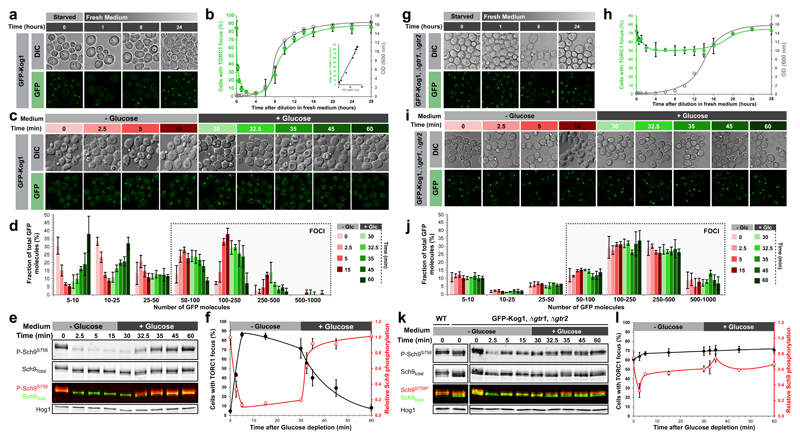
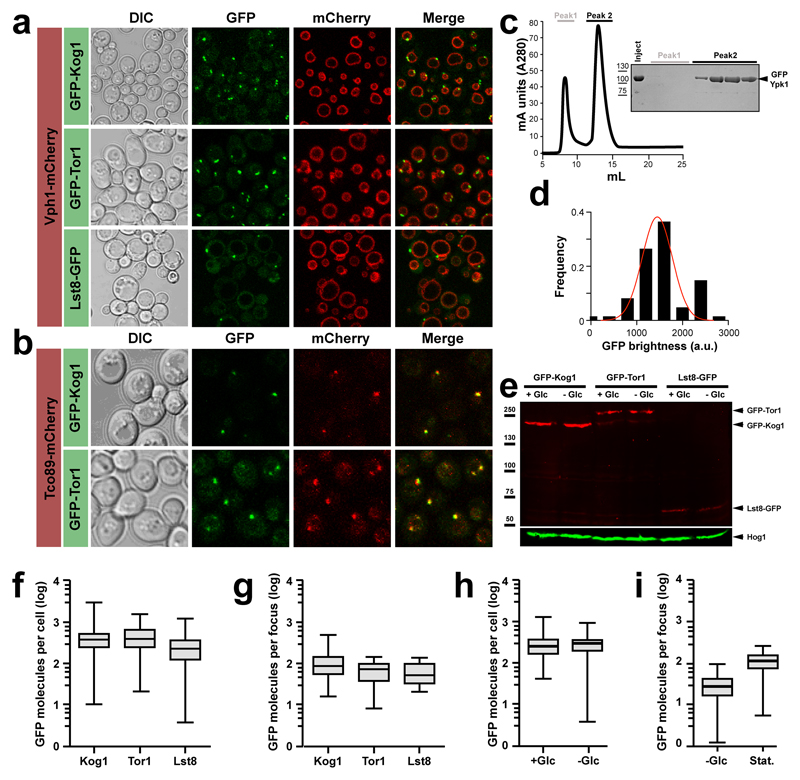
In budding yeast, fluorescent-protein tagged TORC1 subunits display either a semi-uniform granular arrangement around the vacuolar membrane or a discrete vacuolar focus (Extended data Figure 1a-b). The TORC1 focus is prominent in stationary phase cells but disperses as cells re-enter exponential growth (Figure 1a-b). Calibration of GFP signals suggests that growing cells contain ~200 TORC1s of which 80-90% enter the focus in stationary phase (Extended Data Figure 1c-i).
Figure 1. Glucose signals mediate TORC1 focus formation and activity in WT but not Δgtr1 Δgtr2 cells.
a/g, Confocal images of TORC1 (GFP-Kog1) in WT (a) and Δgtr1 Δgtr2 cells (g) following dilution of saturated cultures into fresh complete medium. b/h, Quantifications from a/g and a linear regression plot between the percentage of cells containing a focus and the optical density of the culture. c/i, Confocal images of TORC1 in WT (c) and Δgtr1 Δgtr2 (i) cells following glucose depletion and subsequent re-addition. d/j, Distribution of TORC1 focus sizes (number of GFP-Kog1 molecules) during glucose starvation / repletion from c/i. e/k, Western blot analysis of TORC1 activity (Sch9 Ser-758 phosphorylation) at the time points monitored in (c/i). Hog1 is a loading control. f/l, TORC1 activity is anti-correlated with focus formation in WT (f) but not Δgtr1 Δgtr2 (l) cells. Activity values are normalised to initial activity before glucose depletion. Data are mean ± s.d. and represent at least three independent biological experiments with at least 100 cells measured per experiment.
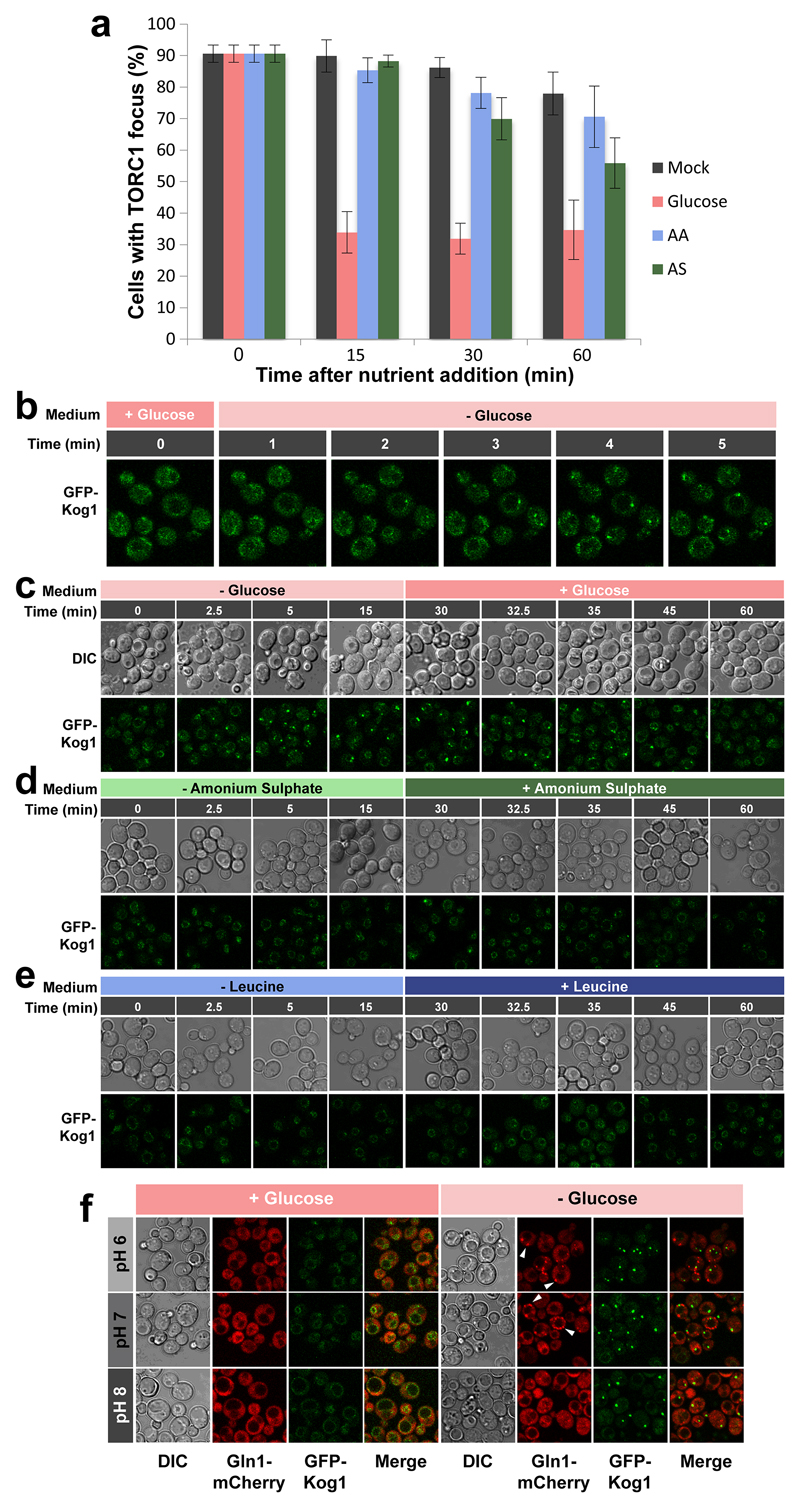
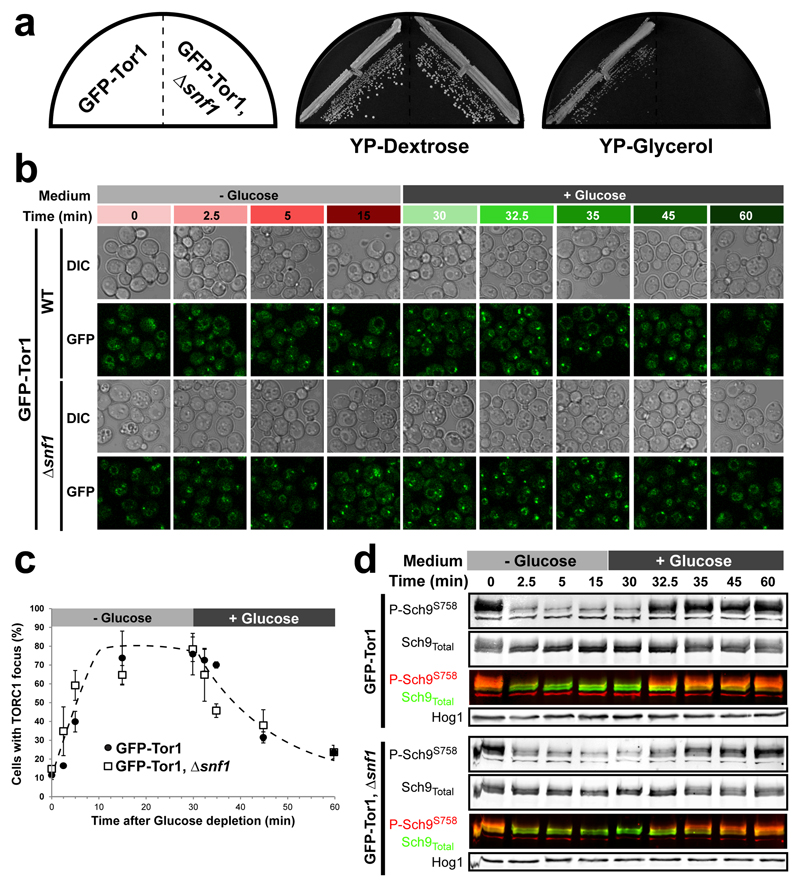
TORC1 foci have been observed before13,14 but the processes regulating their formation and function are not understood. TORC1 activity is known to be sensitive to a variety of upstream cues4 and we queried which of these influence TORC1 focus formation. The focus in stationary phase cells rapidly disassembled upon supplementation of the culture with glucose but not with other nutrients (Extended Data Figure 2a-e). Acute glucose, but not nitrogen or leucine starvation, also triggered focus formation (Figure 1c, Extended Data Figure 2a-e). Prolonged glucose starvation is known to induce focus formation of several metabolic enzymes, via a mechanism involving a drop in intracellular pH15. However, unlike Gln1, TORC1 focus formation occurred over a wide pH range (Extended Data Figure 2f). We failed to observe any obvious role for Snf114 in either TORC1 focus formation or TORC1 inactivation in response to glucose depletion (Extended Data Figure 3).
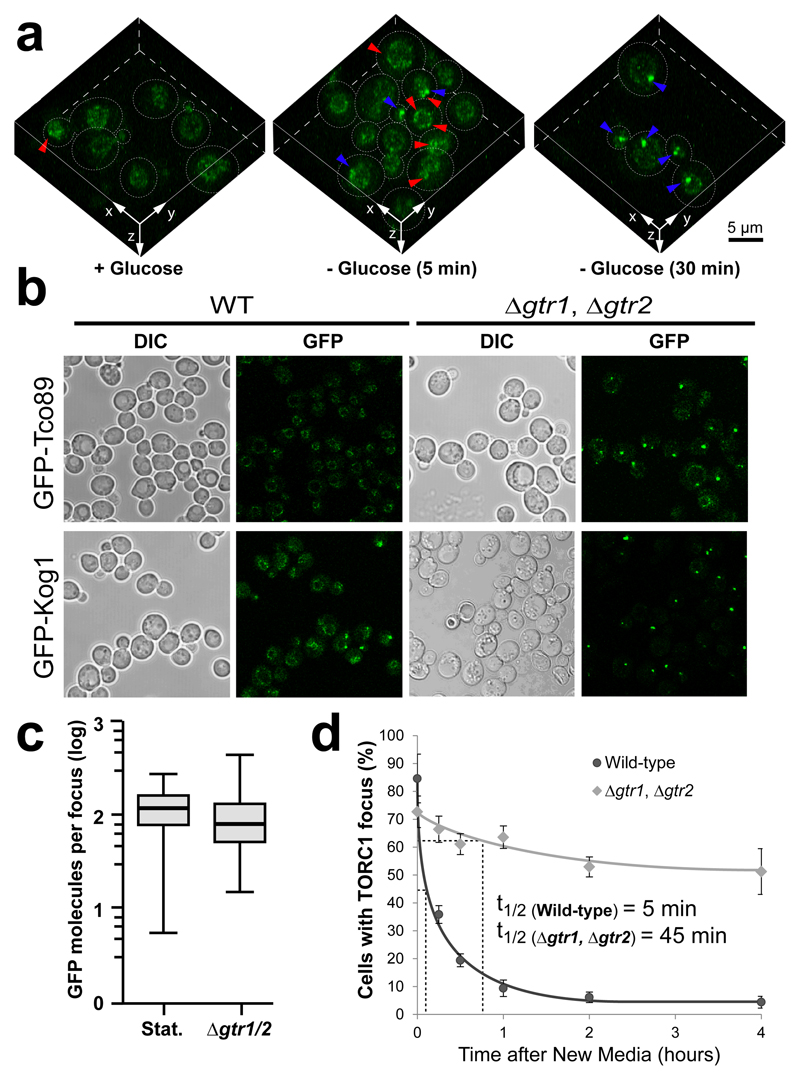
Following glucose withdrawal, TORC1 foci were apparent within 2.5 minutes (Figure 1c, Extended Data Figure 2b-c). Focus formation involved the conversion over time of diffuse TORC1 dimers into granules containing a few TORC1 dimers (typically under 25) and eventually (within five minutes) into larger assemblies containing 100 or more dimers (Figure 1D, Extended Data Figure 4a). Focus disassembly following glucose repletion was readily apparent within 10 minutes. The kinetics of TORC1 focus formation and disassembly following glucose starvation and re-addition paralleled the kinetics of TORC1 inactivation and reactivation as reflected by phosphorylation of its substrate Sch94 (Figure 1e-f). This correlation presents the interesting possibility that focus formation and disassembly may be mechanistically linked to TORC1 signalling output.
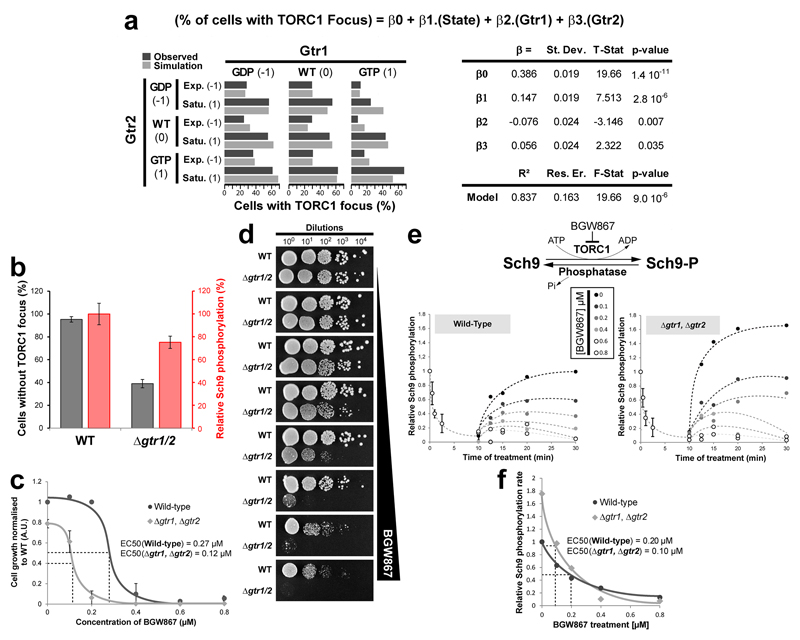
We queried whether the Gtr1-Gtr2 GTPases of the larger EGO complex16 might transmit carbon signals to TORC1. We observed that ~60% of Δgtr1 Δgtr2 cells display a single TORC1 focus regardless of growth phase of the culture (Figure 1g-h, and Extended Data Figure 4b-d). Multiple linear regression analyses demonstrated that the Gtr1GDP/Gtr2GTP conformation favours focus formation while the Gtr1GTP/Gtr2GDP conformation antagonizes focus formation (Extended data Figure 5a). In Δgtr1 Δgtr2 cells TORC1 focus dynamics is largely unaffected by either glucose starvation or repletion (Figure 1i-j; Extended Data Figure 4c-d). Sch9 phosphorylation, although affected somewhat at early time points, is also largely insensitive to glucose starvation or repletion in Δgtr1 Δgtr2 cells (Figure 1k-l). We conclude that condensation of TORC1 into a focus, downstream of Gtr1/Gtr2 nucleotide loading, is mechanistically linked to TORC1 inactivation. We note that ~40% of Δgtr1 Δgtr2 cells lack a TORC1 focus (Figure 1l), compared to ~10% of WT cells after glucose depletion (Figure 1f). Also, TORC1 dimers in Δgtr1 Δgtr2 cells are approximately twice more active than TORC1 dimers in WT cells (Extended Data Figure 5b-f), potentially due to compensatory feedback signalling17. These observations explain the curiously high levels of Sch9 phosphorylation observed in Δgtr1 Δgtr2 cells (~70% of WT; Figure 1k-l). Consistently, mTORC1 activity is similarly reduced by only ~30% in RAGA RAGB double knockout MEFs10.
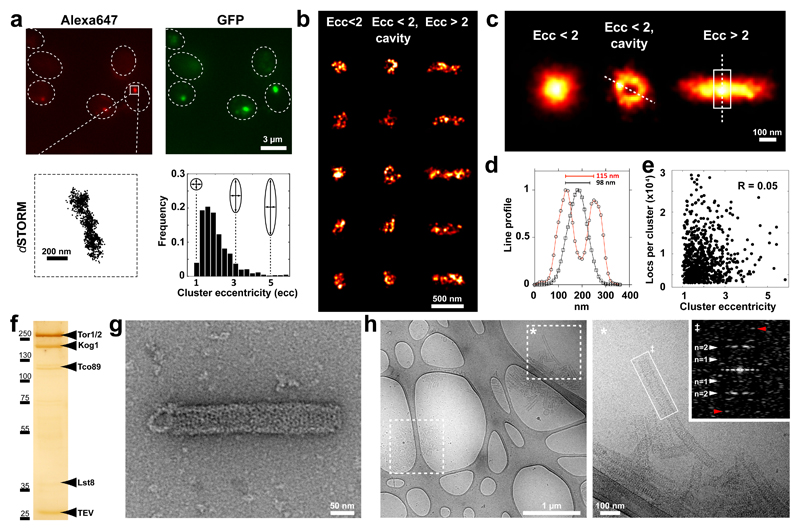
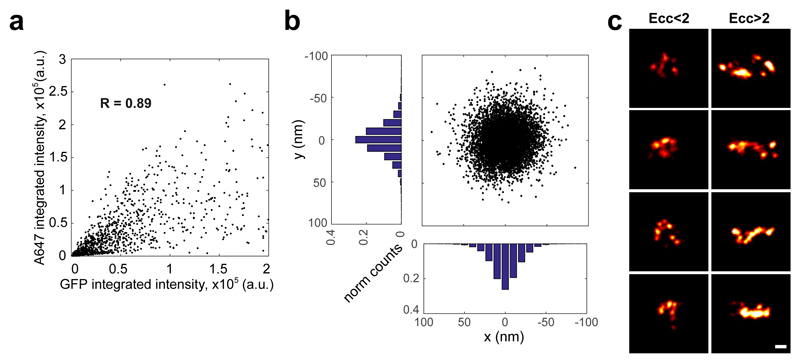
To study the organisation of TORC1 foci in vivo at the nanometer scale, we performed stochastic optical reconstruction microscopy (STORM)18–22. In reconstructed STORM images, we found sparse, as well as dense foci of cytosolic TORC1 localisations (Figure 2a, Extended Data Figure 6). The clusters revealed a variety of different shapes which we categorized based on eccentricity (Ecc; Figure 2a, lower right). In the lower eccentricity range (Ecc<2), we found a number of clusters with no apparent organisation (Figure 2b), but, also a subset of clusters featuring a ring-like shape with a central cavity (Ecc<2, cavity; Figure 2b). In the larger eccentricity range, we found primarily rod-like clusters (Ecc>2; Figure 2b). Alignment and averaging of the reconstructed ring-like particles revealed an assembly with a diameter of 115 nm and for the rod-like particles an assembly with a diameter of 98 nm and a length of about 500 nm (Figure 2c-d). We note that these values overestimate the actual dimensions due to inherent localization precision limits. A lack of correlation between the number of localisations per cluster and the cluster’s eccentricity (Figure 2e) indicates that eccentricity is not a result of heterogeneous labelling but rather arises from different orientations of the same object.
Figure 2. TORC1 foci present a regular cylindrical shape.
a-e, STORM imaging of GFP-Kog1 in Δgtr1 Δgtr2 cells. a upper row, Epi-fluorescence images from Alexa647-conjugated anti-GFP nanobody and GFP. lower left, Plot of an A647 localisation cluster obtained by STORM. lower right, Histogram of 771 STORM image clusterss containing more than 300 localisations plotted according to their eccentricity (ecc). b, Gallery of STORM cluster reconstructions classified by eccentricity and the presence of a central cavity. c, Averaged images of aligned clusters. d, Line profiles (arbitrary units) from images in c, across the circular cavity (red) and along the short axis of the rod (black). e, Correlation plot between the number of localisations and cluster eccentricity. f, Silver-stained SDS-PAGE of Kog1-TAP purification showing TORC1 subunits (and tobacco etch virus protease: TEV). g, Negative-stain electron micrograph of TORC1 oligomerised into a cylindrical structure. h, Cryo-micrographs of TORC1 tubules. Boxed areas in left micrograph contain aggregated tubules. The starred box is shown at higher magnification in the right micrograph. Inset: power spectrum of the selected tubule fragment showing layer lines corresponding to bessel order of n=1 (pitch distance) and n=2 at about 1/215 Å-1 and 1/107 Å-1, respectively. The red arrow denotes the highest layer line detected at about 1/60 Å-1.
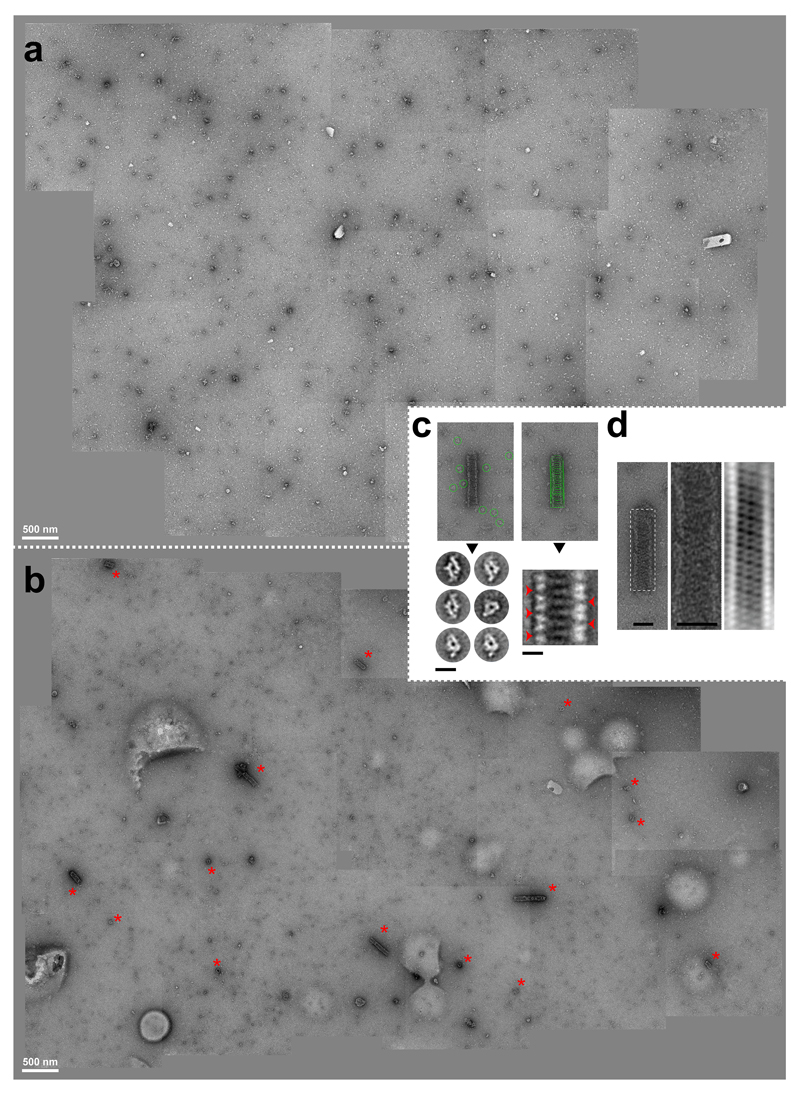
The regular nature of the foci revealed by STORM suggested that TORC1 within these domains may be potentially oligomerised into a hollow tubule. Negative-stain electron micrographs of TORC1 purified from focus-containing stationary phase cells revealed disrupted TORC1 dimers and also helical super-assemblies, approximately 60 nm wide and up to hundreds of nanometers long (Figure 2f-g). Helices were not observed in purifications from exponentially growing cells (Extended Data Figure 7). Cryo-EM micrographs (Figure 2h) confirmed the existence of helical structures with dimensions consistent with TORC1 foci observed in vivo by STORM. Fourier transform indicated that these helices present a pitch of approximately 215 Å (Figure 2h).
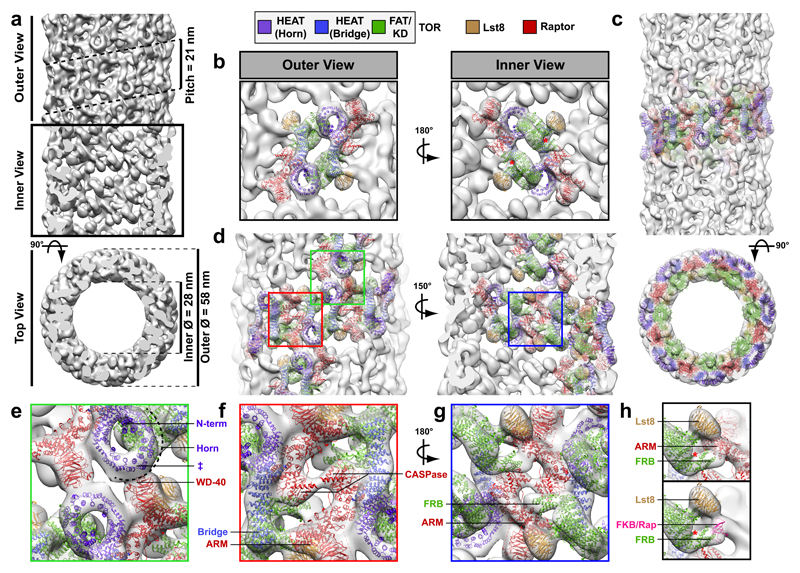
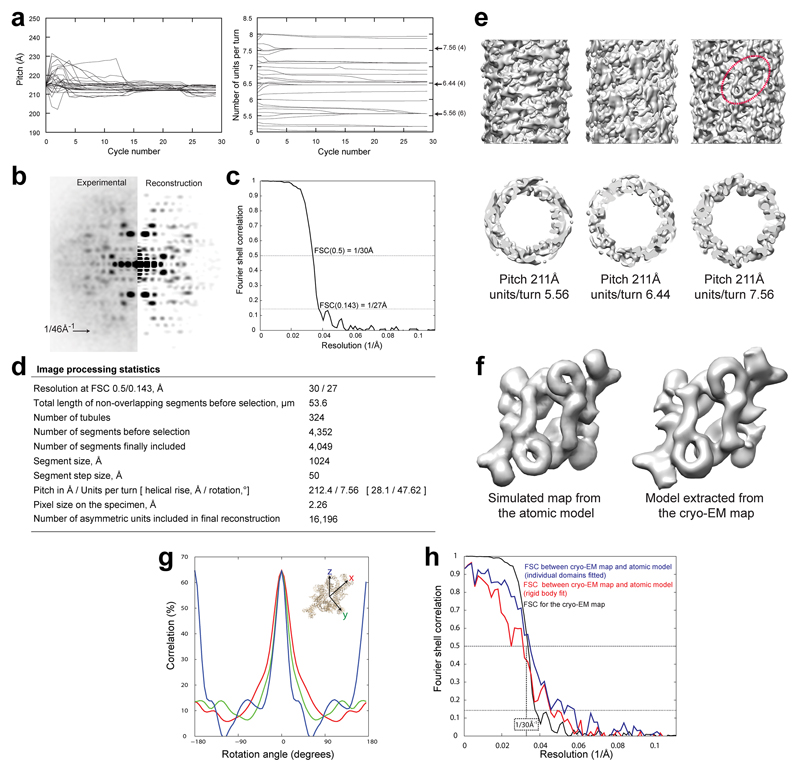
This estimate was refined and the possible values of the number of subunits per turn (helix symmetry parameters) were determined using IHRSR (Iterative Helical Real Space Reconstruction 23). Analysis of the refinement convergence points (Extended Data Figure 8a-d) followed by inspection of the three potential calculated density maps and comparison with the known structure of mammalian TORC1 (mTORC17) helped remove ambiguities yielding a structure containing 7.56 units per turn and a pitch of 212.4 Å (Extended Data Figures 8e-h). This map had a clear two fold symmetry axis perpendicular to the helix axis, which was therefore imposed for a final 3D structure refinement in SPRING (Single Particle Reconstruction from Images of kNown Geometry24). A total of 4049 segments before and 16196 segments after symmetrisation were included in the final reconstruction. This reconstruction had an estimated resolution of 27Å and the final map showed good agreement with the known mTORC1 structure (Figure 3; Extended Data Video 1; Extended Data Figure 8). Simulated STORM data based on the structure of this helix also corresponded well with our experimental STORM data (Extended Data Figure 9). Collectively, these observations support the conclusion that in vivo TORC1 foci correspond to large hollow helices.
Figure 3. TORC1 Oligomerised in Inhibited Domains (TOROIDs).
a, 3D TOROID reconstruction at 27 Å resolution. b, Outer and Inner views of the mTORC1 fitted into the TOROID map. c, Nine consecutive mTORC1 protomers fitted into the TOROID map. d, Overview of mTORC1 protomer contact interfaces. e-g, Zoom in of contact interfaces depicted in d (red, green and blue squares). e, Inter-coil interface between the Horn of TOR and the WD40 repeat of Raptor. Approximate locations, according to Baretic et al. 25, of the N-terminus (N-term) and residue 330 of Tor1 (ǂ) are indicated; c.f. GFP-insertions in Figure 4. f, Intra-coil interfaces between adjacent CASPase domains of Raptor, and the armadillo repeat (ARM) of Raptor and the Bridge of TOR. g, Intra-coil interface between the FRB domain of TOR and ARM of Raptor. h, In a TOROID the ARM domain of Raptor occludes the TOR kinase cleft similarly to FKBP12-Rapamycin.
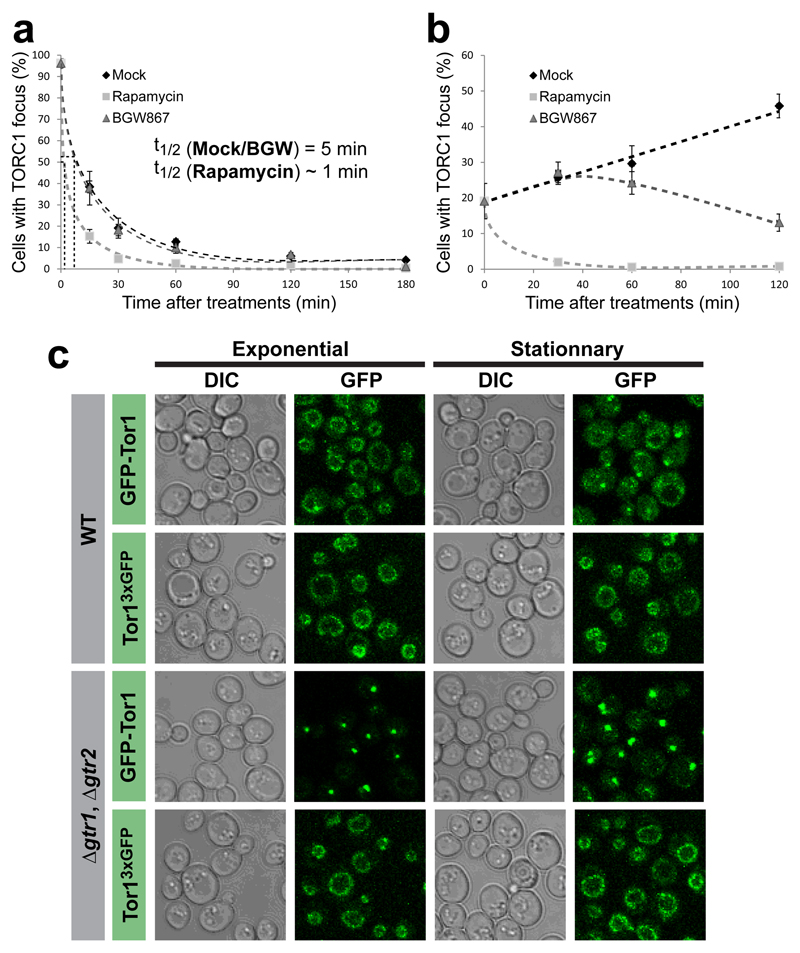
The TORC1 helix (EMD-3814) has an outer diameter of 58nm, and an inner diameter of 28nm (Figure 3a); and, this, to our knowledge, is both the largest cytosolic protein helix and the helix composed of the largest individual subunits (~1.2 MDa) characterised to date. The resolution was sufficient to allow us to fit the recent ~6 Å resolution reconstruction of mTORC17,25 which revealed several important structural insights (Figure 3b-h and, Extended Data Video 1; Extended Data Figure 8g). Raptor/Kog1 plays a key role in the packing of TORC1 dimers into the helix, supporting TORC1 interactions both between coils and within a coil. Inter-coil interactions are maintained via binding of the WD-40 repeats of Raptor/Kog1 with the HEAT repeats / HORN domain (also known as the Spiral domain)25 of mTOR/Tor1,2 in TORC1 dimers (Figure 3d-e). Intra-coil interactions are mediated via i) a homo-interaction of the CASPase domain of Raptor/Kog1, specifically the face opposite the putative TOS-binding “active” site7 (Figure 3d, f-g); ii) an interaction between the armadillo repeats of Raptor/Kog1 with the adjacent HEAT repeats / BRIDGE domain of mTOR/Tor1,2 (Figure 3d, f-g); and, iii) and an interaction between the armadillo repeats of Raptor/Kog1 with the adjacent FRB domain of mTOR/Tor1,2 (Figure 3h). This interface is intriguing, as the positioning of the armadillo repeats is identical to the volume occupied by FKBP12-rapamycin when bound to TOR7. Treatment of cells with rapamycin, but not with a small-molecule ATP-competitive TORC1 inhibitor BGW867, accelerated the disassembly of TOROIDs in stationary cells treated with fresh medium as well as those existing in late log phase cells beginning to enter stationary phase (Extended data Figure 10a-b). These results demonstrate that the FRB domain is important for helix formation and suggest that TORC1, when oligomerised into a helix, is inactive. Based on these observations and those below, we propose to call these TORC1 foci TOROIDs for TORC1 Oligomerised in Inhibited Domains.
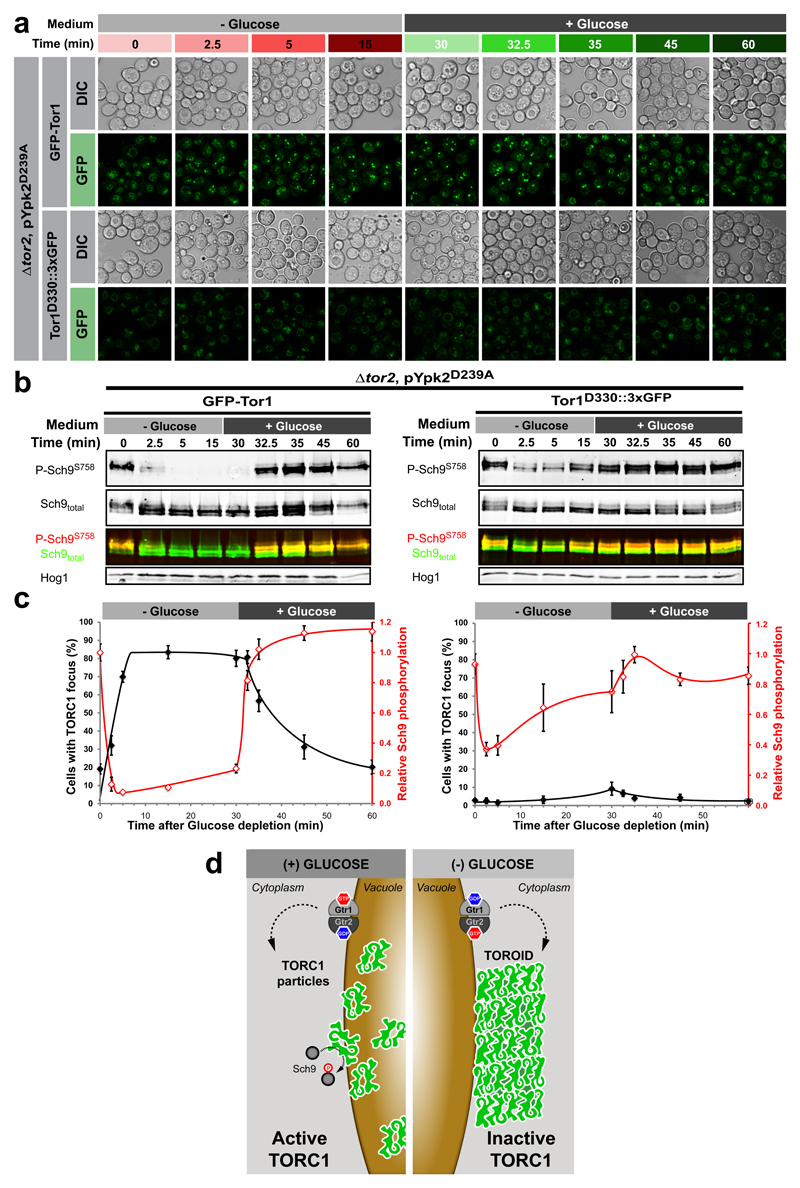
The above results lead us to propose that inactivation of TORC1 upon glucose starvation necessarily requires TOROID assembly. To confirm this model we sought an allele of a TORC1 subunit wherein the encoded protein would compromise TOROID formation but not kinase activity. In cells expressing this allele, Sch9 phosphorylation should be insensitive to glucose signals. We chose a previously described allele of TOR1 in which a sequence encoding 3xGFP was inserted into the HORN domain of Tor1 following residue Glu33026 which should compromise a critical inter coil interaction but not TORC1 activity. Indeed, both WT and Δgtr1 Δgtr2 cells expressing TOR1D330::3xGFP failed to assemble TOROIDs (Figure 4a, c and Extended Data Figure 10c) and to robustly down regulate Sch9 phosphorylation (Figure 4b-c) upon glucose starvation. In contrast, cells expressing N-terminally tagged GFP-Tor1, which should not interfere with TOROID formation (Figure 3e), showed WT regulation of both TORC1 foci formation and activity (Figure 4a-c). We conclude that glucose-derived signals regulate TOROID formation and consequently TORC1 activity.
Figure 4. TORC1-TORC1 contact interfaces are necessary for TOROID formation and proper TORC1 regulation.
a, Confocal images of TORC1 in GFP-TOR1 Δtor2 pYPK2D239A or TOR1D330::3xGFP Δtor2 pYPK2D239A cells following glucose depletion and subsequent re-addition. b, Western blot analyses of TORC1 activity at the time points monitored in (a). c,TORC1 activity is anti-correlated with focus formation in GFP-TOR1 but not TOR1D330::3xGFP expressing cells. Data are mean ± s.d. and represent at least three independent biological experiments with at least 100 cells measured per experiment. d, Cartoon illustrating TORC1 regulation downstream of glucose signals via reversible helical assembly.
Helical reconstruction is a powerful method to obtain structural information27. In our case the reconstructed 3D structure of the TOROID helix provides a new and unanticipated mechanistic explanation for the acute regulation of TORC1 activity downstream of glucose signals (Figure 4d). How the Rag GTPases regulate TOROID assembly and disassembly is presently mysterious; we eagerly await structures of the Rag GTPase bound TORC1/TOROID to solve this mystery. In the previously published crystal structure of the mammalian TOR kinase domain6 it was postulated that this kinase is constitutively in an active conformation; yet it is well established that TORC1 kinase activity is altered in response to a variety of upstream stimuli in vivo. Inhibition of TORC1 activity through oligomerisation into TOROIDs provides an elegant explanation for this conundrum. We note that casein kinase 2 activity also appears to be regulated through oligomerisation 28 suggesting that this mode of regulation may be common amongst kinases, and potentially other metabolism-related enzymes15. Finally, we speculate that the large dimeric structure of TORC1, and perhaps TORC2, was selected during evolution to facilitate their oligomerisation and consequent inactivation. Compared to degradation, this represents a cost effective way to inactivate a biosynthetically expensive multiprotein complex. Through its recruitment of FKBP12, the natural product rapamycin seems to usurp this endogenous inactivation mechanism to achieve TORC1 inhibition (Figure 3h) explaining the apparent inability of yeast to acquire resistance to rapamycin.
Methods
Yeast strains
All strains used are described in Supplementary Information Table 1.
Cell culture assays & confocal microscopy
Saturated cell cultures (28 h at 30 °C in liquid complete synthetic medium (CSM)) were diluted into fresh CSM at OD600 0.25 or nutrients were added to the saturated cultures. Confocal Z-stack images (LSM700, Zeiss) and OD600 measurements were acquired at the relevant time points (Figure 1a, g; Extended data Figure 1).
Glucose, ammonium sulphate and leucine starvation experiments were performed similarly. Cells grown at 30 °C in liquid CSM were harvested at OD600 1.5-1.8 and were subsequently filtered and transferred to starvation medium (CSM-glucose, CSM-ammonium sulphate or CSM-leucine). Nutrients were added after 30 min of starvation. Confocal Z-stack images (LSM700, Zeiss) and aliquots for western analyses were taken simultaneously at the relevant time points.
Drug treatment assays (Rapamycin [200 nM final concentration] / BGW867 [800μM final concentration] or as indicated) were performed at two states of culture growth. BGW867 functions similarly to the ATP-competitive TOR inhibitor NVP-BHS34529. The first state corresponded to saturated cells diluted into fresh CSM containing either drug or drug vehicle. The second state corresponded to cells exiting exponential phase, to which a drug or drug vehicle was added. Confocal Z-stack images (LSM700, Zeiss) were acquired at the relevant time points (Extended data Figure 10A-B).
In microfluidics experiments, cells growing exponentially in liquid CSM at 30 °C were deposited on Concanavalin A-coated channel μ-slides VI0.4 (ibidi), flushed twice with starvation medium (CSM-glucose) and imaged by confocal time-series Z-stacks. The entire procedure was carried out under constant temperature (30 °C; Extended Data Figure 2b).
To pH the medium, CSM was buffered either with 100 mM citrate buffer (pH 6), 100 mM Sorensen buffer (pH 7) or 100 mM phosphate buffer (pH 8). Cells were filtered and transferred to starvation medium (CSM-glucose) at the corresponding locked pH. Confocal Z-stack images (LSM700, Zeiss) were acquired before and after glucose starvation, in all conditions (Extended Data Figure 2F).
All confocal images presented in the main and extended data are maximum projections of 3-5 images within a Z-stack (ImageJ). Z slices were initially separated by 500 nm.
Western blot analysis
Yeast cultures were treated following standard TCA-Urea extraction procedures. Protein lysates were loaded on a 7.5% SDS-PAGE gel and transferred to a nitrocellulose membrane using the iBlot® system (ThermoFisher). The membrane was probed with primary antibodies overnight at 4 °C, washed and incubated with secondary antibodies for 45 min at RT. The membrane was developed using the Odyssey® imaging system (LI-COR) and the results were quantified using ImageStudio™ Lite (LI-COR).
Primary antibodies used were rabbit polyclonal anti-Sch9, mouse monoclonal anti-P-Sch9S758 and polyclonal rabbit anti-Hog1 (y-215, Santa Cruz Biotechnology). Secondary antibodies used were goat anti-rabbit, IRDye 800 (Rockland) and donkey anti-mouse, IRDye 680 (LI-COR). All antibodies were used at a dilution of 1:10’000.
GFP calibration and measurements
GST-TEV-GFP-Ypk1 was expressed from the GAL4 promoter in BY4741. After 4 hours of induction, yeast was lysed in Lysis Buffer (PBS, 10% glycerol, 0.015 % CHAPS, Complete Protease Inhibitor Cocktail (Roche; 1.5 tablet/50 mL), 1mM PMSF). Purification was performed by glutathione affinity chromatography followed by Tobacco Etch Virus (TEV) protease elution. Purified GFP-Ypk1 (1.9 mg) was loaded onto a S200 10/30 column and eluted with buffer containing 100 mM Hepes pH 7.5, 150 mM NaCl, 0.5 mM DTT, 0.0004% beta-DDM. The first peak (grey) describes the void volume and the second peak (black) corresponds to GFP-Ypk1 (Extended Data Figure 1C). The protein of interest was concentrated to 0.57 mg/mL (5.4 μM).
GFP calibration was performed using purified GFP-Ypk1. Glass slides were plasma cleaned and coated with poly-L-lysine (100 µg/ml in water) for 1 h. GFP-Ypk1 protein was diluted to 50 pM in PBS and absorbed on the slides for 15 min at RT. After washing, the brightness of individual GFP-Ypk1 proteins in PBS buffer was recorded using epi-fluorescence microscopy. The images were analysed using ImageJ and the distribution of brightness values was fitted to a Gaussian distribution (Extended Data Figure 1D) used as a reference for subsequent measures of GFP molecule numbers (Figure 1d,j, Extended Data Figure 1f-i, 4c).
Quantification of TORC1 numbers in granules versus foci found through Glucose starvation/addition experiments was done using 3D reconstructions of the stack image files and a subsequent analysis of granule/focus volumes and intensities using Imaris software (Bitplane). The corresponding number of TORC1 particles was estimated using the average number of GFP molecules measured in a TORC1 focus during glucose starvation (Extended Data Figure 1i).
Preparation of labeled anti-GFP nanobodies and Single fluorophore calibration
Unconjugated anti-GFP nanobodies (GT-250, Chromotek) were diluted to 0.6 mg*ml–1 in 100 μl PBS (supplemented with 50 mM NaHCO3). Alexa 647 NHS ester (A20006, Life Technologies) was added at a final concentration of (150 μM) and the solution was incubated for 30 min at room temperature. 100 μl PBS was added and the solution was applied to a NAP-5 size exclusion column (GE Healthcare) pre-equilibrated with PBS. 300 μl fractions were collected and analysed by ultraviolet–visible spectroscopy (Nanodrop2000, ThermoFisher). Peak protein fractions were collected and the degree of labelling calculated. The labelled antibody fractions were stored at 4 °C until further use. Typically, labeled nanobody fractions had a concentration between 1-10 µM and a labeling ratio between 0.5 – 1.5.
Alexa647 calibration was performed using A647-conjugated anti-GFP nanobodies. Glass slides were plasma cleaned and coated with poly-L-lysine (100 µg/ml in water) for 1 h. The purified A647-conjugated nanobodies were diluted to 100 pM in PBS and absorbed on the slides for 15 min at RT. The slides were washed once and imaged under experimental dSTORM conditions. Individual localisations were detected and drift-corrected using gold fiducial markers. All localisations were aligned to the centre of mass of the respective localisation clusters (i.e. a single nanobody). All obtained aligned localization clusters were fitted using a Gaussian distribution to obtain the average localisation precisions along the x and y axis (Extended Data Figure 6).
STORM imaging
Cells grown in complete synthetic medium were fixed at the desired OD600 with 4% formaldehyde for 30 min and washed three times (10 min each) with PBS, then treated in permeabilisation and blocking buffer (PB buffer: PBS, 0.25% Triton X-100, 5% BSA) for 30 min. They were then incubated overnight at 30 °C in anti-GFP nanobody solution (PB buffer, 1 μg/mL anti-GFP nanobody-Alexa647), washed three times in PBS (10 min each) and mounted for imaging or treated further to label the cell wall with fiducials. Before imaging, the cells were deposited on glass slides coated with Concanavalin A (1 mg/mL in PBS) and centrifuged on the glass slide at 2’000 rpm for 2 min. The excess liquid was removed and replaced by the appropriate STORM buffer for imaging.
STORM imaging was performed using a recently developed flat-field epi illumination microscope that allows simultaneous imaging of a large number of cells (typically between 50 and 200 per field of view30). Briefly, a 642 nm laser (2RU-VFL-P-2000-642-B1R, MPB Communications) was used to switch off Alexa 647 fluorophores on the sample as well as to take the pre-STORM widefield image. A 405 nm laser (OBIS, Coherent) was used to control the return rate of the fluorophores to the emitting state. A 488 nm laser (Coherent Sapphire) was used to acquire the pre-STORM widefield GFP image to segment only localizations that overlap with the bright GFP signal (Figure 2A). A custom dichroic (ZT405/561/642/750/850rpc, Chroma) reflected the laser light and transmitted fluorescence emission before and after passing through the objective (CFI60 PlanApo Lambda Å ~ 60/NA 1.4, Nikon). After passing the respective filter (ET700/75M, Chroma or ET510/20m, Chroma), emitted light from the sample was imaged onto a sCMOS camera (Zyla 4.2, Andor). Axial sample position was controlled using the pgFocus open hardware autofocus module (http://big.umassmed.edu/wiki/index.php/PgFocus). 20,000 frames at 10 ms exposure time were recorded using Micromanager31. Imaging was performed using an optimized STORM buffer as described previously32. Image stacks were analyzed using a custom CMOS-adapted analysis routine33. Lateral sample drift was corrected using either image correlation (Thunderstorm34 or gold fiducial markers [B-Store, https://github.com/kmdouglass/bstore]). We observed comparable results for both methods (data not shown). Fiducial marker labelling was performed as described previously35. Immunostained cells, mounted on the glass slide, were incubated for 30 min with a Concanavalin A-biotin conjugate (2 mg/mL in PBS, Sigma), washed once with PBS and subsequently incubated in a streptavidin-100 nm gold particle solution (1:30 in PBS, Cytodiagnostics) for 30 min. Finally, the cells were washed twice in PBS. All localization processing was performed in Matlab (Mathworks). STORM images were reconstructed using a 2D histogram (bin size 10 nm/pxl) function with a Gaussian blurring according to the localization precision (Figure 2a-e; Extended Figure 6).
Purification of TORC1 tubules
TORC1 tubules were prepared through pull-down of Kog1-TAP (Figure 2f) or Tco89-TAP (Data not shown) from yeast extracts with IgG-coupled magnetic beads (Dynabeads® M-270 Epoxy, ThermoFisher). Beads were washed in Extraction buffer lacking protease inhibitors and subsequently eluted in this buffer with Tobacco Etch Virus (TEV) protease, similarly to what was described by Gaubitz et al.36.
Negative stain and Cryo-Electron microscopy (EM)
Negative stain EM was performed with samples stained with 2% uranyl acetate. Micrographs were collected using a FEI TECNAI G2 Sphera microscope operated at 120 kV at a nominal magnification of 10,000 (Extended Data Figure 7a,b) or 29,500 (Figure 2g, Extended Data Figure 7c,d).
Protein samples were adsorbed for about 1 min onto Lacey carbon film grids (300 microMesh) and blotted with a filter paper (Whatman) as previously described in Guichard et al.37 and plunged quickly in liquid ethane using a homemade plunging apparatus. Cryo-EM images of TORC1 filament were recorded using a Field Emission Gun transmission electron microscope Tecnai F 20 (FEI Eindhoven, The Netherlands) equipped with a cryo-specimen grid holder Gatan 626 (Warrendale, PA). Images were acquired at 200 kV and at a nominal magnification of 50,000 in a defocus range of 2.5 to 3.5 µm using an Eagle camera (4096 * 4096 pixels and 2.26 Å final pixel size; Figure 2h).
3D Helix Reconstruction from Cryo-Electron Micrographs
After an initial estimation of the helix pitch in the TORC1 filaments, we performed a large range search for the number of units per turn to establish the full helix symmetry parameters, as follows. Several 678 Å wide and at least 2300 Å long sections in the images of TORC1 filaments were extracted using e2helixboxer.py in EMAN2 package38, after aligning the filament axis with the y-axis of the micrograph. Those segments were then padded and floated into a 4628 * 4628 Å box (2048*2048 pixel) and the computed Fourier transform (FT) examined. Bshow in Bsoft package was used to measure the positions of and the amplitude maxima in the visible layer lines. Although an unambiguous assignment of Bessel order was not possible for most layer lines using an approximate diameter of 560 Å for the filaments, a Bessel function of order 1 at ~1/215 Å and order 2 at ~1/107 Å was indicated, corresponding to a pitch of ~215 Å for a TORC1 helix with no symmetry parallel to the helix axis. Further refinement of helix symmetry parameters was carried out using an iterative helical real space reconstruction approach (IHRSR)39 and the final 3D structure was determined using SPRING40. For this purpose, 4352 segments of 1024*1024 Å size were excised using a regular step size of 50 Å and the images were corrected for the effect of CTF determined by using CTFFIND341.
Using a pitch of 215 Å as a starting value and a solid cylinder of 560 Å in diameter as a starting model, a set of 30 cycles IHRSR refinement was carried out wherein the number of subunits was varied from 5.1 to 7.9 in steps of 0.1. For each initial symmetry choice, the symmetry parameters were refined with the hsearch program using a step size of 0.01 Å and 0.01° for helical rise and azimuthal rotation respectively for iterations 2 to 15. For cycles 16 to 30, the steps were increased to 0.02 Å and 0.02° in order to increase the radius of convergence. The refinement of the symmetry parameters was monitored, and the convergence points analyzed given that ambiguities between certain sets of helical parameters are possible40 (Extended Data Figure 8a). For each of the different possible solutions of refined symmetry, we carried out a 3D structure refinement using the segrefined3d module in SPRING, and visually inspected the reconstructions using Chimera 42. The comparison of the density corresponding to one subunit and the known isolated mTORC1 structure43, established the correct set of helical parameters (Figure 3).
Fitting of the atomic model of mTORC143 in the reconstruction was done in Chimera, either as a rigid body, or by fitting the individual domains. For the latter, the sequential fitting command after including 5 symmetry-related neighboring TORC1 complexes was used to take into account the inter-subunit interfaces. After fitting, the domains corresponding to the central subunit were combined in a new model used for making figures in Chimera (Figure 3). To get a better insight into the docking precision, the variation of the correlation upon rotation of the rigid body model around its principal axes of inertia was plotted using the software VEDA (http://www.ibs.fr/research/research-groups/methods-and-electron-microscopy-group/schoehn-team/methodology/modeling-interpretation-of-em-maps/article/veda), the graphical version of URO44.
Extended Data
Extended data Figure 1. Stoichiometric colocalization of TORC1 subunits to a vacuole-associated focus.
a, and b, Differential interference contrast (DIC) microscopy and confocal images of yeast cells exiting exponential growth. Cells express GFP- and/or mCherry-tagged TORC1 subunits as indicated. Vph1-mCherry marks the membrane of the vacuole. We note, however, that the Lst8-GFP and Tco89-mCherry strains presented major growth phenotypes, which for Lst8 were so severe that we were unable to generate the strains necessary to assess its presumptive colocalization with other TORC1 components. c, Purification of GFP-Ypk1 used for GFP calibrations, quantifications and localisations. Left panel, Gel filtration plot showing void volume and GFP-Ypk1 monomer peaks. Right panel, Coommassie stained gel of purified fractions obtained by gel filtration. d, Distribution of single GFP brightness values calculated from GFP calibration using epi-fluorescence images of GFP-Ypk1. e, Anti-GFP western blot analysis of the GFP tagged TORC1 subunits expressed in the presence (+Glc) or absence (-Glc) of glucose. Hog1 is used as loading control. f, g, Boxplots of the number of GFP molecules per cell (f) and per focus (g) for the indicated GFP-tagged TORC1 subunits. Error bars represent s.d. for values obtained on at least 100 cells. h, Boxplot quantifying the number of GFP molecules per WT cell expressing GFP-Kog1 in the presence (+Glc) or absence (-Glc) of glucose. i, Boxplot quantifying the number of GFP molecules per focus in WT cells expressing GFP-Kog1 starved for glucose (-Glc) or grown into stationary phase (Stat.). f-i, Error bars represent s.d. for values obtained with ≥100 cells.
Extended data Figure 2. TORC1 focus formation occurs upon glucose-starvation but not nitrogen or leucine starvation independently of external pH.
a, The majority of cells grown into stationary phase display a prominent TORC1 focus as determined by confocal microscopy imaging of GFP-Kog1. Addition of glucose, but not amino acids (AA) or ammonium sulphate (AS) triggered rapid disassembly of these foci. b, TORC1 focus formation monitored by confocal microscopy using a microfluidic device demonstrates that foci can be observed within 2-3 minutes after glucose depletion. c-e, TORC1 focus formation monitored by confocal microscopy after Glucose (c), Ammonium sulphate (d), or Leucine (e) starvation and subsequent re-addition. f, Confocal images of WT cells expressing GFP-Kog1 and Gln1-mCherry grown in pH-controlled medium before (+Glucose) and 1 hour after (-Glucose) glucose starvation. White arrows show Gln1 foci.
Extended data Figure 3. Snf1 does not contribute significantly to TORC1 focus dynamics.
a, Growth phenotypes on YP-Dextrose or YP-Glycerol plates of WT and Δsnf1 cells expressing GFP-Tor1. Δsnf1 cells show a characteristic defect in using glycerol as a carbon source. b, Representative confocal images of TORC1 focus formation in WT and Δsnf1 cells following glucose depletion (-Glucose, 0 min) and subsequent re-addition (+Glucose, 30 min). c, Percentage of cells displaying a TORC1 focus as measured from (b). Data are mean ± s.d. and represent three independent experiments. d, Western blot assessing the extent of Sch9 Ser-758 phosphorylation as a proxy of TORC1 activity, at the time points monitored in (b). Hog1 is used as loading control.
Extended data Figure 4. TORC1 focus dynamics, but not size, are different in WT vs Δgtr1, Δgtr2 cells.
a, 3D reconstruction of WT cells expressing GFP-Kog1 in the presence of glucose or after 5 and 30 minutes of glucose starvation. Red arrows show granular TORC1 localisation while Blue arrows show TORC1 foci. b, Representative confocal images of exponentially growing WT and Δgtr1, Δgtr2 cells expressing the indicated GFP-tagged TORC1 subunits. c, Boxplot quantifying the number of GFP-Kog1 molecules per focus in stationary phase WT cells (Stat.) and in exponentially growing Δgtr1, Δgtr2 cells. Error bars represent s.d. for values obtained with ≥100 cells. d, Quantitative analysis of TORC1 focus disassembly after dilution of stationary phase WT (light grey) and Δgtr1, Δgtr2 (dark grey) cells expressing GFP-Kog1 into fresh complete synthetic medium. Half-life of TORC1 foci in both backgrounds is indicated. Data are mean ± s.d. and represent at least three independent experiments (150-800 cells each).
Extended data Figure 5. Gtr1GDP/Gtr2GTP conformation favours focus formation while the Gtr1GTP/Gtr2GDP conformation antagonizes focus formation.
a, TORC1 focus formation (GFP-Kog1; dark grey bars on left graph) was assessed in Δgtr1 Δgtr2 cells expressing all combinations of plasmid-borne wild-type or nucleotide-locked (GDP/GTP) variants of Gtr1 and Gtr2, both in exponentially growing or saturated cultures. Using growth state [State: exponential = -1 and saturated = 1] and nucleotide loading of the Gtrs [Gtr1 and Gtr2: GDP bound = -1, WT = 0 and GTP bound =1] as variables, the data was analysed by multiple linear regression to obtain a model explaining the percentage of cells displaying a TORC1 focus (equation). The obtained model explains 83.7% of the total observed variance (R2, residual error = 16.3%) and has a high statistical significance (Fisher test, p-value < 10-5; summarized in table on right). Simulation with the model is shown (light grey bars on left graph). The model shows that contribution of both growth state and Gtrs variables are statistically significant (β1, β2 and β3: Student test, p-values < 0.05). Gtr1 and Gtr2 participate together to account for 47.3% of the variation of TORC1 focus formation and have opposing contributions, Gtr1-GTP disfavours while Gtr2-GTP favours TORC1 focus formation (β2 = -0.076 and β3 = 0.056). The rest of variation of focus formation is Gtr-independent. b-f, The amount of active TORC1 is lower, but Sch9 phosphorylation is faster, in Δgtr1, Vgtr2 cells compared to WT cells. b, Plot showing the proportion of cells without TOROIDs and the relative Sch9-phosphorylation in WT and Δgtr1, Δgtr2 cells. Sch9 phosphorylation is partially compromised in Δgtr1, Δgtr2 cells (~75% of WT and not 40% as would be suggested by the fraction of cells lacking focus) suggesting that the remaining active TORC1 entities in Δgtr1, Δgtr2 cells must be ~2-fold more active compared to the active TORC1 entities in WT cells. c, Growth curves of Δgtr1, Δgtr2 and WT cells treated with increasing concentrations of BGW867 in liquid culture, (estimated EC50: 0.12 μM and 0.27 µM respectively). d, Spot assays of WT and Δgtr1, Δgtr2 cells on increasing concentrations of BGW867. On plate, the Δgtr1, Δgtr2 cells appear to be about twice more sensitive compared to WT. e, Measures of Sch9 dephosphorylation (phosphatase activity) and rephosphorylation (TORC1 activity) rates in WT and Δgtr1, Δgtr2 cells. To first monitor dephosphorylation rates, we treated cells with 1.0 μM BGW867 and collected samples, at the indicated time points, over a period of 10 minutes for western blot analyses (0-10 min.). The remaining cells were washed and resuspended into fresh medium containing varying concentrations of BGW867. Samples, at the indicated time points, were subsequently collected over the next 20 minutes for western blot analyses (10-30 min.). f, Plot of relative Sch9 rephosphorylation rates versus increasing concentrations of BGW867 measured in WT and Δgtr1, Δgtr2 cells in panel (e). In the absence of BGW867, the rate of Sch9 rephosphorylation is 1.75 higher in Δgtr1, Δgtr2 cells than in WT. However, when released into BGW867, the rate of Sch9 rephosphorylation is more strongly affected in Δgtr1, Δgtr2 cells compared to WT (estimated EC50: 0.1 μM and 0.2 µM respectively).
Extended data Figure 6. STORM supplementary data.
a, Correlation plot between A647 and GFP integrated intensities, measured for A647-conjugated anti-GFP nanobody-labelled TORC1 foci segmented from cytosolic signal. b, Graphical representation of A647 localisation precision along x and y axes, derived from A647-conjugated anti-GFP nanobody calibration. c, Gallery of reconstructed clusters classified according to their eccentricity (Ecc < 2 and Ecc > 2). Data corresponds to TORC1 foci imaged in wild-type cells expressing GFP-Kog1 grown into stationary phase. Scale bar 100 nm.
Extended data Figure 7. Negative-stain Electron Microscopy analyses of TORC1 purification.
a-b, assembled TEM micrographs showing 50 µm2 of an negative-stained TORC1 purification from exponentially growing (a) or starved (b) Kog1-TAP expressing cells. Red stars show extended and end-on views of TORC1 helices. Scale bar 500 nm. c, 2D class averaging analyses reveal similar TORC1 single particle features and organised pattern of subunits in the tubular structures. Green circles correspond to the picked images used for 2D classification and averaging. Red arrows highlight a repeated pattern in the 2D class. Scale bar 25 nm. d, Fourier filtration of the tubular structure suggests an helical organisation. Scale bar 50 nm.
Extended data Figure 8. 3D TOROID reconstruction and comparison between the cryo-EM map and the mTORC1 atomic model.
a, Symmetry refinement of TORC1 filaments. The pitch of the helix (left), and the number of units per turn (right) were refined by 30 iterations of IHRSR using 29 different starting choices for the number of subunits per turn (5.1 to 7.9 in steps of 0.1). Numbers on the right indicate the refined solutions for the number of units per turn at the end of the refinement. For each of these solutions, the number of refinement cycles culminating in the converged solution are indicated in parentheses. b, Side-by-side display of experimental versus simulated power spectra from the 3D reconstruction. Experimental power spectrum is the sum of the power spectrum of aligned segments after projection matching. c, Resolution assessment for the TORC1 helical reconstruction determined using SPRING - the Fourier Shell correlation was computed from two reconstructions containing half of the dataset each. The resolution corresponding to the 0.5 and 0.143 cut-offs is indicated in the plot. d, Image processing statistics of the reconstruction. e, Side (upper row) and cross-section views (lower row) of the cryo-EM maps for the 3 possible refined solutions for the number of units per helix turn with helix pitch of 211Å as deduced from the analysis of the convergence points of the IHRSR refinements. The maps shown at 30Å resolution were rendered at a threshold 1.0 σ. The maps in the left and middle panel are inconsistent with the expected density profile of the TORC1 subunit from panel (f). In rightmost panel, a dashed ellipse encloses one TORC1 dimer. f, Comparison of the density models of mTORC1 dimer generated from the atomic model (pdb ID 5FLC) filtered to 27Å resolution and that extracted from the final cryo-EM map. g, Estimation of the docking precision. Shown is the correlation of the fitted model with the map upon rotation of the mTORC1 dimer around its principal axes of inertia x,y and z as indicated in the inset. h, Comparison of the cryo-EM map and electron density maps computed from the models suggests that the features of the map are in agreement with the two variants of the docked model at ~30Å resolution and confirms the resolution assessment. The FSC between the helically arranged models and the experimental cryo-EM map is shown together with the FSC used for assessing the cryo-EM map resolution.
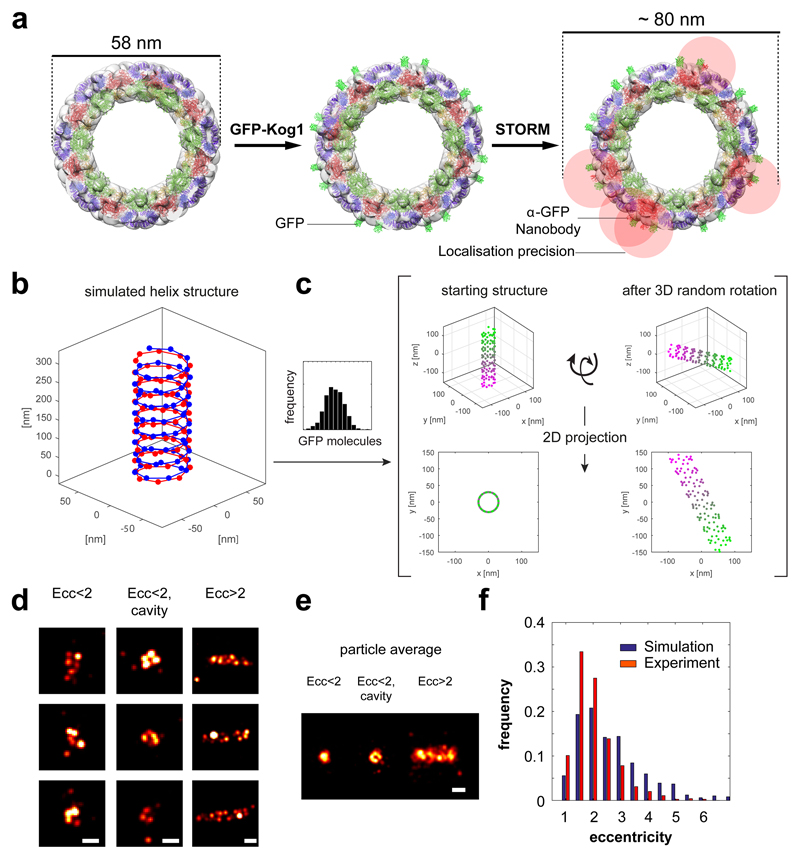
Extended data Figure 9. Simulation of STORM data using EM particle reconstruction data.
a, Left panel, End-on view of reconstructed TORC1 helix fitted with 9 TORC1 particles in dark green, dark red and purple (c.f. Figure 3). Middle panel, Crystal structure of GFP (light green) was added to the reconstructed helix at sites identified as Raptor/Kog1 N-termini. Right panel, Crystal structure of anti-GFP nanobody (red) was added to a subset of the GFP structures, according to the labelling efficiency estimated for our experimental conditions (~20%). The localisation precision is indicated as a red cloud. b, 3D representation of the simulated starting model according to a. Red and blue spheres denote GFP positions. c, Simulated STORM images. Helices of different lengths were generated based on the distribution of focus sizes observed in vivo (Figure 2 and bar graph). Orientations of these helices were randomized in 3D (XYZ) space and then projected in 2D (XY). Coloured spheres denote GFP positions, a random fraction of which were considered labeled according to our experimentally determined labelling efficiency (see SMLM simulation in Methods for more details). d, Reconstructions of individual simulations from c, classified according to their eccentricity and presence of a cavity. Scale bar 100 nm. e, Particle averages obtained from the images in d. f, Plot of the eccentricity distribution of the simulated and experimental STORM dataset.
Extended data Figure 10. Disruption of TORC1-TORC1 contact interfaces abolish TOROID assembly.
a, Quantitative analysis of TORC1 focus disassembly after dilution of stationary phase WT cells expressing GFP-Kog1 into either fresh complete synthetic medium containing rapamycin, BGW867 or drug vehicle (Mock). b, Quantitative analysis of TORC1 focus formation after treatment of late log-phase WT cells expressing of GFP-Kog1 with either rapamycin, BGW867 or drug vehicle (Mock). B and c, black diamonds represent mock treatment, grey squares rapamycin treatment (200 nM) and grey triangles BGW867 treatment (800 nM). Data are mean ± s.d. and represent three independent experiments (150-800 cells each). c, Representative confocal images of WT or Δgtr1, Δgtr2 cells expressing GFP-Tor1 or Tor1D330::3xGFP in exponential or stationary growth phases.
Supplementary Material
Acknowledgements
We thank Christoph Bauer and Jerôme Bosset at the UniGE BioImaging centre, Yann Sagon at the UniGE High Performance Computing service, Ireos Filipuzzi and Stephen Helliwell of the Novartis Institutes for BioMedical Research for BGW867 and Marina Berti for her technical assistance. We thank Takeshi Noda for kindly providing the GFP-TOR1 strain. A.D. and A.K.M. are very grateful for the contribution of NeSI high-performance computing facilities to the results of this research. NZ's national facilities are provided by the NZ eScience Infrastructure and funded jointly by NeSI's collaborator institutions and through the Ministry of Business, Innovation & Employment's Research Infrastructure programme. (https://www.nesi.org.nz). A.D. thanks the RSNZ Marsden grant to A.K.M. for support of this work. P.G. additionally acknowledges the Swiss National Science Foundation (SNSF) (PP00P3_157517). R.L. acknowledges support from the Canton of Geneva, SystemsX and project funding from the SNSF and the European Research Council Consolidator grant program. N.L.M., C.S., S.M and R.L. are greatly indebted to the National Centre for Competence in Research in Chemical Biology for its support.
Footnotes
Author contributions
M.P., C.B. and N.L.M. generated the yeast strains, performed the confocal imaging and analyses and the associated western blot analyses. M.P. and N.L.M. set up the α-GFP nanobody labelling conditions. C.S. performed the STORM acquisition, analysis and simulation and the GFP calibration with GFP-Ypk1 purification by C.B. M.P. optimized the TORC1 purifications and performed the Negative Stain Electron Microscopy (EM). P.G. and M.P. set up the cryo-EM conditions. D.D. and M.P. acquired the cryo-EM micrographs. A.D. performed the helical reconstruction and the mTORC1 fitting. R.L. and M.P. designed experiments, interpreted results, and wrote the manuscript with contributions from all authors.
The authors have no competing financial interests.
Data availability statement
Electron microscopy data are deposited at EMDB under accession number EMD-3814. Other data that support the findings of this study are available from the corresponding author upon reasonable request.
References
- 1.Wullschleger S, Loewith R, Hall MN. TOR signaling in growth and metabolism. Cell. 2006;124:471–484. doi: 10.1016/j.cell.2006.01.016. [DOI] [PubMed] [Google Scholar]
- 2.Loewith R, et al. Two TOR complexes, only one of which is rapamycin sensitive, have distinct roles in cell growth control. Molecular cell. 2002;10:457–468. doi: 10.1016/s1097-2765(02)00636-6. [DOI] [PubMed] [Google Scholar]
- 3.Saxton RA, Sabatini DM. mTOR Signaling in Growth, Metabolism, and Disease. Cell. 2017;168:960–976. doi: 10.1016/j.cell.2017.02.004. [DOI] [PMC free article] [PubMed] [Google Scholar]
- 4.Urban J, et al. Sch9 is a major target of TORC1 in Saccharomyces cerevisiae. Molecular cell. 2007;26:663–674. doi: 10.1016/j.molcel.2007.04.020. [DOI] [PubMed] [Google Scholar]
- 5.Gaubitz C, et al. Molecular Basis of the Rapamycin Insensitivity of Target Of Rapamycin Complex 2. Molecular cell. 2015;58:977–988. doi: 10.1016/j.molcel.2015.04.031. [DOI] [PubMed] [Google Scholar]
- 6.Yang H, et al. mTOR kinase structure, mechanism and regulation. Nature. 2013;497:217–223. doi: 10.1038/nature12122. [DOI] [PMC free article] [PubMed] [Google Scholar]
- 7.Aylett CH, et al. Architecture of human mTOR complex 1. Science. 2016;351:48–52. doi: 10.1126/science.aaa3870. [DOI] [PubMed] [Google Scholar]
- 8.Reinke A, et al. TOR complex 1 includes a novel component, Tco89p (YPL180w), and cooperates with Ssd1p to maintain cellular integrity in Saccharomyces cerevisiae. The Journal of biological chemistry. 2004;279:14752–14762. doi: 10.1074/jbc.M313062200. [DOI] [PubMed] [Google Scholar]
- 9.Valbuena N, Guan KL, Moreno S. The Vam6 and Gtr1-Gtr2 pathway activates TORC1 in response to amino acids in fission yeast. Journal of cell science. 2012;125:1920–1928. doi: 10.1242/jcs.094219. [DOI] [PMC free article] [PubMed] [Google Scholar]
- 10.Jewell JL, et al. Metabolism. Differential regulation of mTORC1 by leucine and glutamine. Science. 2015;347:194–198. doi: 10.1126/science.1259472. [DOI] [PMC free article] [PubMed] [Google Scholar]
- 11.Binda M, et al. The Vam6 GEF controls TORC1 by activating the EGO complex. Molecular cell. 2009;35:563–573. doi: 10.1016/j.molcel.2009.06.033. [DOI] [PubMed] [Google Scholar]
- 12.Panchaud N, Peli-Gulli MP, De Virgilio C. Amino acid deprivation inhibits TORC1 through a GTPase-activating protein complex for the Rag family GTPase Gtr1. Science signaling. 2013;6:ra42. doi: 10.1126/scisignal.2004112. [DOI] [PubMed] [Google Scholar]
- 13.Kira S, et al. Dynamic relocation of the TORC1-Gtr1/2-Ego1/2/3 complex is regulated by Gtr1 and Gtr2. Molecular biology of the cell. 2016;27:382–396. doi: 10.1091/mbc.E15-07-0470. [DOI] [PMC free article] [PubMed] [Google Scholar]
- 14.Hughes Hallett JE, Luo X, Capaldi AP. Snf1/AMPK promotes the formation of Kog1/Raptor-bodies to increase the activation threshold of TORC1 in budding yeast. eLife. 2015;4 doi: 10.7554/eLife.09181. [DOI] [PMC free article] [PubMed] [Google Scholar]
- 15.Petrovska I, et al. Filament formation by metabolic enzymes is a specific adaptation to an advanced state of cellular starvation. eLife. 2014 doi: 10.7554/eLife.02409. [DOI] [PMC free article] [PubMed] [Google Scholar]
- 16.Powis K, et al. Crystal structure of the Ego1-Ego2-Ego3 complex and its role in promoting Rag GTPase-dependent TORC1 signaling. Cell research. 2015;25:1043–1059. doi: 10.1038/cr.2015.86. [DOI] [PMC free article] [PubMed] [Google Scholar]
- 17.Eltschinger S, Loewith R. TOR Complexes and the Maintenance of Cellular Homeostasis. Trends in cell biology. 2016;26:148–159. doi: 10.1016/j.tcb.2015.10.003. [DOI] [PubMed] [Google Scholar]
- 18.Rust MJ, Bates M, Zhuang X. Sub-diffraction-limit imaging by stochastic optical reconstruction microscopy (STORM) Nature methods. 2006;3:793–795. doi: 10.1038/nmeth929. [DOI] [PMC free article] [PubMed] [Google Scholar]
- 19.Betzig E, et al. Imaging intracellular fluorescent proteins at nanometer resolution. Science. 2006;313:1642–1645. doi: 10.1126/science.1127344. [DOI] [PubMed] [Google Scholar]
- 20.Hess ST, Girirajan TP, Mason MD. Ultra-high resolution imaging by fluorescence photoactivation localization microscopy. Biophysical journal. 2006;91:4258–4272. doi: 10.1529/biophysj.106.091116. [DOI] [PMC free article] [PubMed] [Google Scholar]
- 21.Rothbauer U, et al. Targeting and tracing antigens in live cells with fluorescent nanobodies. Nature methods. 2006;3:887–889. doi: 10.1038/nmeth953. [DOI] [PubMed] [Google Scholar]
- 22.Ries J, Kaplan C, Platonova E, Eghlidi H, Ewers H. A simple, versatile method for GFP-based super-resolution microscopy via nanobodies. Nature methods. 2012;9:582–584. doi: 10.1038/nmeth.1991. [DOI] [PubMed] [Google Scholar]
- 23.Egelman EH. Reconstruction of helical filaments and tubes. Methods in enzymology. 2010;482:167–183. doi: 10.1016/S0076-6879(10)82006-3. [DOI] [PMC free article] [PubMed] [Google Scholar]
- 24.Desfosses A, Ciuffa R, Gutsche I, Sachse C. SPRING - an image processing package for single-particle based helical reconstruction from electron cryomicrographs. Journal of structural biology. 2014;185:15–26. doi: 10.1016/j.jsb.2013.11.003. [DOI] [PubMed] [Google Scholar]
- 25.Baretic D, Berndt A, Ohashi Y, Johnson CM, Williams RL. Tor forms a dimer through an N-terminal helical solenoid with a complex topology. Nature communications. 2016;7:11016. doi: 10.1038/ncomms11016. [DOI] [PMC free article] [PubMed] [Google Scholar]
- 26.Sturgill TW, et al. TOR1 and TOR2 have distinct locations in live cells. Eukaryot Cell. 2008;7:1819–1830. doi: 10.1128/EC.00088-08. [DOI] [PMC free article] [PubMed] [Google Scholar]
- 27.Egelman EH. Three-dimensional reconstruction of helical polymers. Archives of biochemistry and biophysics. 2015;581:54–58. doi: 10.1016/j.abb.2015.04.004. [DOI] [PMC free article] [PubMed] [Google Scholar]
- 28.Seetoh WG, Chan DS, Matak-Vinkovic D, Abell C. Mass Spectrometry Reveals Protein Kinase CK2 High-Order Oligomerization via the Circular and Linear Assembly. ACS chemical biology. 2016;11:1511–1517. doi: 10.1021/acschembio.6b00064. [DOI] [PMC free article] [PubMed] [Google Scholar]
- 29.Rispal D, et al. Target of Rapamycin Complex 2 Regulates Actin Polarization and Endocytosis via Multiple Pathways. The Journal of biological chemistry. 2015;290:14963–14978. doi: 10.1074/jbc.M114.627794. [DOI] [PMC free article] [PubMed] [Google Scholar]
- 30.Douglass KM, Sieben C, Archetti A, Lambert A, Manley S. Super-resolution imaging of multiple cells by optimised flat-field epi-illumination. Nature photonics. 2016;10:705–708. doi: 10.1038/nphoton.2016.200. [DOI] [PMC free article] [PubMed] [Google Scholar]
- 31.Edelstein A, Amodaj N, Hoover K, Vale R, Stuurman N. Computer control of microscopes using microManager. Current protocols in molecular biology. 2010;Chapter 14:Unit14 20. doi: 10.1002/0471142727.mb1420s92. [DOI] [PMC free article] [PubMed] [Google Scholar]
- 32.Olivier N, Keller D, Gonczy P, Manley S. Resolution doubling in 3D-STORM imaging through improved buffers. PloS one. 2013;8:e69004. doi: 10.1371/journal.pone.0069004. [DOI] [PMC free article] [PubMed] [Google Scholar]
- 33.Huang F, et al. Video-rate nanoscopy using sCMOS camera-specific single-molecule localization algorithms. Nature methods. 2013;10:653–658. doi: 10.1038/nmeth.2488. [DOI] [PMC free article] [PubMed] [Google Scholar]
- 34.Ovesny M, Krizek P, Borkovec J, Svindrych Z, Hagen GM. ThunderSTOM: a comprehensive ImageJ plug-in for PALM and STORM data analysis and super-resolution imaging. Bioinformatics. 2014;30:2389–2390. doi: 10.1093/bioinformatics/btu202. [DOI] [PMC free article] [PubMed] [Google Scholar]
- 35.Kaplan C, Ewers H. Optimized sample preparation for single-molecule localization-based superresolution microscopy in yeast. Nature protocols. 2015;10:1007–1021. doi: 10.1038/nprot.2015.060. [DOI] [PubMed] [Google Scholar]
- 36.Gaubitz C, et al. Molecular Basis of the Rapamycin Insensitivity of Target Of Rapamycin Complex 2. Molecular cell. 2015;58:977–988. doi: 10.1016/j.molcel.2015.04.031. [DOI] [PubMed] [Google Scholar]
- 37.Guichard P, Hamel V, Neves A, Gonczy P. Isolation, cryotomography, and three-dimensional reconstruction of centrioles. Methods in cell biology. 2015;129:191–209. doi: 10.1016/bs.mcb.2015.04.003. [DOI] [PubMed] [Google Scholar]
- 38.Tang G, et al. EMAN2: an extensible image processing suite for electron microscopy. Journal of structural biology. 2007;157:38–46. doi: 10.1016/j.jsb.2006.05.009. [DOI] [PubMed] [Google Scholar]
- 39.Egelman EH. Reconstruction of helical filaments and tubes. Methods in enzymology. 2010;482:167–183. doi: 10.1016/S0076-6879(10)82006-3. [DOI] [PMC free article] [PubMed] [Google Scholar]
- 40.Desfosses A, Ciuffa R, Gutsche I, Sachse C. SPRING - an image processing package for single-particle based helical reconstruction from electron cryomicrographs. Journal of structural biology. 2014;185:15–26. doi: 10.1016/j.jsb.2013.11.003. [DOI] [PubMed] [Google Scholar]
- 41.Mindell JA, Grigorieff N. Accurate determination of local defocus and specimen tilt in electron microscopy. Journal of structural biology. 2003;142:334–347. doi: 10.1016/s1047-8477(03)00069-8. [DOI] [PubMed] [Google Scholar]
- 42.Pettersen EF, et al. UCSF Chimera--a visualization system for exploratory research and analysis. Journal of computational chemistry. 2004;25:1605–1612. doi: 10.1002/jcc.20084. [DOI] [PubMed] [Google Scholar]
- 43.Aylett CH, et al. Architecture of human mTOR complex 1. Science. 2016;351:48–52. doi: 10.1126/science.aaa3870. [DOI] [PubMed] [Google Scholar]
- 44.Navaza J, Lepault J, Rey FA, Alvarez-Rua C, Borge J. On the fitting of model electron densities into EM reconstructions: a reciprocal-space formulation. Acta crystallographica. Section D: Biological crystallography. 2002;58:1820–1825. doi: 10.1107/s0907444902013707. [DOI] [PubMed] [Google Scholar]
- 45.Kira S, et al. Dynamic relocation of the TORC1-Gtr1/2-Ego1/2/3 complex is regulated by Gtr1 and Gtr2. Molecular biology of the cell. 20163;27:382–396. doi: 10.1091/mbc.E15-07-0470. [DOI] [PMC free article] [PubMed] [Google Scholar]
- 46.Sturgill TW, et al. TOR1 and TOR2 have distinct locations in live cells. Eukaryotic cell. 2008;7:1819–1830. doi: 10.1128/EC.00088-08. [DOI] [PMC free article] [PubMed] [Google Scholar]
Associated Data
This section collects any data citations, data availability statements, or supplementary materials included in this article.


