Abstract
APOE4 is the strongest genetic risk factor for late-onset Alzheimer’s disease (AD). ApoE4 increases brain amyloid-β (Aβ) pathology relative to other ApoE isoforms1. However, whether APOE independently influences tau pathology, the other major proteinopathy of AD and other tauopathies, or tau-mediated neurodegeneration, is not clear. By generating P301S tau transgenic mice on either a human ApoE knockin (KI) or ApoE knockout (KO) background, we show that P301S/E4 mice have significantly higher tau levels in the brain and a greater extent of somatodendritic tau redistribution by 3 months of age compared to P301S/E2, P301S/E3 and P301S/EKO mice. By 9 months of age, P301S mice with different ApoE genotypes display distinct p-tau staining patterns. P301S/E4 mice develop markedly more brain atrophy and neuroinflammation than P301S/E2 and P301S/E3 mice, whereas P301S/EKO mice are largely protected from these changes. In vitro, E4-expressing microglia exhibit higher innate immune reactivity following LPS treatment. Co-culturing P301S tau-expressing neurons with E4-expressing mixed glia results in a significantly higher level of TNFα secretion and markedly reduced neuronal viability compared to neuron/E2 and neuron/E3 co-cultures. Neurons co-cultured with EKO glia showed the greatest viability with the lowest level of secreted TNFα. Treatment of P301S neurons with recombinant ApoE (E2, E3, E4) also leads to some neuronal damage and death compared to the absence of ApoE, with ApoE4 exacerbating the effect. In individuals with a sporadic primary tauopathy, the presence of an ε4 allele is associated with more severe regional neurodegeneration. In Aβ-pathology positive individuals with symptomatic AD who usually have tau pathology, ε4-carriers demonstrate greater rates of disease progression. Our results demonstrate that ApoE affects tau pathogenesis, neuroinflammation, and tau-mediated neurodegeneration independent of Aβ pathology. ApoE4 exerts a “toxic” gain of function whereas the absence of ApoE is protective.
In 1993, APOE4 was identified as a strong genetic risk factor for late-onset Alzheimer’s disease2. Subsequently, a large amount of evidence has demonstrated that a major mechanism by which ApoE influences AD is via ApoE influencing Aβ deposition in both a dose and isoform-specific fashion (E4>E3>E2)1. However, there are likely other mechanisms by which ApoE influences not only AD but also other neurodegenerative diseases. A large body of evidence demonstrates that while Aβ is likely a key initiator in AD pathogenesis, its aggregation and accumulation poorly correlate with disease symptoms or tissue loss3,4. In contrast, accumulation of tau in AD brain and in primary tauopathies strongly correlates with clinical signs and neurodegeneration3–5. However, to date there is only circumstantial evidence that ApoE influences tauopathy independent of Aβ. ApoE has been shown to directly bind tau in vitro6, and neuronal expression of human ApoE in vivo results in tau hyperphosphorylation (E4>E3)7. Recent GWAS studies show a strong and significant association of APOE with CSF tau and p-tau after correcting for the effect of APOE on Aβ42 levels8. In frontotemporal dementia (FTD) patients, a large percentage of whom have tauopathy, ε4 allele frequency was reported to be significantly elevated9,10, and ε4 carriers have greater atrophy in affected brain regions11 as well as exacerbated behavioral deficits12. These data suggest that ApoE may directly influence tau pathology and tau-mediated neurodegeneration.
To determine whether the presence of ApoE or human ApoE isoforms affect tau pathology and tau-related neuropathology, we utilized a P301S tauopathy mouse model, which overexpress 1N4R human tau containing the P301S mutation that causes a form of FTD13. We generated P301S mice on either a human ApoE KI or ApoE KO background, designated as TE (Tau/ApoE) mice. We observed significantly more brain atrophy in 9-month old P301S/E4 (TE4) mice compared to P301S/E2 (TE2) and P301S/E3 (TE3) mice (Fig. 1a, b), but no change in 3-month old TE mice or 9-month old non-tau transgenic ApoE KI mice (Extended Data Fig. 1). The atrophy primarily occurred in the hippocampus, piriform/entorhinal cortex, and amygdala, and was accompanied by significant lateral ventricular enlargement (Fig. 1a, b). The granule cell layer in the dentate gyrus (DG) (Fig. 1c, d) and the pyramidal cell layer in the CA1 region (Extended Data Fig. 2) were noticeably and significantly thinner in TE4 mice, and the thickness correlated highly with hippocampal volume (Fig. 1e). Strikingly, the absence of ApoE in P301S mice (TEKO) largely attenuated neuronal loss and brain atrophy observed in P301S mice expressing human ApoE, and almost completely abolished ventricular dilatation (Fig. 1a–d). These results revealed an important role of ApoE in regulating tau-mediated neurodegeneration, with ApoE4 causing more severe damage and the absence of ApoE being protective.
Figure 1. ApoE4 exacerbates neurodegeneration in P301S mice whereas genetic ablation of ApoE is associated with less damage.
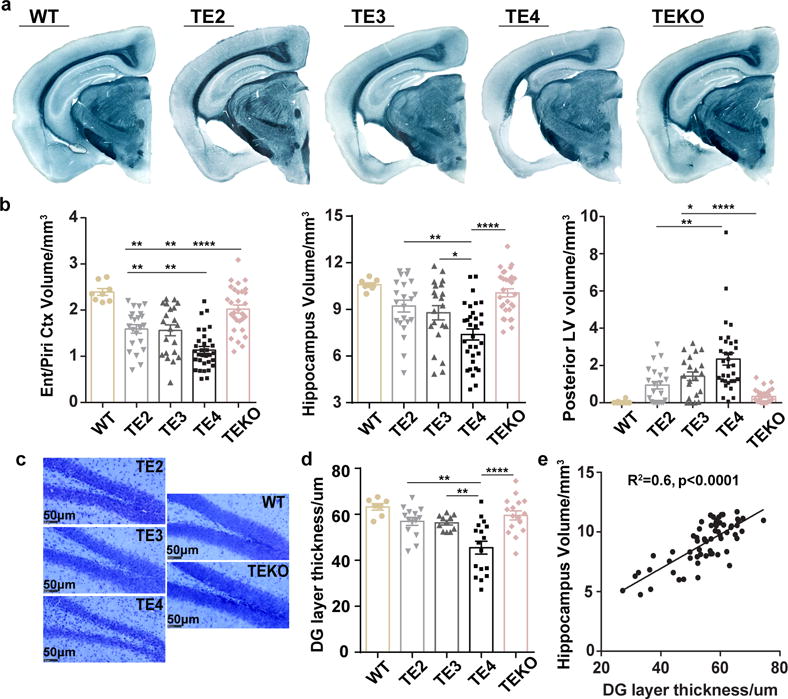
a, Representative images of 9-month old wild type (WT) and TE mouse brain sections stained with Sudan black b, Volumes of the piriform/entorhinal cortex, hippocampus, and posterior lateral ventricle in 9–10 months old WT and TE mice (WT: n=8, TE2: n=22, TE3: n=21, TE4: n=32, TEKO: n=30). c, d, Thickness of the granule cell layer of the dentate gyrus in 9-month old WT and TE mice with cresyl violet staining (WT: n=7, TE2: n=14, TE3: n=11, TE4: n=17, TEKO: n=16). e, Correlation between granule layer thickness and hippocampal volume, n=62 biologically independent animals. Pearson correlation analysis, r2=0.6, p<0.0001 (two sided). Data expressed as mean ± SEM, One-way ANOVA with Tukey’s post hoc test (two-sided) was used for all statistical analyses except Kruskal-Wallis test with Dunn’s multiple comparisons test (two-sided) was performed for posterior LV volume analysis. *p<0.05, **p<0.01, ***p<0.001, ****p<0.0001. Ent: Entorhinal cortex, Piri: Piriform cortex, LV: Lateral ventricle, DG: Dentate gyrus.
Human tau levels in brain lysates were analyzed via quantitative ELISA following sequential biochemical extraction in RAB (salt buffer), RIPA (detergent buffer) and 70% Formic Acid (FA), which contains soluble tau, less soluble tau, and highly insoluble tau respectively. At 3 months of age, prior to overt tau pathology onset, TE4 mice had significantly higher tau levels in the RAB fraction than other ApoE genotypes (Fig. 2a). At 9 months of age, when large amounts of tau pathology have developed, TE4 mice still had significantly higher tau levels, but the elevated tau had changed from being in the RAB to the RIPA fraction (Fig. 2a), indicating a greater amount of tau in a more insoluble fraction. The higher tau accumulation in TE4 mice was not due to differences in tau synthesis (Extended Data Fig. 3a). We found significant changes of autophagy-related gene expression in 9-month TE4 mice and 9-month non-tau transgenic ApoE4 knockin mice (Extended Data Fig. 3b, c), suggesting ApoE4 may affect autophagy-mediated tau clearance. This is consistent with a previous report of impaired autophagy associated with ApoE414. ApoE levels in the TE mice followed the pattern E2>E3>E4 (Extended Data Fig. 3d–e), consistent with what has been reported in ApoE knockin mice15. No major alteration of ApoE levels was observed in the presence of tau pathology. Hyperphosphorylated tau, identified by p-tau staining with the AT8 antibody, revealed a greater p-tau covered area in 3-month old TE4 mouse hippocampus (Fig. 2b). While the pathological p-tau signal first appeared in the mossy fibers, axons of DG granule cells in the hippocampus, TE4 mice also showed more intense DG cell body staining (Extended Data Fig. 4), indicating a greater redistribution of pathological p-tau from axons to cell bodies at an early age. At 9 months of age, the differences in overall p-tau immunoreactivity (IR) between TE mice decreased (Fig. 2b), with the emergence of four major p-tau staining patterns, designated as types 1–4 (Fig. 2d). These staining patterns strongly correlated with the level of brain atrophy, with type 1 associated with the most preserved brain and type 4 associated with the greatest atrophy (Fig. 2c), suggesting potential differential toxicity associated with different p-tau IR patterns. The distribution of p-tau IR patterns differed across ApoE genotypes. Type 1 and type 2 were enriched in TEKO mice whereas type 4 was enriched in TE4 mice (Fig. 2e). The featured distribution of these p-tau IR patterns, which either represent different tau structures, or progressively more advanced pathological tau stages, indicate ApoE affects either tau conformation, or tau pathology progression.
Figure 2. ApoE genotypes differentially regulate tau pathology.
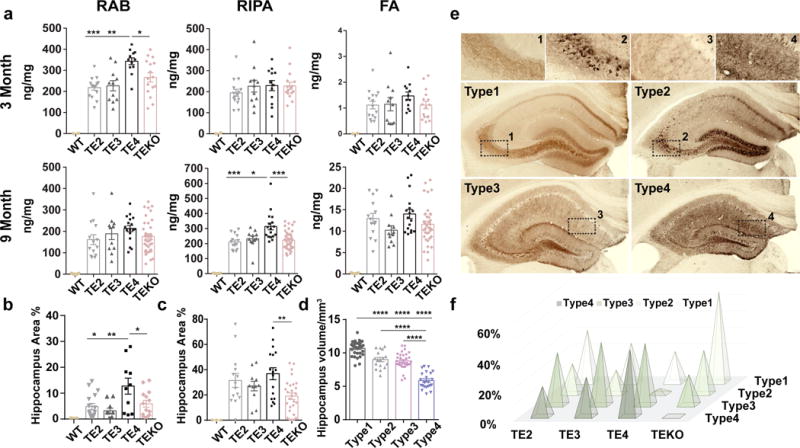
a, Human P301S tau levels in TE mice were measured by ELISA in RAB, RIPA and 70% FA fractions respectively at two time points: 3 months (WT: n=2, TE2: n=15, TE3: n=11, TE4: n=12, TEKO: n=16) and 9 months (WT: n=5, TE2: n=14, TE3: n=11, TE4: n=17, TEKO: n=38). b, P-tau (AT8) covered area in 3-month and 9-month old TE mouse hippocampus. c, P-tau staining patterns were associated with different degrees of brain atrophy, n=104 biologically independent animals. a–c, Data expressed as mean ± SEM, One-way ANOVA with Tukey’s post hoc test (two-sided). d, Four distinct p-tau staining patterns were identified based on hippocampal staining features. Type 1 has intense mossy fiber staining as well as diffuse cell body staining in the dentate gyrus granule cell layer and CA1 pyramidal cell layer; type 2 has compact and dense tangle-like cell body staining primarily in the dentate gyrus granule cells and CA3 pyramidal cells, but also has sparse staining in the CA1 region; type 3 has staining primarily in the neuropil of the stratum radiatum of the CA region with clear staining of dendrites from pyramidal neurons and only some staining in the neuronal cell bodies; type 4 has dense staining over the entire hippocampus, unlike other staining patterns, type 4 staining is fragmented, dotted, and grainy. e, Distribution of the four p-tau staining types in 9–10 months old TE mice (TE2: n=22, TE3: n=21, TE4: n=32, TEKO: n=38). Fisher’s exact test, two-sided (All groups: p=3.4e-05, TE2 vs. TEKO: p=0.021, TE3 vs. TEKO: p=0.0016, TE4 vs. TEKO: p=1.9e-07). *p<0.05, **p<0.01, ***p<0.001, ****p<0.0001.
While pathological tau may directly cause neurodegeneration, it, along with degenerating neurons, may also induce chronic neuroinflammation, which can lead to neuronal death via various mechanisms16,17. Previous studies have shown that ApoE4 is associated with higher innate immune reactivity than ApoE2 and ApoE318,19. We confirmed this result in cultured microglia with lipopolysaccharide (LPS) stimulation (Fig. 3a). This inherently higher inflammatory reactivity associated with ApoE4 may further exacerbate neurodegeneration. When we assessed microglial gene expression profiles in 9-month old TE3, TE4 and TEKO mice as well as in 9-month old non-tau transgenic ApoE KI and ApoE KO mice using a customized MG550 microglial gene chip (see Methods), we observed a marked upregulation of proinflammatory genes (cluster 1) and a concomitant downregulation of genes involved in normal cell function (cluster 2) in TE4 mice, whereas microglia in TEKO mice largely remained in a homeostatic state (Fig. 3b, c, d, Supplementary Information for pathway analysis and gene list). Consistent with this, CD68-positive microglial staining, which represents an activated state of microglia, was significantly elevated in TE4 mice, and was drastically reduced in TEKO mice (Fig. 3e, f). Notably, no pro-inflammatory gene activation and no or minimal gene expression differences were observed in 9-month old ApoE KI and ApoE KO mice in the absence of P301S tau (Fig. 3b, d, Extended Data Fig. 5a, b) or in 3-month old TE mice (Extended Data Fig. 5c, d), indicating the necessity of tau pathology to initiate microglial activation and to enable the ApoE genotype-dependent effect on microglial activation. Intriguingly, p-tau IR patterns were highly associated with the microglial activation profile, with type 1 staining displaying the lowest, type 2 and type 3 intermediate, and type 4 the strongest microglial activation (Extended Data Fig. 6), suggesting potential distinct intrinsic capacities of different p-tau patterns to induce neuroinflammation.
Figure 3. ApoE strongly modulates microglial activation.
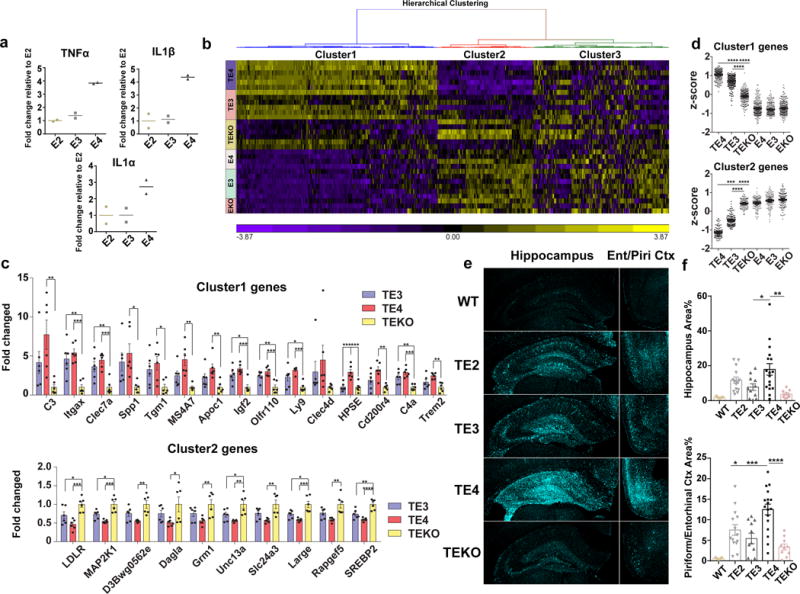
a, Cultured microglia (E2, E3, E4) derived from human ApoE KI mouse brains were treated with 1 ng/ml LPS for 24h, cytokine levels in the media were measured by ELISA (2 wells/genotype), experiment replicated 3 times. b, Nanostring analysis for microglial gene expression in 9-month old TE or EKI/EKO mouse hippocampus. Heatmap generated by hierarchical gene clustering based on genotypes (Horizontal: 534 microglial genes, vertical: individual mouse samples; TE3, TE4, TEKO, E3: n=6, E4: n=4, EKO: n=3). c, Top differentially expressed cluster1 and cluster2 genes from the heatmap (criteria: fold change TE4 vs. TEKO high to low, p-value <0.01; fold change TE4 vs. TE3>1.2). Cluster1: proinflammatory genes, Cluster2: cellular function-related genes (metabolism, signaling, transcription, etc.), Cluster3: homeostatic genes/genes below detection. d, z-score of genes from cluster 1 or cluster 2 for all groups. Kruskal-Wallis test with Dunn’s multiple comparisons test (two-sided) was performed for statistical analysis. e, f, CD68 (activated microglia) staining and quantification in 9-month old TE mice (WT: n=5, TE2: n=14, TE3: n=11, TE4: n=17, TEKO: n=10). Data expressed as mean ± SEM, One-way ANOVA with Tukey’s post hoc test, two-sided. *p<0.05, **p<0.01, ***p<0.001, ****p<0.0001.
Another key cell type in the brain, astrocytes, also play an essential role in neuroinflammation. Recent studies have identified two distinct types of reactive astrocytes in mice depending on the initiating injury: “A1” induced by LPS-elicited inflammation, and “A2” induced by ischemia20. These reactive astrocytes are defined by three cassettes of genes: A1-specifc (inflammation only), A2-specific (ischemia only), and PAN reactive (upregulated in both injuries)20. Recent data show that inflammation-induced reactive microglia produce specific cytokines (TNFα, IL1α, C1q) that can activate “A1” astrocytes, which lose many normal astrocytic functions, and secret toxic factors able to rapidly induce neuronal death16.We observed strong activation of “A1” astrocytic genes in 9-month TE4 mice, but not in 9-month TEKO mice or 3-month TE4 mice (Fig. 4a), nor in 9-month old WT and non-tau transgenic ApoE KI mice (Extended Data Fig. 7). In addition, GFAP signal was drastically elevated in 9-month old TE4 mice, but not in TEKO mice (Fig. 4b, c, e). The amount of GFAP IR highly correlated with brain volume (Fig. 4d), strongly suggesting a detrimental role of reactive astrocytes in neurodegeneration.
Figure 4. ApoE4 leads to robust astrocytic activation and promotes neuronal death in vitro whereas the absence of ApoE results in less astrocytic activation and preserves neuronal integrity.
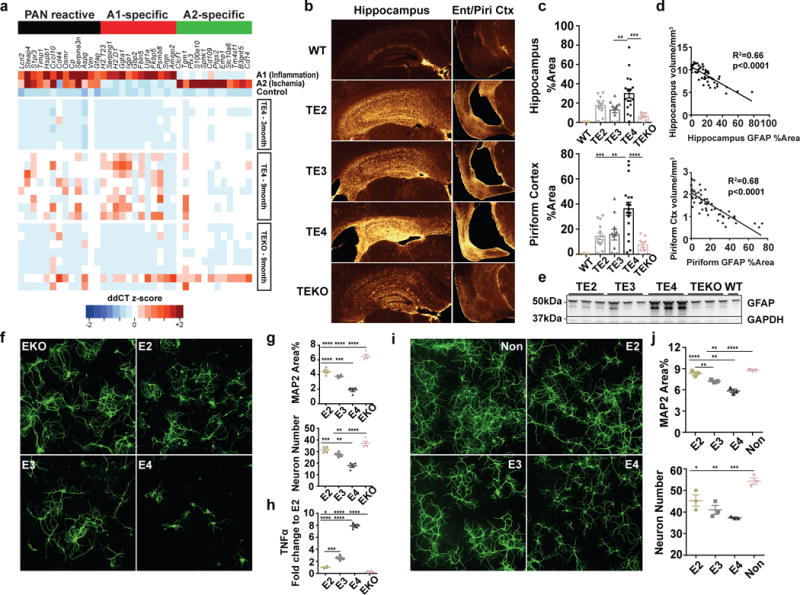
a, Microfluidic RT-qPCR for activated astrocytic genes in 9-month old TE4 (n=8), TEKO (n=8), and 3-month old TE4 mice (n=6). A1-specific: genes activated only by LPS; A2-specific: genes activated only by ischemia; PAN reactive: genes activated by either LPS or ischemia. b, GFAP staining in 9-month old TE mice (WT: n=5, TE2: n=14, TE3: n=11, TE4 n=17, TEKO: n=10). c, Quantification of area covered by GFAP IR. d, Correlation between GFAP IR and brain volume. N=57 biologically independent animals. Pearson correlation analysis (two-sided). Hippocampus: r2=0.66, p<0.0001; Piriform cortex: r2=0.68, p<0.0001. e, Western blot for GFAP in 9-month old TE mice (n=3). For gel source data, see Supplementary Figure 1. f, Representative images of primary WT neurons infected with AAV2/8-synapsin-P301S human tau co-cultured with mixed glia cells (80–90% astrocyte, 10–20% microglia) derived from human ApoE KI (E2, E3, E4) and ApoE KO mouse brain for 3 weeks. Experiment replicated 5 times g, Quantification of neuron number and area covered by MAP2 IR for co-cultured neurons (4 wells/genotype, 8 random images taken/well). h, TNFα level in the co-culture medium measured by ELISA. i, Representative images of primary WT neurons infected with AAV2/8-synapsin-P301S human tau treated with 10μg/ml recombinant human ApoE for 3 weeks. Experiment replicated twice. j, Quantification of neuron number and area covered by MAP2 staining for ApoE-treated neurons (3 wells/treatment, 8 random images/well). Data expressed as mean ± SEM, One-way ANOVA with Tukey’s post hoc test, two-sided. *p<0.05, **p<0.01, ***p<0.001, ****p<0.0001.
Remarkably, the detrimental effect of ApoE4 on neurodegeneration and the protective effect associated with the absence of ApoE were robustly recapitulated in vitro. When co-culturing P301S tau-expressing neurons with mixed glia cells derived from ApoE KI or ApoE KO mice, drastic neuronal death occurred in the neuron/E4 glia co-culture, whereas neurons co-cultured with EKO glia showed the least injury (Fig. 4f, g). In addition, a significantly higher level of TNFα was detected in the neuron/E4 co-culture medium whereas minimal TNFα levels were detected in the neuron/EKO co-culture medium (Fig. 4h), indicating activated glia likely played an important role in inducing neuronal death. Treatment of P301S tau-expressing neurons with recombinant ApoE, regardless of ApoE isoform, invariably led to reduced neurite arborization and increased neuronal death compared to non-ApoE treated neurons, and these effects were most prominent with ApoE4 treatment (Fig. 4i, j), indicating that ApoE itself was directly involved in inducing neurotoxicity in P301S tau-expressing susceptible neurons. Interestingly, ApoE has been shown to accumulate in damaged neurons of Pick’s Disease21 and in neurofibrillary tangle (NFT)-bearing neurons of AD22, suggesting a potential role of ApoE in mediating neurotoxicity under pathological conditions. However, overall neuronal loss or damage following ApoE treatment was much milder than that was observed in neuron-glia co-cultures, suggesting an additive role of concomitant neuroinflammation in exacerbating neurodegeneration.
To investigate whether the pro-neurodegenerative effect of ApoE4 also manifests in human primary tauopathies, we assessed post-mortem regional neurodegeneration severity in relation to ApoE genotype in individuals with a primary diagnosis of corticobasal degeneration (CBD), Pick’s disease, and progressive supranuclear palsy (PSP), the three most prevalent sporadic primary tauopathies. Possession of an ε4 allele was associated with more severe regional neurodegeneration (linear mixed effects model, estimate 0.31, p=0.035, 95% CI [0.02, 0.59]) after controlling for age, sex, diagnosis, rater, Aβ deposition, Lewy body disease, tau burden, and TDP-43 inclusion burden (Extended Data Table 1). In addition, we demonstrated greater regional neurodegeneration as a function of tau burden (estimate 0.17, p<0.001. 95% CI [0.14, 0.20]) and TDP-43 proteinopathy (estimate 0.22, p=0.003, 95%CI [0.07, 0.37]). Aβ deposition, in contrast, was associated with less severe neurodegeneration (estimate −0.08, p=0.044, 95%CI [−0.15, −0.002]), whereas Lewy body disease, which was relatively uncommon in this cohort, showed no effect (estimate −0.01, p=0.87, 95% CI [−0.17, 0.15]) (Extended Data Table 1). We also analyzed disease progression in relation to APOE allele status in a cohort of CSF biomarker confirmed individuals with symptomatic AD, who invariably possess Aβ deposition and usually have tau pathology. We found possession of the ε4 allele was associated with significant higher rates of clinical disease progression (p=0.02) in a dose-dependent manner. Individuals with one ε4 allele progressed 14% faster than non-carriers and those with two ε4 alleles progressed 23% faster (Extended Data Fig. 8). Overall, these findings provide converging evidence in humans that possession of ε4 allele worsens neurodegeneration in the setting of a tauopathy, with or without Aβ pathology.
Taken together, we found ApoE affects neurodegeneration in the context of tau pathology independent of Aβ. ApoE4 resulted in aggravated neurodegeneration whereas the absence of ApoE was strongly neuroprotective. This was likely a direct effect of ApoE modulating tau pathology from an early age, which ultimately led to various tau forms/patterns potentially possessing distinct neurotoxicity. On the other hand, we found ApoE itself, especially ApoE4, was essential to P301S neuronal death. With pathological tau accumulation, the presence of ApoE, especially ApoE4, may make neurons more susceptible to degeneration, whereas the absence of ApoE may protect neurons from death. The presence of degenerating neurons appeared to further induce neuroinflammation, which was augmented by ApoE4 due to its inherently higher innate immune reactivity. While activated microglia may to some extent be protective in the setting of Aβ pathology via targeting plaques and reducing dystrophic neurites23,24, it could be deleterious in tauopathy by directly targeting injured neurons and by activating toxic A1 astrocytes. Enhanced neuroinflammation associated with ApoE4 may further exacerbate neurodegeneration (Extended Data Fig. 9 for hypothesis summary). These new findings suggest a re-evaluation of the role of ApoE in AD and other tauopathies. Targeting ApoE, especially ApoE4, may be a promising therapeutic approach in reducing tau-mediated neurodegeneration.
Methods
Animals
Human ApoE2, ApoE3, and ApoE4 knockin (KI) mice (C57BL/6) were provided by Dr. Patrick M. Sullivan (Duke University) and ApoE knockout (KO) mice (C57BL/6) were purchased from The Jackson Laboratory (#002052). P301S tau transgenic mice (The Jackson Laboratory, #008169) on a B6/C3 background expressing human P301S 1N4R tau driven by PrP promoter were crossed to human ApoE KI mice to generate P301S hE/hE mice for all three ApoE isoforms, which were then crossed to ApoE KO mice to generate P301S hE/− mice. Separately, ApoE KI mice were crossed to ApoE KO mice to generate hE/− mice. P301S hE/− mice were then crossed with hE/− mice to generate P301S hE/hE, P301S hE/− and P301S −/− littermates for all three ApoE isoforms. All tau transgenic mice for final analysis were kept at the same generation and had ~90% C57BL/6 background by congenic test. Only male ApoE homozygote and knockout mice were used for analysis. P301S ApoE KO mice derived from three ApoE isoforms showed no difference in analysis and were combined as one single group (TEKO). WT mice were purchased from Charles River Laboratories (#027) on a C57BL/6 background and were bred separately from the P301S/ApoE mice. Due to a slightly different background of the WT mice, we did not perform statistical analysis comparing WT to other mice. All animal procedures and experiments were performed under guidelines approved by the animal studies committee at Washington University School of Medicine. Sample sizes were chosen based on estimates to provide 80% power to see significant differences of 20% or greater.
Immunohistochemistry
The left hemi-brain of each mouse was sectioned coronally at 50 μm using a freezing sliding microtome. Three sections from each mouse (300 um apart), corresponding approximately to bregma coordinates −1.4, −1.7, and −2.0 mm respectively, were used for p-tau staining described by Yanamandra et al25. Briefly, brain sections were washed in Tris-buffered saline (TBS) buffer for 3 times followed by incubation in 0.3% hydrogen peroxide in TBS for 10 min at RT. After three washes in TBS, sections were blocked with 3% milk in 0.25% TBS-X (Triton X-100) for 0.5 h followed by incubation at 4°C overnight with biotinylated AT8 antibody (Thermo Scientific, MN1020B, 1:500). The next day, the slices were developed using the VECTASTAIN Elite ABC HRP Kit (Vector laboratories) following manufacturer’s instructions. Stained sections were imaged by the NanoZoomer digital pathology system and pathology was quantified using Image J. For immunofluorescence, two sections (bregma −1.7mm and −2.0mm for CD68, bregma −2.3mm and −2.6mm for GFAP) from each mouse were used. The sections were washed in TBS 3 times, and blocked with 3% BSA in 0.25% TBS-X for 0.5h at RT, followed by overnight incubation at 4°C with primary antibodies (CD68: AbD SeroTec, MCA1957, 1:500; GFAP: EMD Millipore, MAB3402, 1:2000). The next day, the sections were washed in TBS and incubated with fluorescence-labeled secondary antibodies (Molecular probes, 1:500) for 2h at RT. The slices were then washed and mounted in prolong gold antifade mounting media (Molecular probes, P36931). Images were taken with an epi-fluorescence microscope at 4× magnification and quantified using MetaMorph.
Volumetric analysis
Every sixth coronal brain section (300 um between sections) starting rostrally at bregma +2.1mm to the dorsal end of the hippocampus at bregma −3.9 mm were mounted for each mouse. All mounted sections were stained with 0.1% Sudan black in 70% ethanol at RT for 20 min, then washed in 70% ethanol for 1 min, 3 times. The sections were finally washed in Milli-Q water for 3 times and coverslipped with Fluoromount. The stained slices were imaged with the NanoZoomer and areas of interest were traced and measured in each slice using the NDP viewer. The volume was calculated using the following formula: volume = (sum of area) * 0.3 mm. For hippocampus and posterior lateral ventricle, quantification started from bregma −1.1 and ended at bregma −3.9. For piriform/entorhinal cortex, quantification started at bregma −2.3 and ended at bregma −3.9.
Neuronal layer thickness measurement
Three sections (bregma −1.4, −1.7, and −2.0 mm) from each mouse were mounted and stained in cresyl violet for 5 min at RT. The slices were then sequentially dehydrated in 50%, 70%, 95% (3 times) and 100% ethanol (twice) for 1min, then cleared in xylene for 4min (twice), and coverslipped in cytoseal60 (Thermo Fisher Scientific, 8310-16). The thickness of the CA1 pyramidal cell layer and dentate gyrus granular cell layer were measured by drawing a scale perpendicular to the cell layer at two spots in all three slices and taking the average value for each mouse.
Brain extraction
Mouse cortex was processed in RAB, RIPA and 70% FA buffer sequentially as described previously25 with modifications. Briefly, the tissue was weighed and homogenized using a pestle with 10ul buffer/1mg tissue in RAB buffer (100mM MES, 1mM EGTA, 0.5mM MgSO4, 750mM NaCl, 20mM NaF, 1mM Na3VO4, pH=7.0, supplemented by protease inhibitors (Complete, Roche) and phosphatase inhibitors (PhosSTOP, Roche)). After centrifugation at 50,000 × g for 20 min, the supernatant was taken as the RAB-soluble fraction and the pellet was dissolved in RIPA buffer (150mM NaCl, 50mM Tris, 0.5% deoxycholic acid, 1% Triton X-100, 0.1% SDS, 5mM EDTA, 20mM NaF, 1mM Na3VO4, pH 8.0, supplemented by Complete and PhosSTOP) at 10ul buffer/1mg tissue by sonication. After centrifugation at 50,000 × g for 20 min, the supernatant was taken as the RIPA-soluble fraction. The pellet was sonicated in 70% formic acid at 10ul buffer/1mg tissue, and centrifuged at 50,000 × g for 20 min. The supernatant was taken as the FA-soluble fraction. All fractions were stored in −80°C until analyzed.
ELISA
Human tau and ApoE ELISAs were performed as described previously25. For coating antibodies, Tau5 (gift from L. Binder, Northwestern University, Chicago, IL) was used for human tau ELISA, and HJ15.6 (in house-made anti-human ApoE antibody) was used for human ApoE ELISA. For detection antibodies, biotinylated HT7 (Thermo Fisher Scientific, MN1000B) was used for tau ELISA and biotinylated HJ15.4 (in house-made anti-human ApoE antibody) was used for human ApoE ELISA.
Western Blot
Mouse cortex was homogenized by sonication in RIPA buffer supplemented with Complete and PhosSTOP. Samples were separated by 4–12% NuPAGE (Invitrogen) gel using MOPS buffer and transferred to nitrocellulose membranes. Primary antibodies anti-GFAP (Millipore, MAB 3402), anti-GAPDH (Abcam, ab9484), anti-ApoE (Abcam, ab24139), anti-α tubulin (Sigma, T5168) and HRP-conjugated secondary antibodies (Santa Cruz) were used for detection. Membranes were developed using Lumigen TMA6 (GE Healthcare).
RT-qPCR for human tau
RNAs were isolated from mouse cortex using RNeasy Mini Kit (QIAGEN,74104), and reverse transcribed to cDNA using the high capacity RNA-to-cDNA kit (Applied Biosystems, #4387406). Quantitative PCR were performed using Taqman primers and probes with Taqman universal PCR master mix (Applied Biosystems, #4304437).
Nanostring gene expression assay
RNAs were isolated from mouse hippocampus using RNeasy Mini Kit (QIAGEN,74104). We performed nCounter multiplexed target profiling of 534 microglial transcripts with a custom designed microglial gene chip (MG550) using the Nanostring nCounter technology (nanostring.com), which allows analysis of up to 800 genes from a single sample. Selection of genes was based on genes and proteins specifically or highly expressed in adult homeostatic microglia26 plus 150 inflammation-related genes which were significantly affected in EAE, APP-PS1 and SOD1 mice27. Using this signature, we generated a new version (v3) of Nanostring-based microglia chip termed MG550. For each sample, 100ng RNAs were used for hybridization, and all data were normalized to 6 housekeeping genes: Cltc, Gapdh, Gusb, Hprt1, Pgk1, and Tubb5.
Microfluidic qRT-PCR for astrocytic genes
Total RNA was extracted from mouse cortex using the RNeasy Plus kit (Qiagen) and microfluidic qRT-PCR was performed as described16.
Primary neuron culture and recombinant ApoE treatment
Primary neurons were obtained from E17 WT mouse (Charles River, #022) fetuses. Hippocampi were dissected in calcium- and magnesium-free Hanks’ Balanced Salt solution (HBSS) with careful strip of meninges. Tissue was digested in HBSS containing 0.25% trypsin (GIBCO #15090-046) and 0.2mg/ml DNase (Sigma #DN-25) at 37 °C for 10 min, and was dissociated in HBSS containing 0.4mg/ml DNase using a fire-polished Pasteur glass pipette and filtered through a 70-μm nylon mesh. Filtered material was pelleted at 1000 g for 5 min, washed with neurobasal medium (Neurobasal + 1x B27 + 1x pen/strep + 1x L-glutamine) once, and infected with AAV2/8-synapsin-P301S tau virus for 3h on ice. Cells were then pelleted, washed, and plated onto 24-well tissue culture plates over glass cover slips that had been coated with 10 μg/ml Poly-L-lysine (PLL, Sigma, #P2636) at a density of 20,000 cells/well in neurobasal medium. For all cell culture experiments, only the central wells of the plates were used with the peripheral wells filled with 1ml autoclaved ddH2O to avoid different rates of medium evaporation during the culture. Recombinant ApoE2, ApoE3, and ApoE4 (Leinco, #A215, A218, A219) were added to the medium (10ug/ml) at the time of plating. Neurons were kept for 3 weeks with addition of 200 ul fresh recombinant ApoE-containing medium (10 μg/ml) each well every week, and were then stained with MAP2 antibody (Thermo Fisher Scientific, #OSM00030W) for analysis and with HT7B (Thermo Fisher Scientific, #MN1000B) antibody to confirm tau expression.
Glia-neuron co-culture
E2, E3, E4 and EKO glia were obtained from P2 pups from the respective human ApoE KI or ApoE KO mice. Cortex was dissected and dissociated in the same way as with neuron isolation. Cells were plated in glial medium (DMEM + 10% FBS + 1x Pen/strep + 1x Glutamax). Once monolayers were confluent, cells were replated in 24-well plates over glass cover slips coated with geltrex (Gibco, #A1413201) at a density of 75,000 cells/well, and allowed to grow for 2 days in glia medium. The glia were then washed with 1 ml neurobasal medium (Neurobasal + 2% B27 + 1x pen/strep + 1x L-glutamine) and placed in 400 μl neurobasal medium before use. Primary neurons expressing P301S tau were prepared as described above, and were directly plated on top of the glia at a density of 20,000 cells/well. The co-cultures were kept for 3 weeks with addition of 200 μl fresh neurobasal medium each well every week. Neurons were then stained with MAP2 antibody (Thermo Fisher Scientific, #OSM00030W) for analysis and with HT7B (Thermo Fisher Scientific, #MN1000B) antibody to confirm tau expression.
Primary microglia culture, LPS stimulation and cytokine measurement
Mixed glia culture from ApoE2, ApoE3 and ApoE4 KI mice were prepared as described above in DMEM/F12 medium supplemented with 10% FBS and 5ng/ml GM-CSF. Loosely attached microglia were harvested at DIV12 by shaking for 2 hours at 400 rpm and then seeded onto 12-well tissue culture plates coated with PLL at a density of 1×10⁶ cells per well. The next day, seeded microglia were washed in serum-free medium (SFM-DMEM/F12 + 0.2% BSA +1x pen/strep) and placed in 450 μl SFM. Cells were then treated with 1 ng/ml LPS (Sigma, #L5293) for 24h. Medium were collected and spun down at 10,000g for 10 min. Supernatants were collected and assayed for mouse TNFα, IL-1α and IL-1β using single cytokine ELISAs (Bon Opus Biosciences) according to the manufacturer’s instructions. All cytokine levels were normalized to microglial protein levels determined by BCA assay.
Immunocytochemistry
Cells were fixed in DPBS containing 4% PFA and 4% sucrose at RT for 10 min and permeabilized with 0.3% PBST for 10min. After blocking in 0.1% PBS-Triton X-100 containing 3% BSA and 3% goat serum for 30min at RT, cells were incubated in primary antibodies overnight at 4°C. The next day, cells were washed with 0.1% PBST for 3 times and incubated in secondary antibodies for 1h at RT. Cells were then washed 3 times in 0.1% PBST and mounted in prolong gold antifade mounting media (Molecular probes, P36931). Images were taken with an epi-fluorescence microscope at 10× magnification and quantified using MetaMorph.
Study of neurodegeneration in human primary tauopathies
We searched the University of California, San Francisco Neurodegenerative Disease Brain Bank database for patients with APOE genotyping and a pathological diagnosis of CBD, Pick’s disease, or PSP, the three most common sporadic forms of FTLD-tau. Authorization for autopsy was provided by patient’s next-of-kin, and procedures were approved by the UCSF Committee on Human Research. We constrained our search to patients autopsied since 2007, when systematic, prospective recording of neuropathological findings began. Such data were available from 29 patients with CBD, 17 with Pick’s disease, and 33 with PSP. Demographics and relevant variables are shown in Extended Data Table 1a.
Postmortem brains were processed as previously described28. Fixed tissue slabs were dissected into blocks representing dementia-relevant brain regions, embedded in paraffin wax, and cut into 8 microns-thick sections. Regional neurodegeneration was assessed using hematoxylin and eosin-stained sections. Neuronal loss, astrogliosis and microvacuolation were semi-quantitatively graded as absent (0), mild (1), moderate (2) or severe (3). A similar scheme was used to rate Aβ deposits (neuritic plaques, diffuse plaques and vascular amyloid-beta deposits)29, tau inclusions (neurofibrillary tangles, Pick bodies, globose tangles, neuronal cytoplasmic inclusions (other than those listed previously), tufted astrocytes, thorny astrocytes, astrocytic plaques, neuropil threads, and other glial cytoplasmic inclusions), α-synuclein inclusions (Lewy bodies and Lewy neurites), and TDP-43 inclusions (neuronal intranuclear inclusions, neuronal cytoplasmic inclusions, dystrophic neurites, glial cytoplasmic inclusions). Composite scores of neurodegeneration (ND score) [(microvacuolation + astrogliosis)/2) + neuronal loss] and for tau, Aβ, α-synuclein, and TDP-43 were generated for each region by summing scores across inclusion types for each pathological protein.
We limited analyses to regions that had been stained for all four pathological proteins. This approach yielded a total of 609 regional assessments across the 79 patients, with an average of 8 regions per patient. Hippocampal CA1-4, subiculum, dentate gyrus and entorhinal cortex were the most commonly assessed regions and available in 72 of 79 patients. Additional regions available from no less than 15 patients included midbrain subregions (oculomotor nucleus, tectum, periaqueductal grey, dorsal raphe and substantia nigra); anterior cingulate cortex; and middle frontal gyrus (Extended Data Table 1b). A linear mixed effects model conducted at the brain regional level was used to determine the influence of multiple predictors on composite neurodegeneration scores. APOE ε4 carrier status was used as the binary predictor of interest; additional fixed effects in the model included tau, Aβ, TDP-43, and α-synuclein composite scores; sex; age; pathological diagnosis; rater; and brain region. Patient identity was modeled as a random effect. The primary hypothesis was that possession of an ApoE E4 allele would be associated with greater regional neurodegeneration after controlling for tau pathological burden and other relevant predictors.
Analysis of clinical disease progression in human AD patients
Participants from this study are part from two different longitudinal studies, the Knight Alzheimer Disease Research Center (ADRC) at Washington University and the Alzheimer’s Disease Neuroimaging Initiative (ADNI). Details of the Knight ADRC and ADNI studies are listed in the Supplementary Information. All procedures were approved by the Washington University Human Research Protection Office, and written informed consent was obtained from each participant.
Statistical analysis
Unless explicitly stated, all mouse and cell culture data were shown as mean ± SEM. Differences between groups were evaluated by one-way analysis of variance tests with post hoc Tukey’s multiple comparisons tests. For all experiments, data normality was analyzed using D’Agostino-Pearson omnibus normality test. For data not following normal distribution, Kruskal-Wallis test with Dunn’s multiple comparisons test was performed for statistical analysis, and was stated in the figure legend. GraphPad Prism version 6.00 for Windows (GraphPad Software, La Jolla, CA) was used for these analyses and creation of the plots. For statistical analysis of the p-tau staining pattern distribution, two-sided Fisher’s exact tests were performed using the “fisher.test” function in R version 3.4.0 (The R Foundation for Statistical Computing) for all four TE groups together as well as for individual comparisons between each two groups.
Data availability
Source data of graphs plotted in Figs 1, 2, 3, 4 and Extended Data Figs 1, 2, 3, 4, 5, 6 are available as Source Data files. Other data are available from the corresponding author upon reasonable request. Nanostring gene list, gene pathway analysis, and fully scanned western blot gels can be found in the Supplementary Information.
Extended Data
Extended Data Figure 1. No brain atrophy or brain volume differences in 3-month old TE mice or 9-month old non-tau transgenic mice.
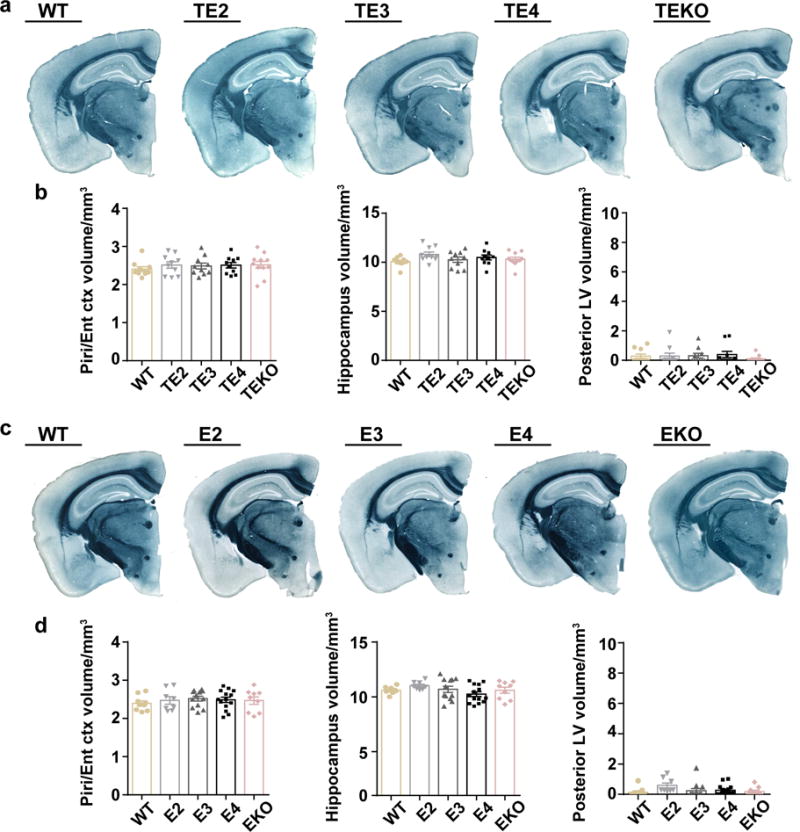
a, Representative images of 3-month old TE mouse brains (WT: n=10, TE2: n=10, TE3: n=10, TE4: n=10, TEKO: n=11) b, Quantification of the piriform/entorhinal cortex, hippocampus, posterior lateral ventricle volume in 3-month old TE mice. c, Representative images of 9-month old non-tau transgenic mouse brains (WT: n=9, E2: n=8, E3: n=12, E4: n=14, EKO: n=9). d, Quantification of the piriform/entorhinal cortex, hippocampus, posterior lateral ventricle volume in 9-month old non-tau transgenic mice. Data expressed as mean ± SEM, One-way ANOVA with Tukey’s post hoc test (two-sided) was used for statistical analysis. Kruskal-Wallis test with Dunn’s multiple comparisons test was performed for posterior LV volume analysis.
Extended Data Figure 2. ApoE4 leads to more severe neuronal loss in the CA1 region of hippocampus in 9-month old P301S mice.
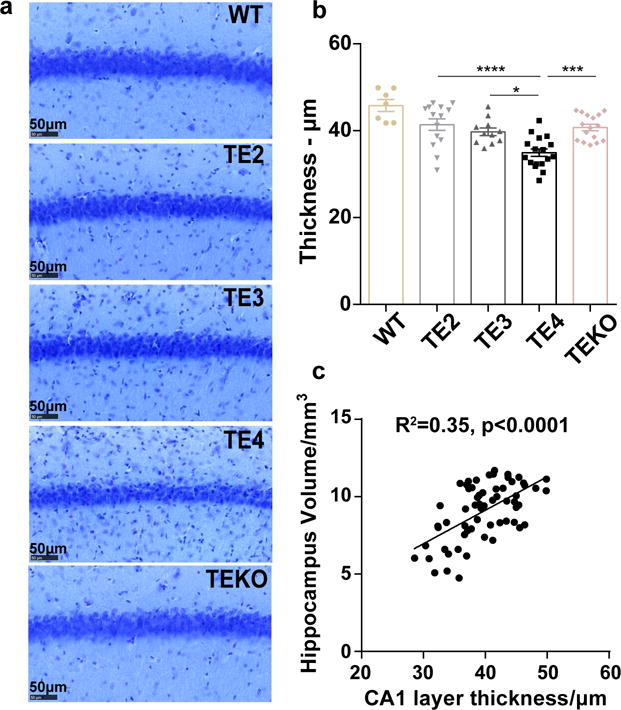
a, Representative images of 9-month old TE mouse brain stained with cresyl violet. b, Thickness of the CA1 pyramidal neuronal layer (WT: n=7, TE2: n=14, TE3: n=11, TE4: n=17, TEKO: n=16). Data expressed as mean ± SEM, One-way ANOVA with Tukey’s post hoc test (two-sided). c, Correlation between CA1 neuronal layer thickness and hippocampal volume. N=62 biologically independent animals. Pearson correlation analysis (two-sided), p<0.0001, r2=0.35. *p<0.05, **p<0.01, ***p<0.001, ****p<0.0001.
Extended Data Figure 3. Elevated tau level in TE4 mice is not due to tau synthesis differences, and is likely caused by impairment of autophagy-mediated tau clearance.
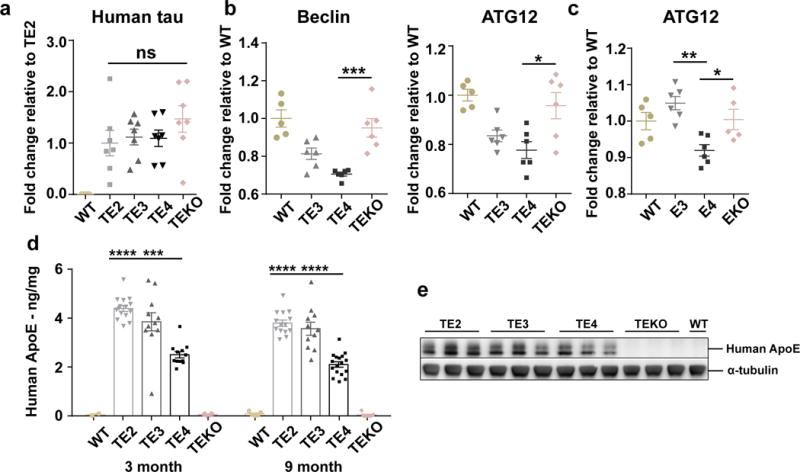
a, qPCR result for human tau in 9month TE mouse cortex (WT: n=5, TE2, TE3, TE4, TEKO: n=7). b, c Nanostring analysis for autophagy-related gene expression in (b) 9-month old TE mouse hippocampus and (c) 9-month old non-tau transgenic ApoEKI or ApoEKO mouse hippocampus (n=5–6 per group). d, Human ApoE levels in the RAB fraction of 3-month (WT: n=2, TE2: n=15, TE3: n=11, TE4: n=12, TEKO: n=6) and 9-month (WT: n=5, TE2: n=14, TE3: n=11, TE4: n=17, TEKO: n=7) old TE mouse brain lysates were measured by ELISA. e, Nine-month old TE mouse cortex was lysed in RIPA buffer without fractionation and total ApoE level was assessed by western blot (n=3). For gel source data, see Supplementary Figure 2. Data expressed as mean ± SEM, One-way ANOVA with Tukey’s post hoc test (two-sided) was used for statistical analysis. *p<0.05, **p<0.01, ***p<0.001, ****p<0.0001.
Extended Data Figure 4. ApoE4 promotes pathological tau redistribution from axons to cell bodies at an early age.
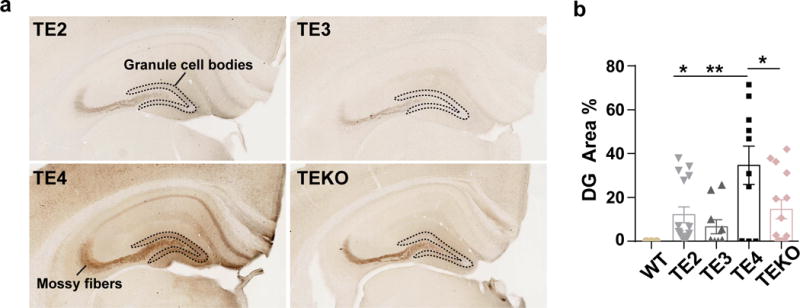
a, AT8 staining for 3-month old TE mouse hippocampus. Dotted outline surrounds the dentate gyrus (DG) granule cell bodies. b, Quantification of AT8 covered area in the DG cell body region (TE2: n=16, TE3: n=10, TE4: n=10, TEKO: n=14). Data expressed as mean ± SEM, One-way ANOVA with Tukey’s post hoc test (two-sided). *p<0.05, **p<0.01, ***p<0.001, ****p<0.0001.
Extended Data Figure 5. No or minimal change of microglial gene expression in 3-month old TE mice or 9-month old non-tau transgenic mice despite significant changes in 9-month old TE mice.
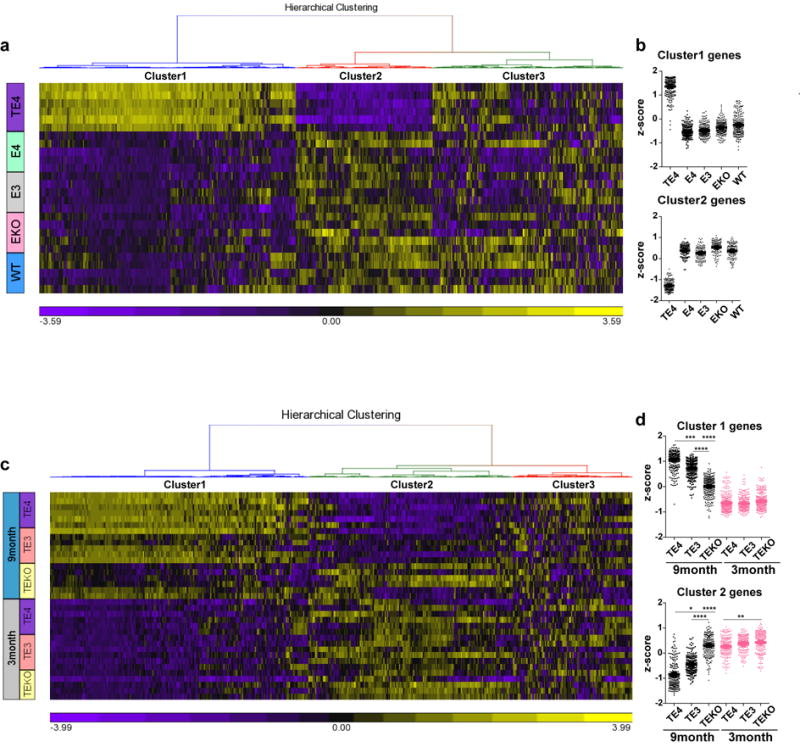
a, Nanostring analysis for microglial gene expression in 9-month old TE4 mice and 9-month old non-tau transgenic mice (n=5–6). Heatmap generated by hierarchical gene clustering based on genotypes (Horizontal: 534 microglial genes, vertical: individual mouse samples) b, Z-score of genes from cluster 1 or cluster 2 category. c, Nanostring analysis for microglial gene expression in 9-month and 3-month old TE mice (n=5–6). d, Z-score of genes from cluster 1 or cluster 2 category. Kruskal-Wallis test with Dunn’s multiple comparisons test was performed for statistical analysis. Data expressed as mean ± SEM. *p<0.05, **p<0.01, ***p<0.001, ****p<0.0001.
Extended Data Figure 6. P-tau staining patterns are associated with distinct microglial activation profiles.
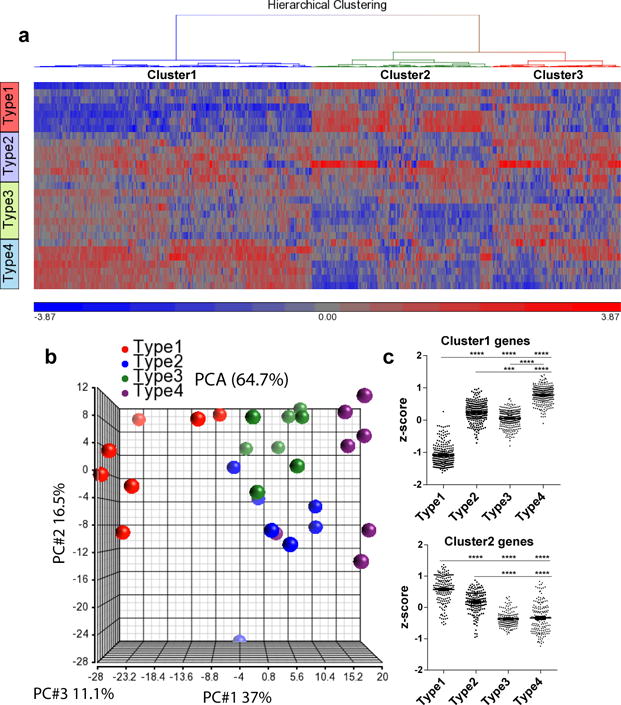
a, Heatmap generated by hierarchical gene clustering based on p-tau staining types for 9-month old TE mice (n=7–8). b. Principle components analysis (PCA) of microglial gene expression profile for p-tau staining types. c. Z-score of genes from cluster 1 or cluster 2 category. Kruskal-Wallis test with Dunn’s multiple comparisons test was performed for statistical analysis. Data expressed as mean ± SEM. *p<0.05, **p<0.01, ***p<0.001, ****p<0.0001.
Extended Data Figure 7. No activation of A1 astrocytic genes in 9-month old non-tau transgenic mice.
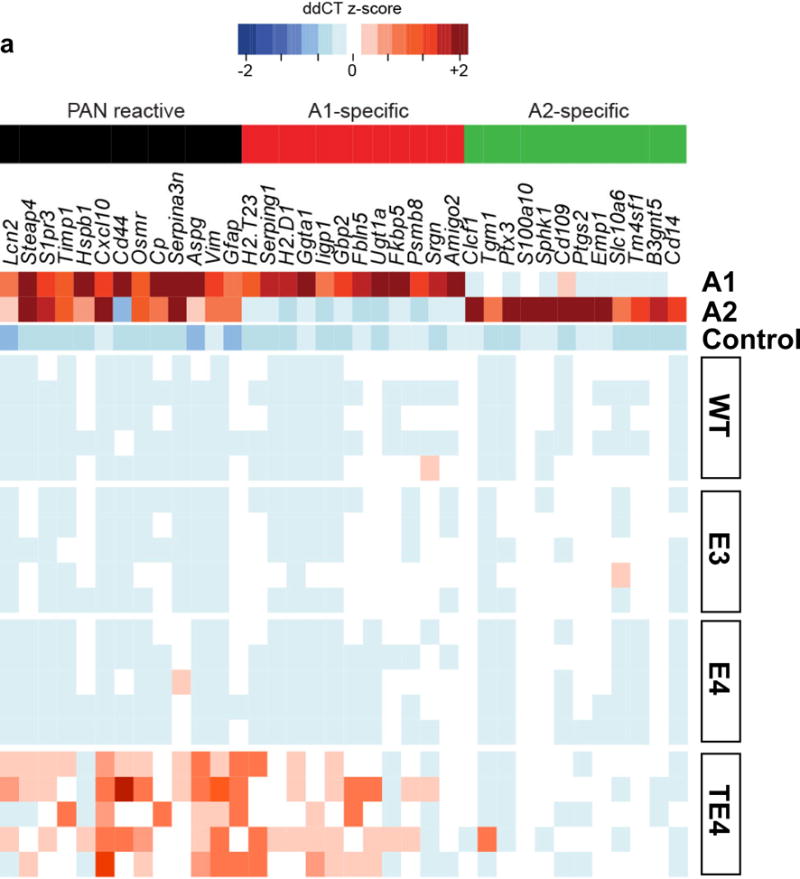
a, Microfluidic RT-qPCR for activated astrocytic genes in 9-month old TE4 mice and 9-month old non-tau transgenic WT and human ApoE KI mice (n=5). A1-specific: genes activated only by LPS; A2-specific: genes activated only by ischemia; PAN reactive: genes activated by either LPS or ischemia.
Extended Data Figure 8. Possession of ε4 allele accelerates the rate of disease progression in AD patients.
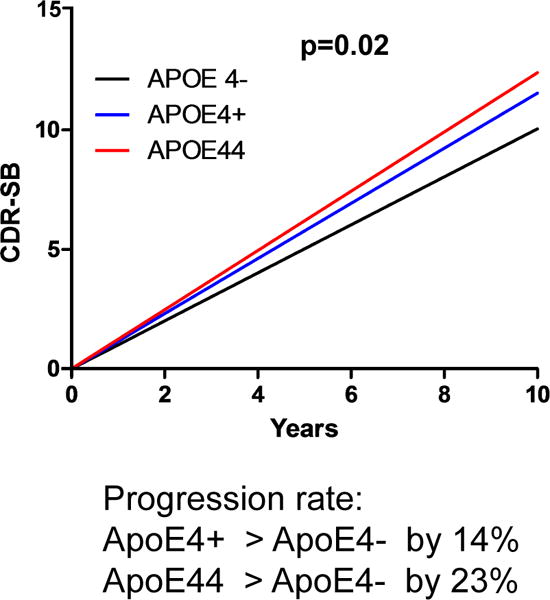
Disease progression rate in a cohort of 592 CSF biomarker confirmed individuals with symptomatic AD from two different longitudinal studies, the Knight Alzheimer’s Disease Research Center (ADRC) at Washington University and the Alzheimer’s Disease Neuroimaging Initiative (ADNI). Data generated based on the Clinical Dementia Rating Sum of Boxes (CDR-SB) scores. Possession of the ε4 allele significantly accelerated disease progression (p=0.02), with one ε4 allele increasing progression rate by 14% and two ε4 alleles increasing the rate by 23% compared to non-carriers (lineal mixed model, two-sided).
Extended Data Figure 9. Schematic summary of hypotheses.
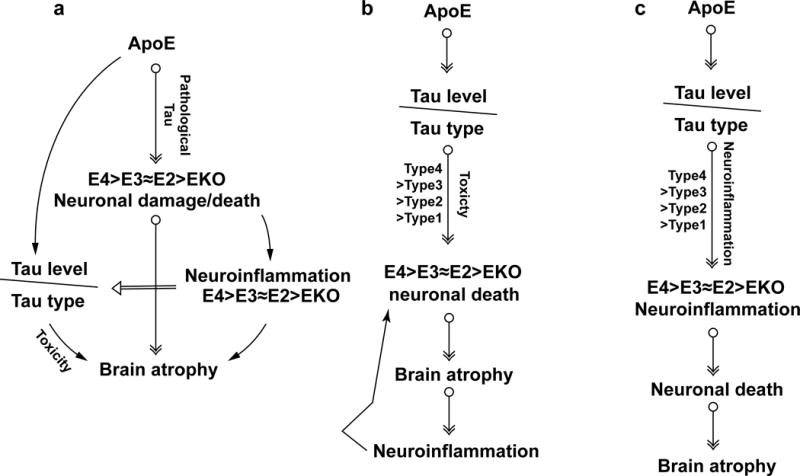
a, ApoE is essential for neuronal death under pathological conditions. With pathological tau accumulation, the presence of ApoE, especially ApoE4, renders the neurons more susceptible to degeneration, whereas the absence of ApoE protects neurons from death, resulting in neurodegeneration (E4>E3≈E2>>EKO). Degenerating neurons further induce neuroinflammation, which is augmented by ApoE4 due to its inherent higher innate immune reactivity, thereby exacerbating neurodegeneration furthermore. Neuroinflammation may concomitantly affect tau pathology13, resulting in various p-tau staining types that could also contribute to neurodegeneration. b, ApoE affects tau pathogenesis, resulting in different p-tau patterns, which may possess distinct neurotoxicity (type4>type3≈type2>type1), leading to different levels of neuronal death and brain atrophy (E4>E3≈E2>>EKO). Neuroinflammation accompanying neurodegeneration will in turn exacerbate neuronal death. c, ApoE affects tau pathogenesis, resulting in different p-tau patterns that may have different capacities to induce neuroinflammation (type4>type3≈type2>type1), which eventually leads to various degrees of neurodegeneration.
Extended Data Table 1. Possession of an ε4 allele exacerbates regional neurodegeneration in human primary tauopathies.
a, Demographics and relevant variables of patients. Brain regional neurodegeneration was analyzed using post mortem neuropathological data from a collection of 79 human primary tauopathy patients with sporadic FTLD-tau: 29 with corticobasal degeneration (CBD), 17 with Pick’s disease, and 33 with progressive supranuclear palsy (PSP). Among these patients, 19 were ε4 carriers. Possession of an ε4 allele was associated with more severe regional neurodegeneration (linear mixed effects model, estimate 0.31, p=0.035, 95% CI [0.02, 0.59]) after controlling for age, sex, diagnosis, rater, Aβ deposition, Lewy body disease, tau burden, and TDP-43 inclusion burden. Greater regional neurodegeneration was found as a function of tau burden (estimate 0.17, p<0.001. 95% CI [0.14, 0.20]) and TDP-43 proteinopathy (estimate 0.22, p=0.003, 95%CI [0.07, 0.37]), whereas Aβ deposition was associated with less severe neurodegeneration (estimate −0.08, p=0.044, 95%CI [−0.15, −0.002]). Lewy body disease, which was relatively uncommon in this cohort, showed no effect (estimate −0.01, p=0.87, 95% CI [−0.17, 0.15]). b, Brain regions used for analysis.
| a | ||||||||||||||||||
|---|---|---|---|---|---|---|---|---|---|---|---|---|---|---|---|---|---|---|
| N | Sex (M) | Mean Age Of Onset | SD | Mean Age At Death | SD | Mean Disease Duration | SD | Mean ND Score | SD | Mean Tau Score | SD | Mean Aβ Score | SD | Mean TDP-43 Score | SD | Mean α-Synuclein Score | SD | |
| CBD | 29 | 15 | 61 | 7.1 | 69 | 6.4 | 7.2 | 3.4 | 0.74 | 1.1 | 7.77 | 4.3 | 0.6 | 1.4 | 0.28 | 1 | 0.12 | 0.6 |
| E4 | 6 | 4 | 60 | 4.2 | 67 | 5.7 | 6.5 | 2.1 | 0.76 | 1.1 | 7.75 | 4.6 | 1.77 | 2.1 | 0.55 | 1.4 | 0 | 0 |
| no E4 | 23 | 11 | 62 | 7.7 | 69 | 6.6 | 7.3 | 3.6 | 0.73 | 1.1 | 7.78 | 4.2 | 0.32 | 0.9 | 0.2 | 0.8 | 0.16 | 0.7 |
| Pick’s | 17 | 8 | 59 | 6.3 | 68 | 6.5 | 9.6 | 2.6 | 1.07 | 1.6 | 6.08 | 4.5 | 0.69 | 1.6 | 0.01 | 0.1 | 0.1 | 0.6 |
| E4 | 5 | 2 | 55 | 6.4 | 65 | 6.2 | 10.2 | 2.9 | 1.09 | 1.6 | 5.88 | 4.1 | 1.2 | 1.7 | 0 | 0 | 0.18 | 0.7 |
| no E4 | 12 | 6 | 60 | 5.9 | 70 | 6.4 | 9.4 | 2.6 | 1.06 | 1.7 | 6.16 | 4.6 | 0.51 | 1.6 | 0.01 | 0.1 | 0.07 | 0.6 |
| PSP | 33 | 13 | 64 | 7.5 | 72 | 6.9 | 8.2 | 3.1 | 0.53 | 1 | 7.08 | 4 | 1.07 | 1.9 | 0.07 | 0.4 | 0.25 | 0.8 |
| E4 | 8 | 1 | 68 | 5.7 | 75 | 5.1 | 7.1 | 2.9 | 0.65 | 1 | 6.66 | 3.6 | 2.22 | 2.3 | 0.26 | 0.7 | 0.16 | 0.7 |
| no E4 | 25 | 12 | 62 | 7.5 | 71 | 7.1 | 8.5 | 3.1 | 0.5 | 1 | 7.23 | 4.1 | 0.67 | 1.5 | 0.01 | 0.2 | 0.27 | 0.9 |
| All Dx | 79 | 36 | 62 | 7.3 | 70 | 6.8 | 8.1 | 3.2 | 0.72 | 1.2 | 7.1 | 4.2 | 0.82 | 1.7 | 0.13 | 0.7 | 0.17 | 0.7 |
| E4 | 19 | 7 | 62 | 7.7 | 70 | 7.1 | 7.7 | 3 | 0.79 | 1.2 | 6.77 | 4.1 | 1.84 | 2.1 | 0.27 | 0.9 | 0.11 | 0.6 |
| no E4 | 60 | 29 | 62 | 7.2 | 70 | 6.7 | 8.25 | 3.3 | 0.7 | 1.2 | 7.2 | 4.3 | 0.5 | 1.3 | 0.08 | 0.5 | 0.19 | 0.8 |
| b | |
|---|---|
| Region | Total times region is used in analysis |
| 3rd nucleus | 28 |
| Anterior cingulate cortex | 51 |
| CA1/subiculum | 76 |
| CA2 | 72 |
| CA3-4 | 75 |
| Dentate gyrus | 73 |
| Dorsal raphe | 23 |
| Entorhinal cortex | 76 |
| Mid front gyrus | 15 |
| Periaqueductal grey | 40 |
| Substatntia nigra | 40 |
| Tectum | 40 |
ND score: neurodegeneration score, determined by [(microvacuolation + astrogliosis)/2) + neuronal loss]
Supplementary Material
Acknowledgments
This study was funded by NIH NS090934 (DMH), P01-AG03991 (DMH, JCM, AMF), P01-AG026276 (DMH, JCM, AMF), P50 AG05681 (DMH, JCM, AMF), the JPB Foundation (DMH, BAB), Cure Alzheimer’s Fund (DMH), a grant from AstraZeneca (DMH, SMP), NIH AG023501 (WWS), AG019724 (WWS), Consortium for Frontotemporal Dementia Research (WWS), Tau Consortium (WWS), NIH K08 AG052648 (SS), NIH AG051812 (OB), NS088137 (OB), National Multiple Sclerosis Society (5092A1) (OB), Nancy Davis Foundation Award (OB), Amyotrophic Lateral Sclerosis Association (ALSA2087) (OB), NIH K01 NS096719-01 (GG). We thank J. Yu for technical assistance in gene expression analysis. We thank N. Barthélemy for assistance in tau phosphorylation analysis. We thank S. Schindler for assistance in statistical analysis.
Data collection and sharing for this project was funded by the Alzheimer’s Disease Neuroimaging Initiative (ADNI) (National Institutes of Health Grant U01 AG024904) and DOD ADNI (Department of Defense award number W81XWH-12-2-0012). A full list of ADNI funding information is listed in the Supplementary Information.
D.M.H. co-founded and is on the scientific advisory board of C2N Diagnostics. He consults for Genentech, AbbVie, Eli Lilly, Proclara, Glaxosmithkline, and Denali. Washington University receives research grants to the lab of Dr. Holtzman from C2N Diagnostics, Eli Lilly, AbbVie, and Denali.
Footnotes
Supplementary Information is available in the online version of the paper.
Author contributions D.M.H., S.M.P., and Y.S. conceived the study. Y.S., K.Y., and D.M.H. designed the study. Y.S. performed the majority of experiments and analyzed the data, assisted by K.Y., K.W., G.G., L.Z, M.W.W., J.R., G.R., M.B.F., and H.J.; S.T.S., C.B., and O.B. performed the nanostring microglial gene expression assay; S.A.L. and B.A.B. performed the astrocytic gene expression assay; W.L. performed the microglia LPS stimulation assay; R.M.T., S.S., L.T.G., B.L.M., W.W.S., J.C.R., and A.L.B. performed data analysis for human primary tauopathies; J.D.A., L.M., C.S., C.X., J.C.M., A.F., and C.C. performed data analysis in human AD patients; P.M.S provided the ApoE KI mice. Y.S. and D.M.H. wrote the manuscript. All authors discussed the results and commented on the manuscript. A portion of the human Alzheimer’s disease data used in preparation of this article was obtained from the Alzheimer’s Disease Neuroimaging Initiative (ADNI) database (adni.loni.usc.edu). As such, the investigators within the ADNI contributed to the design and implementation of ADNI and/or provided data but did not participate in analysis or writing of this report. A complete listing of ADNI investigators can be found in the Supplemental Information.
Readers are welcome to comment on the online version of the paper.
References
- 1.Holtzman DM, Herz J, Bu G. Apolipoprotein E and apolipoprotein E receptors: normal biology and roles in Alzheimer disease. Cold Spring Harbor perspectives in medicine. 2012;2 doi: 10.1101/cshperspect.a006312. [DOI] [PMC free article] [PubMed] [Google Scholar]
- 2.Strittmatter WJ, et al. Apolipoprotein E: high-avidity binding to beta-amyloid and increased frequency of type 4 allele in late-onset familial Alzheimer disease. Proceedings of the National Academy of Sciences of the United States of America. 1993;90:1977–1981. doi: 10.1073/pnas.90.5.1977. [DOI] [PMC free article] [PubMed] [Google Scholar]
- 3.Josephs KA, et al. β-Amyloid Burden Is Not Associated with Rates of Brain Atrophy. Annals of Neurology. 2008;63:204–212. doi: 10.1002/ana.21223. [DOI] [PMC free article] [PubMed] [Google Scholar]
- 4.Arriagada PV, Growdon JH, Hedleywhyte ET, Hyman BT. Neurofibrillary Tangles But Not Senile Plaques Parallel Duration and Severity of Alzheimers-Disease. Neurology. 1992;42:631–639. doi: 10.1212/WNL.42.3.631. [DOI] [PubMed] [Google Scholar]
- 5.Williams DR, et al. Pathological tau burden and distribution distinguishes progressive supranuclear palsy-parkinsonism from Richardson’s syndrome. Brain. 2007;130:1566–1576. doi: 10.1093/brain/awm104. [DOI] [PubMed] [Google Scholar]
- 6.Strittmatter WJ, et al. Isoform-specific interactions of apolipoprotein E with microtubule-associated protein tau: implications for Alzheimer disease. Proceedings of the National Academy of Sciences of the United States of America. 1994;91:11183–11186. doi: 10.1073/pnas.91.23.11183. [DOI] [PMC free article] [PubMed] [Google Scholar]
- 7.Brecht WJ. Neuron-Specific Apolipoprotein E4 Proteolysis Is Associated with Increased Tau Phosphorylation in Brains of Transgenic Mice. Journal of Neuroscience. 2004;24:2527–2534. doi: 10.1523/JNEUROSCI.4315-03.2004. [DOI] [PMC free article] [PubMed] [Google Scholar]
- 8.Deming Y, et al. Genome-wide association study identifies four novel loci associated with Alzheimer’s endophenotypes and disease modifiers. Acta Neuropathol. 2017;133:839–856. doi: 10.1007/s00401-017-1685-y. [DOI] [PMC free article] [PubMed] [Google Scholar]
- 9.Mishra A, et al. Gene-based association studies report genetic links for clinical subtypes of frontotemporal dementia. Brain. 2017 doi: 10.1093/brain/awx066. [DOI] [PubMed] [Google Scholar]
- 10.Stevens M, et al. Apolipoprotein E gene and sporadic frontal lobe dementia. Neurology. 1997;48:1526–1529. doi: 10.1212/wnl.48.6.1526. [DOI] [PubMed] [Google Scholar]
- 11.Agosta F, et al. Apolipoprotein E ε4 is associated with disease-specific effects on brain atrophy in Alzheimer’s disease and frontotemporal dementia. Proceedings of the National Academy of Sciences of the United States of America. 2009;106:2018–2022. doi: 10.1073/pnas.0812697106. [DOI] [PMC free article] [PubMed] [Google Scholar]
- 12.Engelborghs S, et al. Dose dependent effect of APOE epsilon4 on behavioral symptoms in frontal lobe dementia. Neurobiol Aging. 2006;27:285–292. doi: 10.1016/j.neurobiolaging.2005.02.005. [DOI] [PubMed] [Google Scholar]
- 13.Yoshiyama Y, et al. Synapse Loss and Microglial Activation Precede Tangles in a P301S Tauopathy Mouse Model. Neuron. 2007;53:337–351. doi: 10.1016/j.neuron.2007.01.010. [DOI] [PubMed] [Google Scholar]
- 14.Simonovitch S, et al. Impaired Autophagy in APOE4 Astrocytes. Journal of Alzheimer’s Disease. 2016;51:915–927. doi: 10.3233/JAD-151101. [DOI] [PubMed] [Google Scholar]
- 15.Bales KR, et al. Human APOE isoform-dependent effects on brain beta-amyloid levels in PDAPP transgenic mice. The Journal of neuroscience: the official journal of the Society for Neuroscience. 2009;29:6771–6779. doi: 10.1523/JNEUROSCI.0887-09.2009. [DOI] [PMC free article] [PubMed] [Google Scholar]
- 16.Liddelow SA, et al. Neurotoxic reactive astrocytes are induced by activated microglia. Nature. 2017;541:481–487. doi: 10.1038/nature21029. [DOI] [PMC free article] [PubMed] [Google Scholar]
- 17.Liu X, et al. Inflammasome-activated gasdermin D causes pyroptosis by forming membrane pores. Nature. 2016;535:153–158. doi: 10.1038/nature18629. [DOI] [PMC free article] [PubMed] [Google Scholar]
- 18.Vitek MP, Brown CM, Colton CA. APOE genotype-specific differences in the innate immune response. Neurobiology of Aging. 2009;30:1350–1360. doi: 10.1016/j.neurobiolaging.2007.11.014. [DOI] [PMC free article] [PubMed] [Google Scholar]
- 19.Gale SC, et al. APOE4 is associated with enhanced in vivo innate immune responses in human subjects. The Journal of allergy and clinical immunology. 2014;134:127–134. doi: 10.1016/j.jaci.2014.01.032. [DOI] [PMC free article] [PubMed] [Google Scholar]
- 20.Zamanian JL, et al. Genomic Analysis of Reactive Astrogliosis. The Journal of Neuroscience. 2012;32:6391–6410. doi: 10.1523/JNEUROSCI.6221-11.2012. [DOI] [PMC free article] [PubMed] [Google Scholar]
- 21.Farrer LA, et al. Allele epsilon 4 of apolipoprotein E shows a dose effect on age at onset of Pick disease. Exp Neurol. 1995;136:162–170. doi: 10.1006/exnr.1995.1093. [DOI] [PubMed] [Google Scholar]
- 22.Huang Y, et al. Apolipoprotein E fragments present in Alzheimer’s disease brains induce neurofibrillary tangle-like intracellular inclusions in neurons. Proc Natl Acad Sci U S A. 2001;98:8838–8843. doi: 10.1073/pnas.151254698. [DOI] [PMC free article] [PubMed] [Google Scholar]
- 23.Yuan P, et al. TREM2 Haplodeficiency in Mice and Humans Impairs the Microglia Barrier Function Leading to Decreased Amyloid Compaction and Severe Axonal Dystrophy. Neuron. 2016;90:724–739. doi: 10.1016/j.neuron.2016.05.003. [DOI] [PMC free article] [PubMed] [Google Scholar]
- 24.Wang Y, et al. TREM2-mediated early microglial response limits diffusion and toxicity of amyloid plaques. J Exp Med. 2016;213:667–675. doi: 10.1084/jem.20151948. [DOI] [PMC free article] [PubMed] [Google Scholar]
- 25.Yanamandra K, et al. Anti-tau antibodies that block tau aggregate seeding invitro markedly decrease pathology and improve cognition in vivo. Neuron. 2013;80:402–414. doi: 10.1016/j.neuron.2013.07.046. [DOI] [PMC free article] [PubMed] [Google Scholar]
- 26.Butovsky O, et al. Identification of a unique TGF-beta-dependent molecular and functional signature in microglia. Nat Neurosci. 2014;17:131–143. doi: 10.1038/nn.3599. [DOI] [PMC free article] [PubMed] [Google Scholar]
- 27.Butovsky O, et al. Targeting miR-155 restores abnormal microglia and attenuates disease in SOD1 mice. Ann Neurol. 2015;77:75–99. doi: 10.1002/ana.24304. [DOI] [PMC free article] [PubMed] [Google Scholar]
- 28.Grinberg LT, et al. Argyrophilic grain disease differs from other tauopathies by lacking tau acetylation. Acta Neuropathol. 2013;125:581–593. doi: 10.1007/s00401-013-1080-2. [DOI] [PMC free article] [PubMed] [Google Scholar]
- 29.Hyman BT, et al. National Institute on Aging-Alzheimer’s Association guidelines for the neuropathologic assessment of Alzheimer’s disease. Alzheimers Dement. 2012;8:1–13. doi: 10.1016/j.jalz.2011.10.007. [DOI] [PMC free article] [PubMed] [Google Scholar]
Associated Data
This section collects any data citations, data availability statements, or supplementary materials included in this article.
Supplementary Materials
Data Availability Statement
Source data of graphs plotted in Figs 1, 2, 3, 4 and Extended Data Figs 1, 2, 3, 4, 5, 6 are available as Source Data files. Other data are available from the corresponding author upon reasonable request. Nanostring gene list, gene pathway analysis, and fully scanned western blot gels can be found in the Supplementary Information.


