Abstract
Aims
Activation of the NAD+ dependent protein deacetylase SIRT1 has been proposed as a therapeutic strategy to treat mitochondrial dysfunction and insulin resistance in skeletal muscle. However, life-long overexpression of SIRT1 in skeletal muscle does not improve parameters of mitochondrial function and insulin sensitivity. In this study we investigated whether temporal overexpression of SIRT1 in muscle of adult mice would affect skeletal muscle mitochondrial function and insulin sensitivity.
Methods
To circumvent potential effects of germline SIRT1 overexpression, we utilized an inducible model of SIRT1 overexpression in skeletal muscle of adult mice (i-mOX). Insulin sensitivity was assessed by 2-deoxyglucose uptake, muscle maximal respiratory function by high-resolution respirometry and systemic energy expenditure was assessed by whole body calorimetry.
Results
Although SIRT1 was highly, and specifically, overexpressed in skeletal muscle of i-mOX compared to WT mice, glucose tolerance and skeletal muscle insulin sensitivity were comparable between genotypes. Additionally, markers of mitochondrial biogenesis, muscle maximal respiratory function and whole body oxygen consumption were also unaffected by SIRT1 overexpression.
Conclusion
These results support previous work demonstrating that induction of SIRT1 in skeletal muscle, either at birth or in adulthood, does not impact muscle insulin action or mitochondrial function.
Keywords: Glucose uptake, Insulin signaling, Respirometry, Tamoxifen
Introduction
The NAD+-dependent protein deacetylase sirtuin 1 (SIRT1) is proposed to link changes in cellular energy status to adaptive changes in insulin signaling and mitochondrial function1. This occurs through SIRT1-mediated deacetylation of proteins such as histones, metabolic enzymes and transcriptional regulators, thereby altering their subcellular localization or activity2. During calorie restriction (CR), SIRT1 activity is enhanced in skeletal muscle3, and is required for the beneficial effects of CR on insulin-stimulated glucose uptake4. Analogous to this, systemic overexpression of SIRT1 in mice recapitulates metabolic alterations observed during CR, such as reduced fat mass and improved glucose tolerance5,6. Additionally, pharmacological activation of SIRT1 increases mitochondrial biogenesis in skeletal muscle and improves systemic glucose homeostasis in mice7–9. To better define the specific contribution of skeletal muscle SIRT1 to these beneficial metabolic effects, we developed a muscle-specific SIRT1 overexpressing (mOX) mouse model10. Interestingly, in this mOX model we found no effects on muscle insulin sensitivity, maximal mitochondrial respiration or whole body metabolic rate in chow- or high fat diet-fed mice10,11. This contrasts with a number of studies demonstrating that treatment of adult rodents with small molecule activators of SIRT1 enhances muscle insulin sensitivity and respiratory capacity7–9. A reason for these contrasting findings could be due to the fact that SIRT1 overexpression occurs during development in mOX mice. With this in mind, we generated a mouse model with inducible, muscle-specific overexpression of SIRT1 (i-mOX), thus allowing temporal induction of SIRT1 overexpression in fully developed, adult skeletal muscle. We hypothesized that temporally induction of SIRT1 overexpression in adult muscle would enhance muscle insulin sensitivity and mitochondrial function.
Results
Mouse model
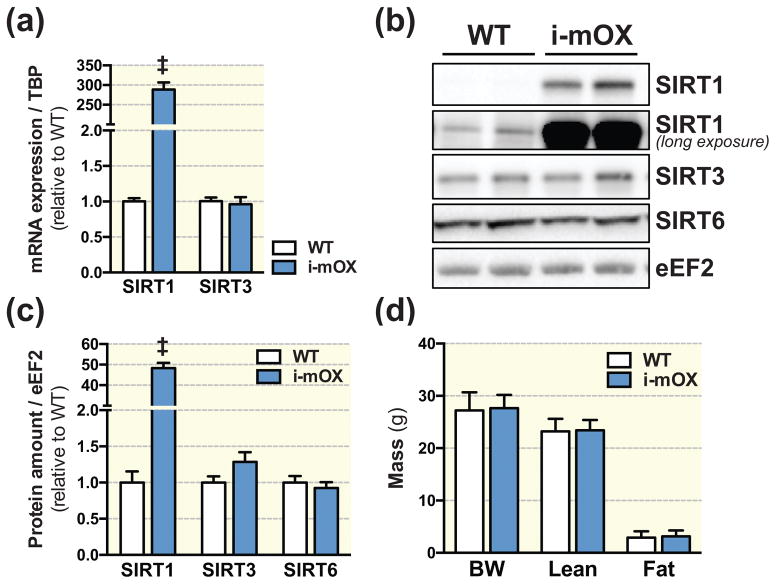
Relative Sirt1 transcript levels were ~280 fold higher in skeletal muscle from i-mOX compared to WT mice, while Sirt3 mRNA levels were unchanged (Fig. 1A). Similarly, SIRT1 protein levels were increased approximately 50-fold in i-mOX vs. WT muscle; the protein levels of the related family members, SIRT3 and SIRT6, were unchanged between genotypes (Fig. 1B and C). There were no genotype differences in body weight, fat mass or lean mass (Fig. 1D), nor were there differences in skeletal muscle, (gastrocnemius, tibialis anterior, quadriceps, triceps), heart, liver or epididymal fat pad mass (Table 1).
Figure 1. Mice with inducible muscle-specific overexpression of SIRT1 (i-mOX) show increased levels of SIRT1 in skeletal muscle.
(A) Transcript levels of Sirt1 and Sirt3, in skeletal muscle from WT and i-mOX mice (n=6). (B) Representative blot of SIRT1, SIRT3 and SIRT6 protein levels in skeletal muscle from WT and i-mOX mice. (C) Quantification of SIRT1, SIRT3 and SIRT6 levels in skeletal muscle (n=7). (D) Body weight (BW), lean mass and fat mass in i-mOX and WT mice (n=7–9). Data reported as means ± SEM. ‡P < 0.001 compared to WT.
Table 1.
| Tissue | WT | i-mOX |
|---|---|---|
| GA | 126.8 ± 13.6 | 126.6 ± 11.4 |
| TA | 44.5 ± 5.0 | 43.0 ±3.7 |
| QUAD | 187.4 ± 21.9 | 185.9 ± 19.9 |
| TRI | 128.0 ± 9.9 | 121.0 ± 14.0 |
| Heart | 113.7 ± 7.4 | 111.2 ± 13.1 |
| Liver | 1224.2 ± 88.9 | 1260.7 ± 138.5 |
| eWAT | 459.4 ± 172.6 | 449.4 ± 181.6 |
Glucose homeostasis
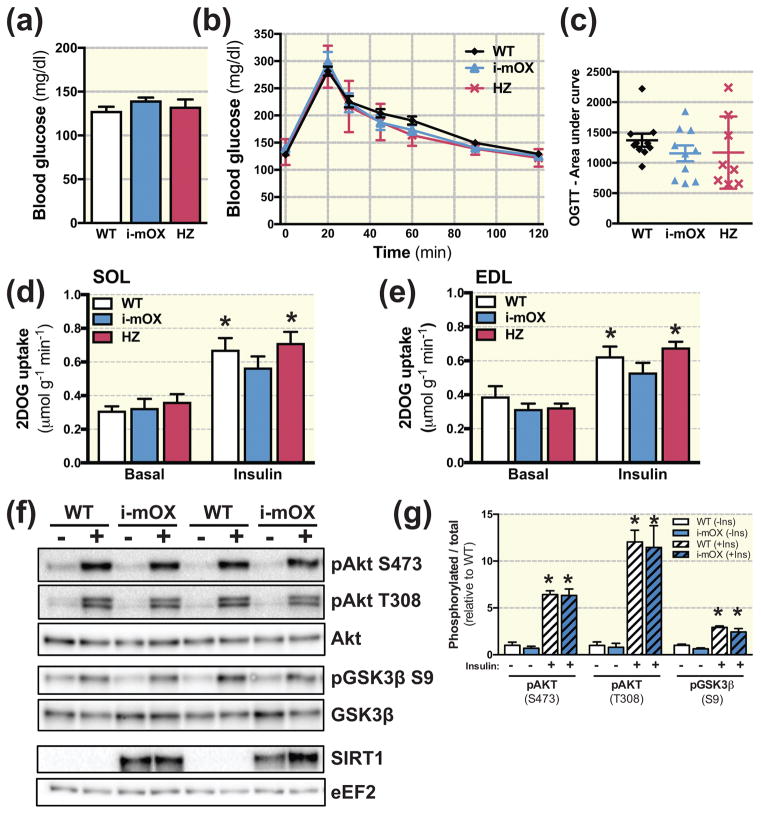
Fasting blood glucose concentrations were not different between i-mOX, heterozygous (HZ) and WT mice (Fig. 2A), nor was the glycemic response to an oral glucose tolerance test (OGTT) (Fig. 2B and C). To assess effects on skeletal muscle insulin sensitivity, we measured ex-vivo basal and insulin-stimulated glucose uptake in soleus and extensor digitorum longus (EDL) muscles using a physiological insulin concentration (0.36 nM). While insulin stimulation increased 2-deoxy-glucose uptake (2DOGU) in soleus (Fig. 2D) and EDL (Fig. 2E) above basal, there were no genotype differences in insulin-stimulated 2DOGU (i.e. insulin 2DOGU - basal 2DOGU) in either muscle (Fig. 2D and E). In line with this, insulin-stimulated phosphorylation of Akt (S473 and T308) and GSK3β (S9) were not different between i-mOX and WT mice (Fig. 2F and G).
Figure 2. Unaltered insulin sensitivity in skeletal muscle with SIRT1 overexpression.
(A) Blood glucose concentration in tail-vein blood sample of i-mOX, HZ and WT mice after a 3h fast (n=10). (B) Blood glucose concentration during an oral glucose tolerance test (OGTT). Mice were gavaged with 2g/kg body weight dextrose. (C) Scatter plot show area under the curve for OGTT experiment (n=10). (D–E) 2-deoxyglucose (2DOG) uptake in soleus (SOL) or Extensor digitorum longus (EDL) muscles, in the basal state or in response to insulin stimulation. (SOL, n=7–8; EDL, n=6–9). (F) Representative blot of Akt and Akt phosphorylated on S473 and T308, as well as GSK3β and GSK3β phosphorylated on S9. (G) Bar graph shows quantification of phosphorylated Akt and GSK3β relative to total protein levels of Akt and GSK3β (n=4 basal and 4 insulin-stimulated per genotype). Data reported as means ± SEM. *P < 0.05 compared to WT. *P < 0.05 main effect of Insulin compared to Basal.
Metabolic proteins in skeletal muscle
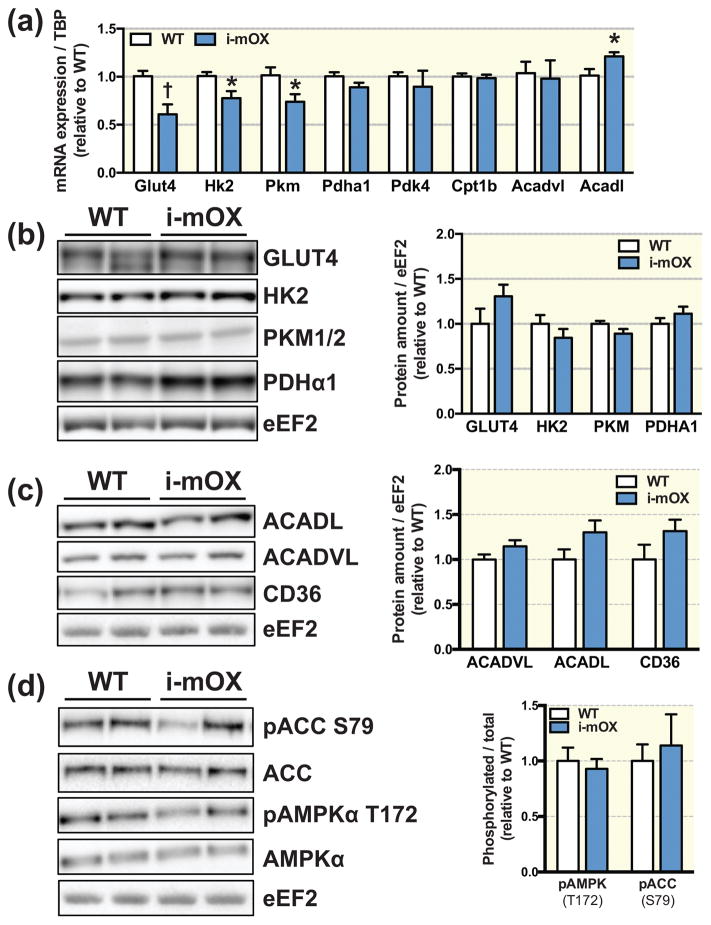
Relative transcript abundance of the glucose transporter Slc2a4 (Glut4), and the glycolytic enzymes, hexokinase 2 (Hk2) and pyruvate kinase isoenzyme M1 (Pkm) was significantly lower in i-mOX compared to WT mice, while Pyruvate dehydrogenase E1 component subunit alpha (Pdha1) was not different (Fig. 3A). However, protein levels of GLUT4, HK2, PKM1/2 and PDHα1 in muscle were unchanged between genotypes (Fig. 3B). Pyruvate dehydrogenase kinase 4 (Pdk4), carnitine O-palmitoyltransferase 1b (Cpt1b) and acyl-CoA dehydrogenase, very long chain (Acadvl) mRNA abundance was similar between genotypes, while transcript levels of acyl-CoA dehydrogenase, long chain (Acadl) were significantly increased in i-mOX compared to WT mice (Fig. 3A). However, there were no genotype differences for ACADL, ACADVL or fatty acid transporter CD36 protein abundance (Fig. 3C). Moreover, phosphorylation of AMP-activated protein kinase, alpha (AMPKα) (T172) and downstream target acetyl-CoA carboxylase (ACC) (S79), were similar i-mOX and WT mice (Fig. 3D).
Figure 3. Unchanged levels of metabolic proteins in skeletal muscle of i-mOX mice compared to WT mice.
(A) Transcript levels of proteins involve in glucose oxidation (Glut4, Hk2, Pkm, Pdha1) and fatty acid oxidation (Pdk4, Cpt1b, Acadvl, Acadl) in skeletal muscle from WT and i-mOX mice (n=6). (B–C) Representative blot of (B) GLUT4, HK2, PKM1/2, PDHα1, (C) ACADL, ACADVL and CD36 levels in skeletal muscle from WT and i-mOX mice. Bar graphs show quantification of protein levels in skeletal muscle relative to eEF2 (n=7). (D) Representative blot of ACC and ACC phosphorylated on S79, as well as AMPKα and AMPKα phosphorylated on T172. Bar graph shows quantification of phosphorylated ACC and AMPKα relative to total protein levels of ACC and AMPKα (n=7). Data reported as means ± SEM. †P < 0.01, *P < 0.05 compared to WT.
Whole-body energy expenditure and substrate oxidation
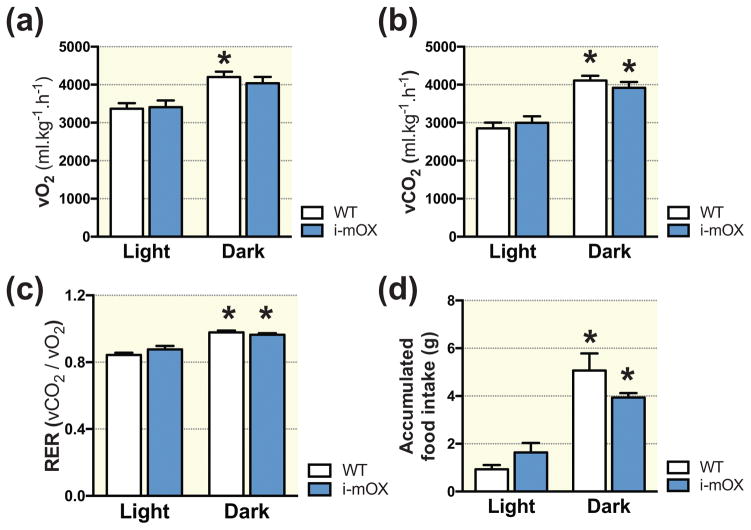
There were no differences in diurnal rhythms of oxygen consumption (Fig. 4A), carbon dioxide output (Fig. 4B), respiratory exchange ratio (RER) (Fig. 4C) and food intake (Fig. 4D) between WT and i-mOX mice.
Figure 4. Similar whole body energy expenditure in i-mOX compared to WT mice.
(A) Whole body oxygen consumption (VO2), (B) carbon dioxide production (VCO2), (C) respiratory exchange ratio (RER; VCO2/VO2) and (D) food intake during light and dark phases recorded over 48 hours (n=5–7). Data reported as means ± SEM. *P < 0.05 compared to Light.
Skeletal muscle mitochondrial markers and function
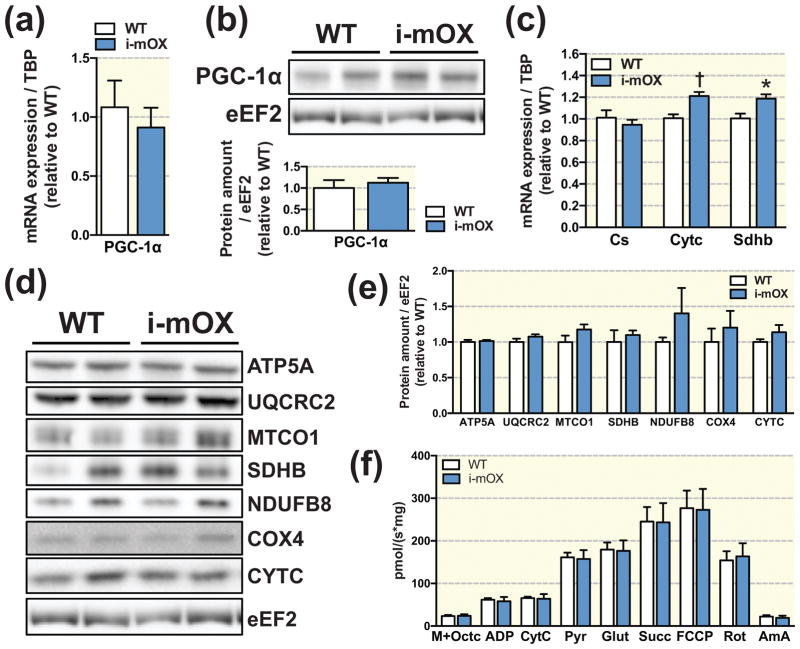
Relative mRNA expression and protein levels of the transcriptional co-activator PGC-1α were not changed between i-mOX and WT mice (Fig. 5A and B). In i-mOX compared to WT mice, relative expression of the mitochondrial electron transport chain components, cytochrome C (Cytc) and succinate dehydrogenase iron-sulfur subunit (Sdhb) were increased, while citrate synthase (Cs) expression was unchanged (Fig. 5C). At the protein level, however, there were no differences between i-mOX and WT mice for any of the mitochondrial proteins tested; ATP synthase subunit 5 alpha (ATP5A), ubiquinol-cytochrome c reductase core protein 2 (UQCRC2), cytochrome c oxidase I (MTCO1), SDHB, NADH:Ubiquinone oxidoreductase subunit B8 (NDUFB8), cytochrome c oxidase IV (COX4) or CYTC (Fig. 5D and E). In line with a lack of effect on markers of mitochondrial biogenesis, maximal respiration (as assessed by high-resolution respirometry in isolated muscle fiber bundles) in the presence of malate, octanoylcarnitine, pyruvate, ADP, glutamate and succinate was not different between genotypes (Fig. 5F).
Figure 5. SIRT1 overexpression in muscle does not alter markers of mitochondrial biogenesis.
(A) Transcript and (B) protein levels of PGC-1α in skeletal muscle of WT and i-mOX mice. Bar graph shows quantification of protein levels in skeletal muscle relative to eEF2 (n=7). (C) Transcript levels of mitochondrial proteins Cs, Cytc and Sdhb in skeletal muscle (n=6). (D) Representative blot of mitochondrial proteins in skeletal muscle from WT and i-mOX mice. (E) Quantification of mitochondrial protein expression in skeletal muscle relative to eEF2 (n=7). (F) Respiratory flux normalized to muscle weight in the presence of malate + octanoylcarnitine (M+Octc; leak respiration in the absence of adenylates), ADP, cytochrome c (CytC; mitochondrial integrity), pyruvate (Pyr; respiration in the presence of pyruvate, octanoylcarnitine and adenylates), glutamate (Glut; complex I (CI) capacity), succinate (Succ; complex I + complex II (CII) capacity), FCCP (maximal respiration), rotenone (Rot; complex II capacity), and Antimycin A (AmA; residual oxygen consumption) (n=6–7). Data reported as means ± SEM. †P < 0.01, *P < 0.05 compared to WT.
Muscle fiber area and fiber type
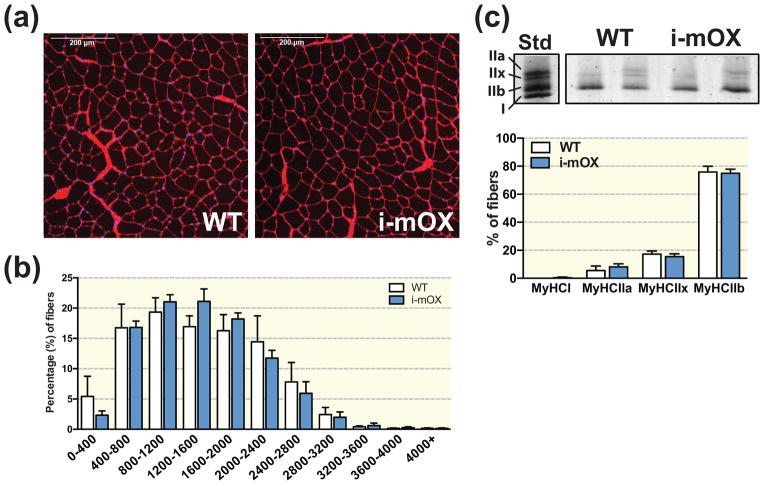
Muscle morphology (Fig. 6A), muscle fiber cross sectional area (CSA) and distribution (Fig. 6B), and myosin heavy chain (MyHC) composition (Fig. 6C) was not different between i-mOX and WT mice.
Figure 6. SIRT1 overexpression in muscle does not alter fiber cross sectional area (CSA) or myosin heavy chain (MyHC) distribution.
(A) Wheat germ agglutinin (WGA) stained cross-sections of tibialis anterior muscle from WT and i-mOX mice. (B) Distribution of fiber CSAs (μm2) presented as percent (%) fibers within each size category (n=4). (C) Visualization of the MyHC types in quadriceps muscle. Bar graph shows quantification of MyHC band intensities (n=6). Data reported as means ± SEM.
Discussion
SIRT1 activation is a proposed strategy for the treatment of metabolic disorders, such as type 2 diabetes (T2D)12,13. Pharmacological activation of SIRT1 improves insulin sensitivity, mitochondrial biogenesis and confers beneficial metabolic effects in animal models of obesity and T2D14–16. However, how SIRT1 regulates these parameters in skeletal muscle are unclear17, and there is conflicting evidence on whether activation of SIRT1 in skeletal muscle promotes systemic metabolic effects18. For instance, germline overexpression of SIRT1 in muscle does not improve glucose uptake or insulin sensitivity in muscle of young, chow fed or HFD fed mice10,11. Given it is possible that germline activation of SIRT1 in these mice is masking the effect of SIRT1 overexpression in muscle on metabolic parameters, we generated and studied a mouse model that allowed temporal induction of SIRT1 overexpression in adult skeletal muscle (i.e. after development). In line with our previous studies10,11, and other models with SIRT1 overexpression in muscle19, temporal overexpression of SIRT1 in adult mice does not affect muscle insulin sensitivity, mitochondrial biogenesis in skeletal muscle, or whole-body energy expenditure. While we did not assess SIRT1 activity in the present study, it is important to note that we10,11 and others20 have previously demonstrated that increased SIRT1 protein abundance in skeletal muscle is closely associated with elevated deacetylase enzyme activity. Importantly, mice with a HZ overexpression of SIRT1 in skeletal muscle do not show any differences in glucose tolerance or skeletal muscle insulin sensitivity compared to WT or i-mOX mice, indicating that dosing of SIRT1 protein levels in muscle does not explain the lack of effect on these parameters.
SIRT1 activation by pharmacological activators (i.e. resveratrol, SRT1720) improves glucose homeostasis and insulin sensitivity in obese rodents and humans7–9,21. Similar results have been achieved by increasing SIRT1 activity via elevated cellular NAD+ levels (i.e. PARP1/2 inhibition, nicotinamide riboside (NR) supplementation)22–24. Likewise, whole body overexpression of SIRT1 protects against ageing- or HFD-induced glucose intolerance in mice5,6,25. While SIRT1 activation improves glucose homeostasis in these studies, this effect could be due to improvements in adipose tissue or liver metabolism (or other tissues, such as the pancreas or brain)26–28, rather than a direct effect of SIRT1 activation in skeletal muscle5,6. Supporting this notion, the protective effect of SIRT1 gain-of-function during HFD-induced insulin resistance was dependent on suppression of hepatic glucose output, rather than improved glucose disposal6. Moreover, the beneficial metabolic effects of whole body overexpression of SIRT1 manifest in mice lacking SIRT1 overexpression in skeletal muscle27. Thus, while there are clearly beneficial effects of SIRT1 activation on glucose tolerance, skeletal muscle SIRT1 does not primarily drive these effects.
These findings raise an important question; is skeletal muscle the main organ responsible for mediating the beneficial effects of SIRT1 activation on glucose homeostasis? Apart from skeletal muscle, SIRT1 is highly expressed in other organs important to the regulation of systemic glucose homeostasis, such as liver, brain and pancreas29. Importantly, glucose tolerance in aged or HFD fed mice was improved when SIRT1 was overexpressed specifically in liver30, white adipose tissue31 or pancreatic β-cells28. Moreover, systemic glucose tolerance is improved in a mouse model where SIRT1 is overexpressed in adipose tissue and brain, but not in skeletal muscle or liver27. Interestingly, a study by Ramadori et al. found that overexpression of SIRT1 in steroidogenic factor 1 (SF1) neurons in the hypothalamus improves skeletal muscle insulin sensitivity26. This suggests that central regulation of glucose metabolism could be a mechanism by which pharmacological SIRT1 activation modulates skeletal muscle glucose handling. However, additional studies are required to investigate this aspect further, since a whole brain SIRT1 knockout also improved systemic insulin signaling32. Regardless, in light of our current study, previous results from our lab10,11, and studies by others6,27, it is apparent that skeletal muscle SIRT1 is not a primary contributor to systemic glucose metabolism.
SIRT1 activates important regulators of mitochondrial biogenesis, such as AMPK33,34 and PGC-1α35,36, and is thus considered to be a central regulator of mitochondrial biogenesis17,37. For example, activation of SIRT1 through pharmacological activators or elevated cellular NAD+ levels increases skeletal muscle mitochondrial biogenesis7,9,22–24. Similarly, mice with a whole-body overexpression of SIRT1 display increased mitochondrial biogenesis and elevated respiration in skeletal muscle38. Additionally, muscle-specific overexpression of SIRT1 increased levels of some electron transport chain proteins11,39. In contrast, our results indicate that temporal overexpression of SIRT1 in adult skeletal muscle does not increase whole body metabolic rate, markers of mitochondrial biogenesis or the respiratory capacity of permeabilized muscle fiber bundles. These findings are supported by previous studies in the field, where SIRT1 gain-of-function models showed either no effect5,19 or negative effects on mitochondrial biogenesis in skeletal muscle20,40. It is difficult to pinpoint the reason for the discrepancies between these studies, but timing of the SIRT1 overexpression might play a role in the differential response. This is underscored by the fact that constitutive gain-of-function models display elevated markers of mitochondrial biogenesis in muscle11,38, while models with temporal overexpression of SIRT1 for either 1 week19, 2 weeks20,40 or 4–6 weeks (this study) do not. Pharmacological activation of SIRT1 also elevates systemic energy expenditure8,9, which was not replicated in our study. To us, this indicates that activation of muscle SIRT1 does not directly modulate energy expenditure in sedentary mice, and that such effects seen with pharmacological activation of SIRT1 occur via SIRT1 activation in other tissues. Another explanation could be that “off-target” effects could mediate the metabolic and mitochondrial outcomes of pharmacological SIRT1-activators. For instance, resveratrol activates AMPK signaling in muscle38,40, which is a nutrient-sensing signaling node important for mitochondrial and metabolic gene transcription41.
In summary, we demonstrate that temporal overexpression of SIRT1 in skeletal muscle of adult mice does not improve insulin sensitivity or mitochondrial biogenesis in muscle. These findings are in line with our previous studies10,11, and other whole-body models6, and support the hypothesis that SIRT1 in skeletal muscle plays a minor role in mediating the beneficial metabolic effects elicited by systemic SIRT1 activation. Thus, it will be of benefit for future studies to elucidate the tissue(s) that contribute to beneficial health effects seen in skeletal muscle as a result of whole-body SIRT1 activation.
Materials and Methods
Animals
All studies were conducted on male mice on a C57Bl/6 background kept in a conventional facility with a 12 hour light/12 hour dark cycle. Mice had free access to food and water unless otherwise noted. Inducible, skeletal muscle-specific SIRT1 overexpressing (i-mOX) mice were generated by crossing mice with a tamoxifen (TMX)-inducible Cre recombinase (Cre) expressed under the human α-skeletal actin (HSA) promoter42 (kindly provided by K. Esser, University of Florida, Gainesville, FL, USA) with mice carrying a floxed stop element upstream of the Sirt1 gene43 (kindly provided by D. A. Sinclair, Harvard Medical School, Boston, MA, USA). At twelve weeks of age, TMX (2mg) was administered via gavage to floxed Cre-negative (WT) and Cre-positive floxed homozygous (i-mOX) and heterozygous (HZ) mice for five consecutive days. Oral glucose tolerance test (OGTT), whole body respirometry and ex vivo 2-deoxyglucose uptake (2DOGU) assays were performed 4–6 weeks after the initial TMX treatment. During 2DOGU experiments, tissues were excised from 4 hour fasted animals and snap frozen in liquid nitrogen. The tibialis anterior muscle was pinned on cork and frozen in liquid-nitrogen cooled isopentane for histological analysis. All experiments were approved by and conducted in accordance with the Animal Care Program at the University of California, San Diego.
OGTT
Fasted (4 h) mice were orally gavaged with 2 g of dextrose per kg body weight, and blood glucose was measured in tail vein blood at 0 (before gavage), 20, 30, 45, 60, 90 and 120 min using a standard handheld glucose meter. Area under the glucose curve (AUC) was calculated using Prism 6 (GraphPad Software Incorporated, La Jolla, CA, USA), and was calculated from baseline (i.e., time ‘0’).
2DOGU
Ex vivo 2-deoxy glucose uptake (2DOGU) assay was performed as previously described11. The insulin concentration for insulin-treated muscles was 0.36nM (60μU/ml) (Humulin R; Eli Lilly, Indianapolis, IN, USA). Frozen SOL and EDL muscles were weighed, homogenized and 2DOGU was calculated as previously described4.
Energy expenditure and body composition
Whole body metabolism was assessed through indirect calorimetry, using the Comprehensive Lab Animals Monitoring System (Columbus Instruments, Columbus, OH, USA). Mice were housed in the CLAMS system for 3 consecutive days, and whole body oxygen consumption (VO2), carbon dioxide production (VCO2), respiratory exchange ratio (RER) and food intake was continuously monitored. The first day was considered acclimatization, and values were averaged for the dark and light phases on day 2 and 3. Body composition was measured using an EchoMRI-100TM analyzer (EchoMRI Medical Systems, Houston, TX, USA).
Immunoblotting
Equal amounts of proteins were separated using SDS-PAGE under reducing conditions. Proteins of interest were detected using the following antibodies; SIRT1 (S5196, Sigma-Aldrich), SIRT3 (5490S, Cell signaling), SIRT6 (GTX105611, Gene Tex), GLUT4 (sc53566, Santa Cruz Biotechnology), HK2 (2857, Cell signaling), PKM1/2 (3190, Cell signaling), PDHA1 (3205, Cell signaling), ACADVL (ab155138, Abcam), ACADL (ab82853, Abcam), CD36 (ABM-5525, Cascade Bioscience), AMPKα (G. Hardie, University of Dundee, Dundee, Scotland, UK), pAMPKα T172 (2531, Cell signaling), ACC (3661, Cell signaling), pACC S79 (3662, Cell signaling), PGC-1α (3242, EMD Millipore), ATP5A, UQCRC2, MTCO1, SDHB, NDUFB8 (MS604, MitoSciences), COX4 (4850P, Cell signaling), CYTC (11940, Cell signaling), eEF2 (2332, Cell signaling), Akt2 (2964, Cell signaling), pAkt S473 (9271, Cell signaling), pAkt T308 (9275, Cell signaling), GSK3α/β (5676, Cell signaling), pGSK3α/β S21/S9 (9331, Cell signaling). Densitometric analysis of immunoblots was performed on four or seven individual samples using Image Lab Software (Bio-Rad Laboratories), and a representative selection is presented in each figure.
Respirometry in permeabilized muscle bundles
High-resolution respirometry was performed using an Oroboros O2K Oxygraph (Oroboros Instruments, Innsbruck, Austria), as previously described in44, with minor modifications. Fibers from the tibialis anterior muscle were preserved in biopsy preservation solution (BIOPS), and were mechanically separated and permeabilized with 50mg/ml Saponin for 20 min. Respiratory data were collected at 37°C in hyper oxygenated (200–400μM) conditions. After normalization of basal respiration in muscle fiber bundles, a substrate-uncoupler-inhibitor titration (SUIT) was performed. Respiration was measured in response to a mixed fatty acid and pyruvate oxidation SUIT (0.5mM malate + 0.2mM Octanoylcarnitine (M+Oct), 2.5mM ADP, 10μM cytochrome c (CytC), 5mM pyruvate (Pyr), 10mM glutamate (Glut), 10mM succinate (Succ), 1μM carbonyl cyanide-4-(trifluoromethoxy)phenylhydrazone (FCCP), 0.5μM rotenone (Rot) and 2.5μM Antimycin A (AmA), which were added sequentially and in the order presented. Respiration was normalized to the wet weight of the muscle fiber bundled used.
RNA extraction and RT-PCR
Total RNA was isolated from snap-frozen gastrocnemius muscle using TRIzol Reagent (ThermoFisher Scientific). RNA concentration was adjusted, and 1 μg of total RNA was used for cDNA synthesis. Semi quantitative real-time PCR analysis was performed using iTaq™ SYBR Green master mix (Bio Rad) on a CFX384 Touch™ real-time PCR system (Bio Rad). Relative expression levels for each gene of interest were calculated with the ΔΔCt method, using Tbp as normalization control. Primer sequences used in this study; Sirt1, FWD 5′-GGCCTAATAGACTTGCAAAGGA-3′, REV 5′-CTCAGCACCGTGGAATATGTAA-3′; Sirt3, FWD 5′-GTTCTGAGTCCTCGAAGGAAAG -3′, REV 5′-AGATCCAGCAGTTCTTGTGTC-3′; Glut4, FWD 5′-CTTAGGGCCAGATGAGAATGAC-3′, REV 5′-ACAGGGAAGAGAGGGCTAAA-3′; Hk2, FWD 5′-GCTGGAGGTTAAGAGAAGGATG-3′, REV 5′-TGGAGTGGCACACACATAAG-3′; Pkm, FWD 5′-CATCTGTACCGTGGCATCTT-3′, REV 5′-CAACATCCATGGCCAAGTTTAC-3′; Pdha1, FWD 5′-AGAGAGGATGGGCTCAAGTA-3′, REV 5′-CAAGTGACAGAAACCACGAATG-3′; Pdk4, FWD 5′-GAAGCTGATGACTGGTGTATCC-3′, REV 5′-GACCCACTTTGATCCCGTAAA-3′; Cpt1b, FWD 5′-ATTCTGTGCGGCCCTTATT-3′, REV 5′-TGACTTGAGCACCAGGTATTT-3′; Acadvl, FWD 5′-CTTTGCAGGGACTCAAGGAA-3′, REV 5′-CAAGCGAGCATACTGGGTATTA-3′; Acadl, FWD 5′-CTCAGGACACAGCAGAACTATT-3′, REV 5′-GCTCTTGCATGAGGTAGTAGAA-3′; Pgc-1α, FWD 5′-AGCCGTGACCACTGACAACGAG-3′, REV 5′-GCTGCATGGTTCTGAGTGCTAAG-3′; Cs, FWD 5′-TCCTGGTCGTTTGGCTTTATC-3′, REV 5′-GTTCCGTGCCAGAGCATATT-3′; Cytc, FWD 5′-GAGGATACCCTGATGGAGTATTTG-3′, REV 5′-GCTATTAGGTCTGCCCTTTCTC-3′; Sdhb, FWD 5′-CTGCCACACCATCATGAACT-3′, REV 5′-CTTGTAGGTCGCCATCATCTTC-3′; Tbp, FWD 5′-GGGATTCAGGAAGACCACATAG-3′, REV 5′-CCTCACCAACTGTACCATCAG-3′.
Histological analysis
Muscle fiber cross sectional area (CSA) was measured in 10μm cross sections cut from the mid-belly of frozen tibialis anterior muscle. Sections were stained using fluorescently labeled wheat germ agglutinin (WGA) to visualize the outlines of muscle fibers45. Briefly, muscle sections were fixed in Formalde-Fresh (Fisher Scientific) for 15 minutes at 37C, washed in PBS and subsequently incubated with 5μg/mL Alexa Fluor 488 conjugated WGA (ThermoFisher Scientific) for 10 minutes. Slides were cover-slipped with VECTASHIELD HardSet Antifade Mounting Medium with DAPI (Vector Laboratories). Tile scan images were acquired and fiber CSAs were counted automatically using a custom-written macro in ImageJ (National Institutes of Health, Bethesda, MD, USA) as described in44. Six randomly selected fields were analyzed in sections from four mice per genotype, and all experiments were performed in a blinded fashion.
Fiber type
Muscle fiber type was determined in quadriceps by assessment of myosin heavy-chain composition, as previously described11,46.
Statistics
Data was analyzed using an unpaired Student’s t-test, 1- or 2-way ANOVA (using repeated measurement when needed), followed by a Tukey’s post hoc analysis, with significant differences at p<0.05. Statistical analyses were performed using Prism 6 (GraphPad Software Incorporated, La Jolla, CA, USA). All data are expressed as mean ±SEM.
Acknowledgments
The authors are grateful to Chandra Inglis and Sarah Nalbandian for assistance with mouse studies. We also thank the UC San Diego Animal Care Program Phenotyping Core for Comprehensive Lab Animals Monitoring System measurements, Dr. Jianhua Shao (Department of Pediatrics, University of California, San Diego, CA, USA) for use of the magnetic resonance imaging machine and Mary Esparza (Department of Orthopaedic Surgery, University of California, San Diego, CA, USA) for technical assistance with myosin heavy chain quantifications. This work was supported in part by U.S. National Institutes of Health grants R01 AG043120 (to S.S.) and T32 AR060712 (to V.F.M.), a postdoctoral fellowship from the Swiss National Science Foundation (to K.S.), a postdoctoral fellowship from the UC San Diego Frontiers of Innovation Scholars Program (to S.S. and S.A.L.), Graduate Student Research Support from the UC San Diego Institute of Engineering in Medicine and the Office of Graduate Studies (V.F.M.)
References
- 1.Chalkiadaki A, Guarente L. Sirtuins mediate mammalian metabolic responses to nutrient availability. Nat Rev Endocrinol. 2012;8:287–296. doi: 10.1038/nrendo.2011.225. [DOI] [PubMed] [Google Scholar]
- 2.Cantó C, Auwerx J. Targeting sirtuin 1 to improve metabolism: all you need is NAD(+)? Pharmacol Rev. 2012;64:166–87. doi: 10.1124/pr.110.003905. [DOI] [PMC free article] [PubMed] [Google Scholar]
- 3.Chen D, Bruno J, Easlon E, Lin SJ, Cheng HL, Alt FW, Guarente L. Tissue-specific regulation of SIRT1 by calorie restriction. Genes Dev. 2008;22:1753–7. doi: 10.1101/gad.1650608. [DOI] [PMC free article] [PubMed] [Google Scholar]
- 4.Schenk S, McCurdy CE, Philp A, Chen MZ, Holliday MJ, Bandyopadhyay GK, Osborn O, Baar K, Olefsky JM. Sirt1 enhances skeletal muscle insulin sensitivity in mice during caloric restriction. J Clin Invest. 2011;121:4281–4288. doi: 10.1172/JCI58554. [DOI] [PMC free article] [PubMed] [Google Scholar]
- 5.Pfluger PT, Herranz D, Velasco-Miguel S, Serrano M, Tschöp MH. Sirt1 protects against high-fat diet-induced metabolic damage. Proc Natl Acad Sci U S A. 2008;105:9793–8. doi: 10.1073/pnas.0802917105. [DOI] [PMC free article] [PubMed] [Google Scholar]
- 6.Banks AS, Kon N, Knight C, Matsumoto M, Gutiérrez-Juárez R, Rossetti L, Gu W, Accili D. SirT1 gain of function increases energy efficiency and prevents diabetes in mice. Cell Metab. 2008;8:333–41. doi: 10.1016/j.cmet.2008.08.014. [DOI] [PMC free article] [PubMed] [Google Scholar]
- 7.Milne J, Lambert P, Schenk S, Carney D, Smith J, Gagne D, Jin L, Boss O, Perni R, Vu C, Bemis J, Xie R, Disch J, Ng P, Nunes J, Lynch A, Yang H, Galonek H, Israelian K, et al. Small molecule activators of {SIRT1} as therapeutics for the treatment of type 2 diabetes. Nature. 2007;450:712–716. doi: 10.1038/nature06261. [DOI] [PMC free article] [PubMed] [Google Scholar]
- 8.Lagouge M, Argmann C, Gerhart-Hines Z, Meziane H, Lerin C, Daussin F, Messadeq N, Milne J, Lambert P, Elliott P, Geny B, Laakso M, Puigserver P, Auwerx J. Resveratrol Improves Mitochondrial Function and Protects against Metabolic Disease by Activating SIRT1 and PGC-1α. Cell. 2006;127:1109–1122. doi: 10.1016/j.cell.2006.11.013. [DOI] [PubMed] [Google Scholar]
- 9.Feige JN, Lagouge M, Canto C, Strehle A, Houten SM, Milne JC, Lambert PD, Mataki C, Elliott PJ, Auwerx J. Specific SIRT1 activation mimics low energy levels and protects against diet-induced metabolic disorders by enhancing fat oxidation. Cell Metab. 2008;8:347–58. doi: 10.1016/j.cmet.2008.08.017. [DOI] [PubMed] [Google Scholar]
- 10.White AT, McCurdy CE, Philp A, Hamilton DL, Johnson CD, Schenk S. Skeletal muscle-specific overexpression of SIRT1 does not enhance whole-body energy expenditure or insulin sensitivity in young mice. Diabetologia. 2013;56:1629–1637. doi: 10.1007/s00125-013-2912-2. [DOI] [PMC free article] [PubMed] [Google Scholar]
- 11.White AT, Philp A, Fridolfsson HN, Schilling JM, Murphy AN, Hamilton DL, McCurdy CE, Patel HH, Schenk S. High-fat diet-induced impairment of skeletal muscle insulin sensitivity is not prevented by SIRT1 overexpression. Am J Physiol Endocrinol Metab. 2014;307:E764–72. doi: 10.1152/ajpendo.00001.2014. [DOI] [PMC free article] [PubMed] [Google Scholar]
- 12.Kitada M, Kume S, Kanasaki K, Takeda-Watanabe A, Koya D. Sirtuins as possible drug targets in type 2 diabetes. Curr Drug Targets. 2013;14:622–36. doi: 10.2174/1389450111314060002. [DOI] [PubMed] [Google Scholar]
- 13.Cao Y, Jiang X, Ma H, Wang Y, Xue P, Liu Y. SIRT1 and insulin resistance. Journal of Diabetes and its Complications. 2016;30:178–183. doi: 10.1016/j.jdiacomp.2015.08.022. [DOI] [PubMed] [Google Scholar]
- 14.Chaudhary N, Pfluger PT. Metabolic benefits from Sirt1 and Sirt1 activators. Curr Opin Clin Nutr Metab Care. 2009;12:431–7. doi: 10.1097/MCO.0b013e32832cdaae. [DOI] [PubMed] [Google Scholar]
- 15.Timmers S, Hesselink MKC, Schrauwen P. Therapeutic potential of resveratrol in obesity and type 2 diabetes: new avenues for health benefits? Ann N Y Acad Sci. 2013;1290:83–9. doi: 10.1111/nyas.12185. [DOI] [PubMed] [Google Scholar]
- 16.Hubbard BP, Sinclair DA. Small molecule SIRT1 activators for the treatment of aging and age-related diseases. Trends in Pharmacological Sciences. 2014;35:146–154. doi: 10.1016/j.tips.2013.12.004. [DOI] [PMC free article] [PubMed] [Google Scholar]
- 17.Philp A, Schenk S. Unraveling the complexities of SIRT1-mediated mitochondrial regulation in skeletal muscle. Exerc Sport Sci Rev. 2013;41:174–81. doi: 10.1097/JES.0b013e3182956803. [DOI] [PMC free article] [PubMed] [Google Scholar]
- 18.Boutant M, Cantó C. SIRT1 metabolic actions: Integrating recent advances from mouse models. Mol Metab. 2014;3:5–18. doi: 10.1016/j.molmet.2013.10.006. [DOI] [PMC free article] [PubMed] [Google Scholar]
- 19.Brandon AE, Tid-Ang J, Wright LE, Stuart E, Suryana E, Bentley N, Turner N, Cooney GJ, Ruderman NB, Kraegen EW. Overexpression of SIRT1 in rat skeletal muscle does not alter glucose induced insulin resistance. PLoS One. 2015;10:e0121959. doi: 10.1371/journal.pone.0121959. [DOI] [PMC free article] [PubMed] [Google Scholar]
- 20.Gurd BJ, Yoshida Y, Lally J, Holloway GP, Bonen A. The deacetylase enzyme SIRT1 is not associated with oxidative capacity in rat heart and skeletal muscle and its overexpression reduces mitochondrial biogenesis. J Physiol. 2009;587:1817–28. doi: 10.1113/jphysiol.2008.168096. [DOI] [PMC free article] [PubMed] [Google Scholar]
- 21.Tomé-Carneiro J, Larrosa M, González-Sarrías A, Tomás-Barberán FA, García-Conesa MT, Espín JC. Resveratrol and clinical trials: the crossroad from in vitro studies to human evidence. Curr Pharm Des. 2013;19:6064–93. doi: 10.2174/13816128113199990407. [DOI] [PMC free article] [PubMed] [Google Scholar]
- 22.Bai P, Cantó C, Oudart H, Brunyánszki A, Cen Y, Thomas C, Yamamoto H, Huber A, Kiss B, Houtkooper RH, Schoonjans K, Schreiber V, Sauve AA, Menissier-de Murcia J, Auwerx J. PARP-1 inhibition increases mitochondrial metabolism through SIRT1 activation. Cell Metab. 2011;13:461–8. doi: 10.1016/j.cmet.2011.03.004. [DOI] [PMC free article] [PubMed] [Google Scholar]
- 23.Bai P, Canto C, Brunyánszki A, Huber A, Szántó M, Cen Y, Yamamoto H, Houten SM, Kiss B, Oudart H, Gergely P, Menissier-de Murcia J, Schreiber V, Sauve AA, Auwerx J. PARP-2 regulates SIRT1 expression and whole-body energy expenditure. Cell Metab. 2011;13:450–60. doi: 10.1016/j.cmet.2011.03.013. [DOI] [PMC free article] [PubMed] [Google Scholar]
- 24.Cantó C, Houtkooper RH, Pirinen E, Youn DY, Oosterveer MH, Cen Y, Fernandez-Marcos PJ, Yamamoto H, Andreux PA, Cettour-Rose P, Gademann K, Rinsch C, Schoonjans K, Sauve AA, Auwerx J. The NAD(+) precursor nicotinamide riboside enhances oxidative metabolism and protects against high-fat diet-induced obesity. Cell Metab. 2012;15:838–47. doi: 10.1016/j.cmet.2012.04.022. [DOI] [PMC free article] [PubMed] [Google Scholar]
- 25.Herranz D, Muñoz-Martin M, Cañamero M, Mulero F, Martinez-Pastor B, Fernandez-Capetillo O, Serrano M. Sirt1 improves healthy ageing and protects from metabolic syndrome-associated cancer. Nat Commun. 2010;1:1–8. doi: 10.1038/ncomms1001. [DOI] [PMC free article] [PubMed] [Google Scholar]
- 26.Ramadori G, Fujikawa T, Anderson J, Berglund ED, Frazao R, Michán S, Vianna CR, Sinclair DA, Elias CF, Coppari R. SIRT1 deacetylase in SF1 neurons protects against metabolic imbalance. Cell Metab. 2011;14:301–312. doi: 10.1016/j.cmet.2011.06.014. [DOI] [PMC free article] [PubMed] [Google Scholar]
- 27.Bordone L, Cohen D, Robinson A, Motta MC, van Veen E, Czopik A, Steele AD, Crowe H, Marmor S, Luo J, Gu W, Guarente L. SIRT1 transgenic mice show phenotypes resembling calorie restriction. Aging Cell. 2007;6:759–67. doi: 10.1111/j.1474-9726.2007.00335.x. [DOI] [PubMed] [Google Scholar]
- 28.Moynihan KA, Grimm AA, Plueger MM, Bernal-Mizrachi E, Ford E, Cras-Méneur C, Permutt MA, Imai S. Increased dosage of mammalian Sir2 in pancreatic β cells enhances glucose-stimulated insulin secretion in mice. Cell Metab. 2005;2:105–117. doi: 10.1016/j.cmet.2005.07.001. [DOI] [PubMed] [Google Scholar]
- 29.Haigis MC, Sinclair DA. Mammalian Sirtuins: Biological Insights and Disease Relevance. Annu Rev Pathol. 2010;5:253–295. doi: 10.1146/annurev.pathol.4.110807.092250. [DOI] [PMC free article] [PubMed] [Google Scholar]
- 30.Li Y, Xu S, Giles A, Nakamura K, Lee JW, Hou X, Donmez G, Li J, Luo Z, Walsh K, Guarente L, Zang M. Hepatic overexpression of SIRT1 in mice attenuates endoplasmic reticulum stress and insulin resistance in the liver. FASEB J. 2011;25:1664–79. doi: 10.1096/fj.10-173492. [DOI] [PMC free article] [PubMed] [Google Scholar]
- 31.Xu C, Bai B, Fan P, Cai Y, Huang B, Law IK, Liu L, Xu A, Tung C, Li X, Siu FM, Che CM, Vanhoutte PM, Wang Y. Selective overexpression of human SIRT1 in adipose tissue enhances energy homeostasis and prevents the deterioration of insulin sensitivity with ageing in mice. Am J Transl Res. 2013;5:412–26. [PMC free article] [PubMed] [Google Scholar]
- 32.Lu M, Sarruf DA, Li P, Osborn O, Sanchez-Alavez M, Talukdar S, Chen A, Bandyopadhyay G, Xu J, Morinaga H, Dines K, Watkins S, Kaiyala K, Schwartz MW, Olefsky JM. Neuronal Sirt1 deficiency increases insulin sensitivity in both brain and peripheral tissues. J Biol Chem. 2013;288:10722–35. doi: 10.1074/jbc.M112.443606. [DOI] [PMC free article] [PubMed] [Google Scholar]
- 33.Lan F, Cacicedo JM, Ruderman N, Ido Y. SIRT1 modulation of the acetylation status, cytosolic localization, and activity of LKB1. Possible role in AMP-activated protein kinase activation. J Biol Chem. 2008;283:27628–35. doi: 10.1074/jbc.M805711200. [DOI] [PMC free article] [PubMed] [Google Scholar]
- 34.Hou X, Xu S, Maitland-Toolan KA, Sato K, Jiang B, Ido Y, Lan F, Walsh K, Wierzbicki M, Verbeuren TJ, Cohen RA, Zang M. SIRT1 regulates hepatocyte lipid metabolism through activating AMP-activated protein kinase. J Biol Chem. 2008;283:20015–26. doi: 10.1074/jbc.M802187200. [DOI] [PMC free article] [PubMed] [Google Scholar]
- 35.Nemoto S, Fergusson MM, Finkel T. SIRT1 functionally interacts with the metabolic regulator and transcriptional coactivator PGC-1{alpha} J Biol Chem. 2005;280:16456–60. doi: 10.1074/jbc.M501485200. [DOI] [PubMed] [Google Scholar]
- 36.Rodgers JT, Lerin C, Haas W, Gygi SP, Spiegelman BM, Puigserver P. Nutrient control of glucose homeostasis through a complex of PGC-1alpha and SIRT1. Nature. 2005;434:113–8. doi: 10.1038/nature03354. [DOI] [PubMed] [Google Scholar]
- 37.Yuan Y, Cruzat VF, Newsholme P, Cheng J, Chen Y, Lu Y. Regulation of SIRT1 in aging: Roles in mitochondrial function and biogenesis. Mech Ageing Dev. 2016;155:10–21. doi: 10.1016/j.mad.2016.02.003. [DOI] [PubMed] [Google Scholar]
- 38.Price NL, Gomes AP, Ling AJY, Duarte FV, Martin-Montalvo A, North BJ, Agarwal B, Ye L, Ramadori G, Teodoro JS, Hubbard BP, Varela AT, Davis JG, Varamini B, Hafner A, Moaddel R, Rolo AP, Coppari R, Palmeira CM, et al. SIRT1 is required for AMPK activation and the beneficial effects of resveratrol on mitochondrial function. Cell Metab. 2012;15:675–690. doi: 10.1016/j.cmet.2012.04.003. [DOI] [PMC free article] [PubMed] [Google Scholar]
- 39.Chalkiadaki A, Igarashi M, Nasamu AS, Knezevic J, Guarente L. Muscle-specific SIRT1 gain-of-function increases slow-twitch fibers and ameliorates pathophysiology in a mouse model of duchenne muscular dystrophy. PLoS Genet. 2014;10:e1004490. doi: 10.1371/journal.pgen.1004490. [DOI] [PMC free article] [PubMed] [Google Scholar]
- 40.Higashida K, Kim SH, Jung SR, Asaka M, Holloszy JO, Han DH. Effects of Resveratrol and SIRT1 on PGC-1α Activity and Mitochondrial Biogenesis: A Reevaluation. PLoS Biol. 2013;11:e1001603. doi: 10.1371/journal.pbio.1001603. [DOI] [PMC free article] [PubMed] [Google Scholar]
- 41.Jäger S, Handschin C, St-Pierre J, Spiegelman BM. AMP-activated protein kinase (AMPK) action in skeletal muscle via direct phosphorylation of PGC-1alpha. Proc Natl Acad Sci U S A. 2007;104:12017–22. doi: 10.1073/pnas.0705070104. [DOI] [PMC free article] [PubMed] [Google Scholar]
- 42.McCarthy JJ, Srikuea R, Kirby TJ, Peterson CA, Esser KA. Inducible Cre transgenic mouse strain for skeletal muscle-specific gene targeting. Skelet Muscle. 2012;2:8. doi: 10.1186/2044-5040-2-8. [DOI] [PMC free article] [PubMed] [Google Scholar]
- 43.Firestein R, Blander G, Michan S, Oberdoerffer P, Ogino S, Campbell J, Bhimavarapu A, Luikenhuis S, de Cabo R, Fuchs C, Hahn WC, Guarente LP, Sinclair DA. The SIRT1 deacetylase suppresses intestinal tumorigenesis and colon cancer growth. PLoS One. 2008;3:e2020. doi: 10.1371/journal.pone.0002020. [DOI] [PMC free article] [PubMed] [Google Scholar]
- 44.LaBarge SA, Migdal CW, Buckner EH, Okuno H, Gertsman I, Stocks B, Barshop BA, Nalbandian SR, Philp A, McCurdy CE, Schenk S. P300 is not required for metabolic adaptation to endurance exercise training. FASEB J. 2016;30:1623–1633. doi: 10.1096/fj.15-281741. [DOI] [PMC free article] [PubMed] [Google Scholar]
- 45.Kostrominova TY. Application of WGA lectin staining for visualization of the connective tissue in skeletal muscle, bone, and ligament/tendon studies. Microsc Res Tech. 2011;74:18–22. doi: 10.1002/jemt.20865. [DOI] [PMC free article] [PubMed] [Google Scholar]
- 46.Talmadge RJ, Roy RR. Electrophoretic separation of rat skeletal muscle myosin heavy-chain isoforms. J Appl Physiol. 1993;75:2337–40. doi: 10.1152/jappl.1993.75.5.2337. [DOI] [PubMed] [Google Scholar]


