SUMMARY
The canonical Wnt/β-catenin signaling pathway governs diverse developmental, homeostatic and pathologic processes. Palmitoylated Wnt ligands engage cell surface Frizzled (Fzd) receptors and Lrp5/6 co-receptors enabling β-catenin nuclear translocation and Tcf/Lef-dependent gene transactivation1–3. Mutations in Wnt downstream signaling components have revealed diverse functions presumptively attributed to Wnt ligands themselves, although direct attribution remains elusive, as complicated by redundancy between 19 mammalian Wnts and 10 Fzds1 and Wnt hydrophobicity2,3. For example, individual Wnt ligand mutations have not revealed homeostatic phenotypes in the intestinal epithelium4, an archetypal canonical Wnt pathway-dependent rapidly self-renewing tissue whose regeneration is fueled by proliferative crypt Lgr5+ intestinal stem cells (ISCs)5–9. R-spondin ligands (Rspo1–4) engage distinct Lgr4-6 and Rnf43/Znrf3 receptor classes10–13, markedly potentiate canonical Wnt/β-catenin signaling and induce intestinal organoid growth in vitro and Lgr5+ ISCs in vivo8,14–17. However, the interchangeability, functional cooperation and relative contributions of Wnt versus Rspo ligands to in vivo canonical Wnt signaling and ISC biology remain unknown. Here, we deconstructed functional roles of Wnt versus Rspo ligands in the intestinal crypt stem cell niche. We demonstrate that the default fate of Lgr5+ ISCs is lineage commitment, escape from which requires both Rspo and Wnt ligands. However, gain-of-function studies using Rspo versus a novel non-lipidated Wnt analog reveal qualitatively distinct, non-interchangeable roles for these ligands in ISCs. Wnts are insufficient to induce Lgr5+ ISC self-renewal, but rather confer a basal competency by maintaining Rspo receptor expression that enables Rspo to actively drive and specify the extent of stem cell expansion. This functionally non-equivalent yet cooperative interplay between Wnt and Rspo ligands establishes a molecular precedent for regulation of mammalian stem cells by distinct priming and self-renewal factors, with broad implications for precision control of tissue regeneration.
We investigated the relative contributions of extracellular Wnt and Rspo ligands to homeostatic Wnt signaling in the ISC niche using highly specific, ligand-level pharmacologic perturbation. We inhibited endogenous Rspo signaling with soluble ectodomains (ECDs) of LGR5, Znrf3 or Rnf43 Rspo receptors11–13,18, which bound and neutralized Rspo1–4 (Extended Data Fig. 1a–f). Adenoviruses (Ad) robustly expressed LGR5, Znrf3 or Rnf43 ECDs in serum after hepatic transduction and secretion for ~14–96 days post-intravenous (i.v.) injection of mice (Extended Data Fig. 1g). To examine effects of pan-Rspo1–4 inhibition on Lgr5+ ISCs, Lgr5-eGFP-IRES-CreER mice7 received i.v. injection of Ad LGR5 ECD, Znrf3 ECD or Rnf43 ECD, or control Ad Fc encoding a control immunoglobulin IgG2α Fc fragment8. Ad LGR5, Znrf3 or Rnf43 ECDs reversibly ablated Lgr5-eGFP+ cells in small intestine from 2–14 days post-injection and the Wnt-independent Lgr5+ ISC marker Olfm419 without grossly affecting villus height or crypt Ki67+ proliferation (Fig. 1a,b; Extended Data Fig. 2), consistent with dispensability of Lgr5+ ISCs for short-term crypt maintenance8,20. Ad LGR5 ECD also suppressed Lgr5 expression in Lgr5-LacZ reporter mice (Fig. 1b).
Figure 1. Pan-Rspo inhibition by systemic overexpression of LGR5, Rnf43 or Znrf3 ECDs.
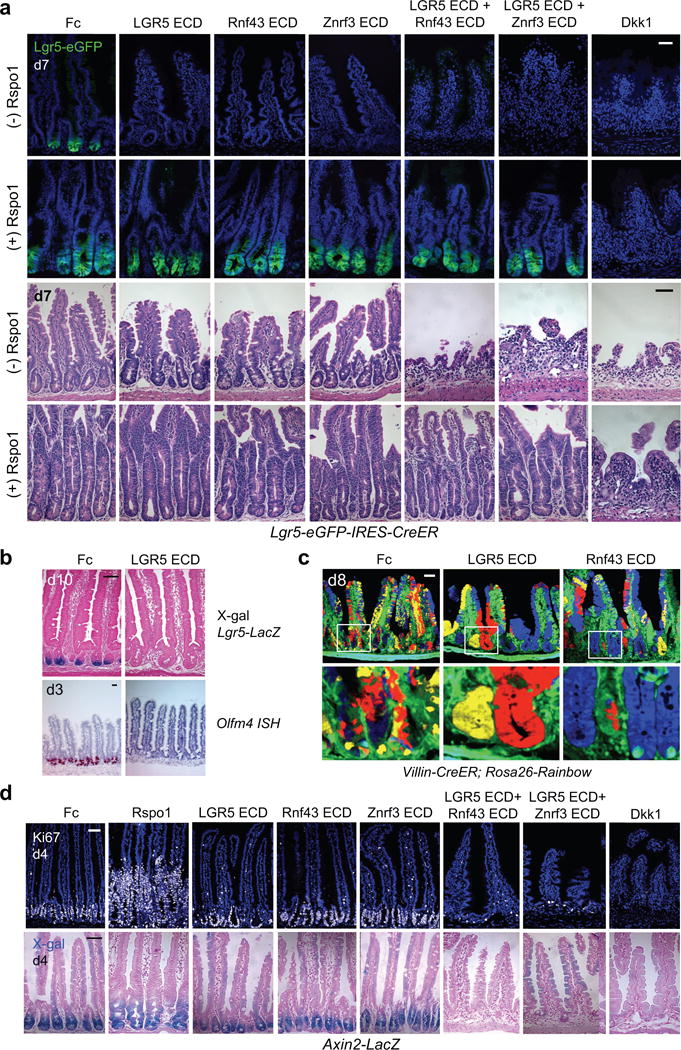
a, Top: Rspo inhibition by adenoviral expression of LGR5, Rnf43 or Znrf3 ECDs ablates Lgr5-eGFP but preserves crypts in Lgr5-eGFP-IRES-CreER mice. Dual ECD treatment (LGR5 ECD + Rnf43 or LGR5 ECD + Znrf3 ECD), or Wnt inhibition with Dkk1 all induce loss of both Lgr5-eGFP+ cells and crypts. Concomitant Ad Rspo1 treatment rescues dual ECD combinations but not Dkk1. Jejunum. Bottom: H&E. b, Top: LGR5 ECD abrogates transgenic Lgr5-LacZ+ signal. Jejunum. Bottom: LGR5 ECD represses Olfm4, in situ hybridization. c, Ad LGR5 ECD or Rnf43 ECD accelerates crypt monoclonality in adult Villin-CreER; Rosa26-Rainbow jejunum, d8 post-tamoxifen and d7 after Ad LGR5 ECD, Rnf43 ECD or Fc infection. d, Single but not dual ECD Rspo inhibition preserves Ki67+ crypt proliferation (top) and crypts and basal Wnt signaling in Axin2-LacZ Wnt reporter mice (bottom). Jejunum. Bars = 50 μm. Images are representative of n=3 mice per condition, and all experiments were repeated at least twice.
Lgr5+ ISCs symmetrically divide with neutral drift kinetics with progressive conversion of polyclonal crypts to monoclonality over 1–6 months in adult mice21,22. However, Ad LGR5 ECD or Ad Rnf43 ECD rapidly induced crypt monoclonality by 8 days in tamoxifen-treated adult (Fig. 1c) or neonatal (Extended Data Fig. 3a) Villin-CreER; Rosa26-Rainbow mice, providing marker-independent functional evidence for stem cell reduction upon Rspo inhibition. Multi-lineage differentiation with all three ECDs was preserved except for LGR5 ECD-induced ballooning intermediate cell-like degeneration of Paneth cells at day 3 that only occurred after Lgr5+ ISC loss at day 2 (Extended Data Fig. 4). Importantly, concomitant Rspo1 overexpression completely reversed LGR5, Znrf3 or Rnf43 ECD repression of Lgr5+ ISCs, underscoring specificity (Fig. 1a).
RSPO2 simultaneously bound both Znrf3 and LGR5 ECDs by yeast surface display (Extended Data Fig. 1h–n), consistent with RSPO proteins engaging LGR4–6 and RNF43/ZNRF3 via spatially distinct interfaces18,23,24. Accordingly, dual blockade of both the Rspo:Lgr and Rspo:Znrf3/Rnf43 interactions by Ad Rnf43 ECD + Ad LGR5 ECD or Ad Znrf3 ECD + Ad LGR5 ECD synergistically induced 100% lethal loss of crypts, villi, Lgr5-eGFP, proliferation and Axin2-LacZ Wnt reporter signal within 7 days (Fig. 1a,d). Concomitant Rspo1 overexpression fully reversed the dual ECD but not Ad Dkk16,8 phenotypes (Fig. 1a). In contrast, despite quantitative Lgr5+ ISC depletion, single LGR5, Rnf43 or Znrf3 ECDs preserved crypt proliferation and Axin2-LacZ reporter signal (Fig. 1a,d), attributable to residual TA cells or other Rspo-resistant populations.
LGR5, Rnf43 and Znrf3 ECD-induced depletion of Lgr5+ ISCs was not due to crypt cell apoptosis or altered proliferation (Fig. 1d and Extended Data Fig. 3b). We thus performed tamoxifen-mediated lineage tracing of Lgr5+ ISCs in Lgr5-eGFP-IRES-CreER; Rosa26-tdTomato mice. By day 2, Ad Fc controls harbored crypt-base tdTomato-marked Lgr5-eGFP+ cells (yellow) with limited non-Lgr5 crypt-confined progeny (red) (Fig. 2a). However, Ad LGR5, Rnf43 or Znrf3 ECD each dramatically accelerated Lgr5+ ISC lineage tracing kinetics by day 2 with strongly induced differentiated red villus progeny versus Fc control, consistent with Rspo inhibition inducing rapid Lgr5+ ISC flux through the TA and terminally differentiated fates; this was phenocopied by Ad Dkk1 (Fig. 2a–b; Extended Data Fig. 3c). RNA-seq of FACS-sorted Lgr5-eGFP+ ISCs at 1.5 days following Ad LGR5 ECD treatment, just prior to complete loss of Lgr5-eGFP fluorescence, revealed nascent multi-lineage differentiation (Fig. 2c, Supplementary Information Tables 1 and 2). Thus, endogenous Rspo ligands obligately maintain Lgr5+ ISCs, with Rspo inhibition via LGR5, Rnf43 or Znrf3 ECDs uniformly shunting Lgr5+ ISCs toward default passive lineage commitment.
Figure 2. Lineage tracing of Lgr5-eGFP+ ISCs upon systemic Rspo inhibition versus overexpression.
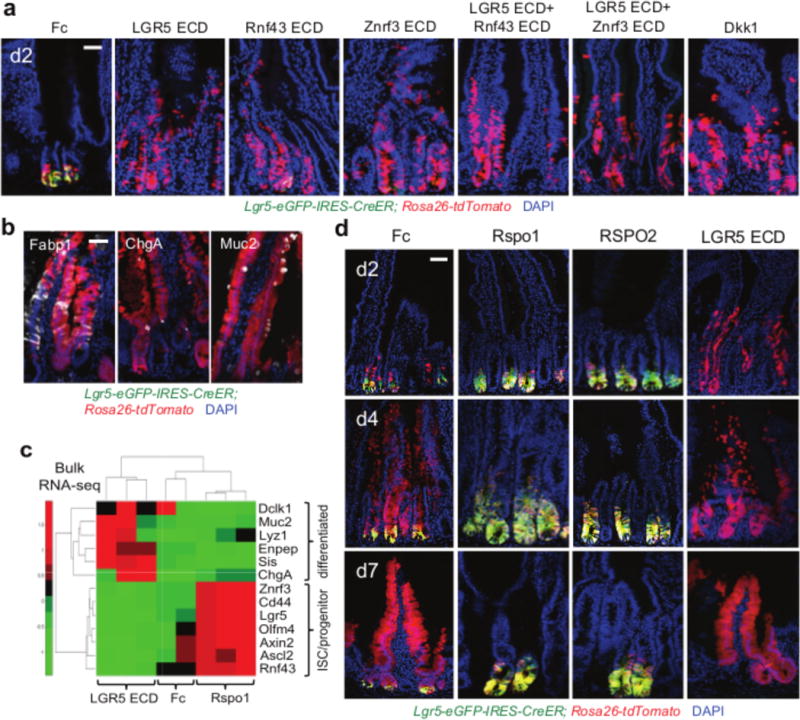
a, Ad LGR5, Rnf43 or Znrf3 ECDs ablate Lgr5-eGFP reporter signal and induce precocious Lgr5+ ISC villus lineage tracing Lgr5-eGFP-IRES-CreER; Rosa26-tdTomato mice, d2 after adenovirus and tamoxifen. b, Multi-lineage differentiation in d7 LGR5 ECD-induced tdTomato+ lineage stripes. c, RNA-seq heatmap of reciprocal changes in FACS-sorted Lgr5-eGFP+ cells, d1.5 after Ad Rspo1 or Ad LGR5 ECD, Lgr5-eGFP-IRES-CreER mice. d, Ad Rspo1 or Ad RSPO2 both expand Lgr5+ ISCs, whose lineage traces are profoundly crypt-confined with striking repression of red progeny and villus lineage tracing. In contrast, Ad LGR5 ECD ablates Lgr5-eGFP expression and drives premature Lgr5+ ISC lineage tracing. Lgr5-eGFP-IRES-CreER; Rosa26-tdTomato duodenum, d2–7. Bars = 50 μm. In a–d, tamoxifen was given at day 0. All experiments used n=3 mice per condition and were repeated at least twice, except for c, which used n=2–3 mice per condition and performed once.
We also lineage traced Lgr5+ ISCs under Rspo gain-of-function (GOF) conditions (Fig. 2d). Ad Rspo18,16 or Ad RSPO2 induced crypt hyperplasia in tamoxifen-treated Lgr5-eGFP-IRES-CreER; Rosa26-tdTomato mice. In control Ad Fc small intestine, tamoxifen-labeled GFP+tdTomato+ (yellow) Lgr5+ cells generated scattered red crypt Lgr5− progeny at day 2 and red differentiated villus lineage stripes by days 4–7. In contrast, Ad Rspo1 or Ad RSPO2 expanded yellow Lgr5+ ISCs within the enlarged crypts at days 2–7, but crucially the Rspo1 and RSPO2 Lgr5+ ISC lineage traces were overwhelmingly yellow, profoundly crypt-confined and lacked red lineage-committed progeny (Extended Data Fig. 3d). Rspo-induced crypt “trapping” of tdTomato-marked Lgr5+ cells occurred concurrently with Rspo-induced proliferation of non-Lgr5+ TA cells (Fig. 2d; Extended Data Fig. 3d,e). Further, Rspo1 significantly enriched ISC/progenitor gene expression in Lgr5-eGFP+ ISCs upon bulk cell RNA-seq (Fig. 2c; Supplementary Information Tables 1 and 2). Accordingly, Rspo-expanded Lgr5+ ISCs are confined to the ISC fate and do not differentiate, indicating that Rspo quantitatively induces Lgr5+ ISC self-renewal, for instance by symmetric cell division mechanisms14,15.
Direct exploration of Wnt ligand function has been confounded by genetic redundancy and hydrophobicity due to post-translational palmitoylation, complicating large-scale purification and in vivo study2. We thus generated scFv-DKK1c, a non-lipidated, water-soluble, artificial Wnt analog acting by Fzd-Lrp heterodimerization with broad Fzd specificity that exhibited robust serum expression for > 21 days upon adenoviral expression25. Unexpectedly, Ad scFv-DKK1c-treated small intestines were histologically normal, versus Ad Rspo1-induced crypt hyperplasia (Fig. 3a). However, scFv-DKK1c + Rspo1 synergistically induced marked villus hyperproliferation and lengthening with Ki67 and Wnt targets CD446 and cyclin D1 contiguously extending from crypts to peri-villus tip regions (Fig. 3a–c). While single scFv-DKK1c or Rspo1 treatment was well tolerated, the combination elicited cachexia and intestinal obstruction with lethality within 7–9 days. However, 100-fold lower doses of Ad scFv-DKK1c still elicited synergistic villus proliferation and Wnt target gene upregulation while averting lethality at those time points (Extended Data Fig. 5a–c). Ad scFv-DKK1c potently rescued the loss of Lgr5-eGFP or Olfm4 from either C59-mediated Porcupine (Porcn) inhibition26 (Fig. 3d; Extended Data Fig. 5d) or the Fzd8 Wnt-binding cysteine-rich domain (CRD) (ref.27) a soluble decoy receptor that sequesters Wnts (Fig. 3e; Extended Data Fig. 5e). Thus, scFv-DKK1c is mutually antagonistic with Fzd8 CRD and rescues endogenous Wnt loss upon Porcn inhibition to maintain Lgr5+ ISCs.
Figure 3. Wnt analog scFv-DKK1c synergizes with Rspo to activate intestinal proliferation and substitutes for endogenous Wnts to maintain Lgr5+ ISCs.
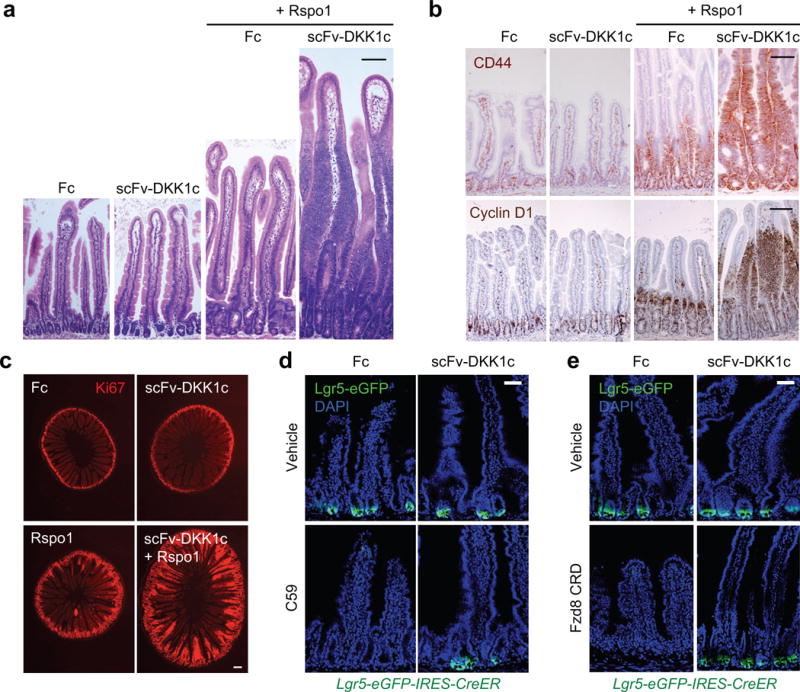
a, Ad scFv-DKK1c does not perturb intestinal homeostasis by itself but markedly synergizes with Ad Rspo1 to induce villus proliferation. H&E, jejunum, d7 post-adenovirus. Bar = 100 μm. b, Top, CD44 IHC. Bottom, cyclin D1 IHC. D4 after adenovirus, jejunum. Bar = 100 μm. c, Ki67 immunofluorescence, d7 post-adenovirus, jejunum. Bar = 200 μm. d, scFv-DKK1c substitutes for endogenous Wnt in Porcn inhibitor C59-treated Lgr5-eGFP-IRES-CreER mice. Lgr5-eGFP reporter signal. Jejunum, d6 post-adenovirus and d4 of C59 treatment. Bar = 50 μm. e, scFv-DKK1c efficiently rescues Lgr5+ ISC depletion and crypt loss elicited by Ad Fzd8 CRD. Lgr5-eGFP-IRES-CreER mice, d4 post-adenovirus, jejunum. Bar = 50 μm. All experiments used n=3 mice per condition and were repeated at least twice.
scFv-DKK1c did not expand Lgr5-eGFP+ cells beyond homeostatic levels in naïve, Porcn inhibitor or Fzd8 CRD-treated mice despite rescuing Lgr5+ ISC loss (Fig. 3d,e; Fig. 4a). Likewise, scFv-DKK1c did not alter crypt clonality, Lgr5 lineage tracing kinetics, Paneth cells or accelerate epithelial repair following 10 Gy irradiation (Extended Data Fig. 6a–d). Notably, the scFv-DKK1c + Rspo1 combination did not augment crypt Lgr5-eGFP+ or Olfm4+ cells beyond that observed with Rspo1 alone despite synergistic induction of villus proliferation (Fig. 4a; Extended Data Fig. 6e), indicating that Rspo, not Wnt, establishes the set point for Lgr5+ ISC number.
Figure 4. Wnt ligands cannot augment Lgr5+ ISC number or substitute for Rspo but are required to prime ISCs for Rspo action.
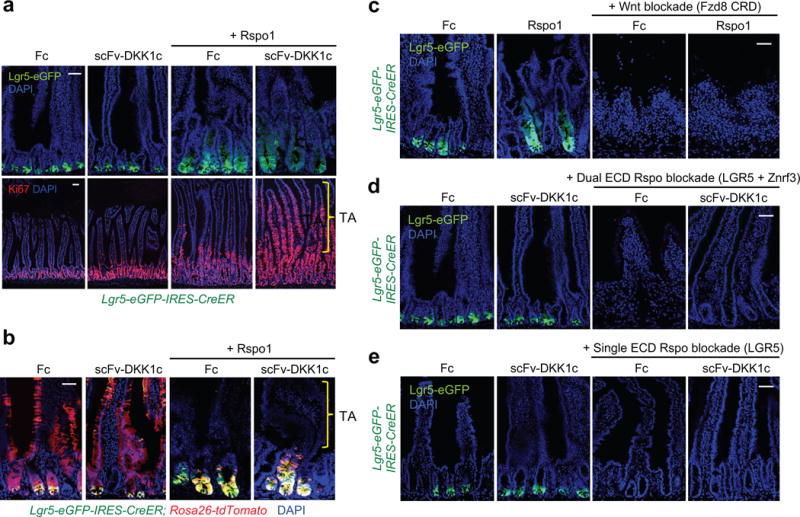
a, scFv-DKK1c does not induce Lgr5+ ISCs by itself or in combination with Rspo despite synergistic induction of villus proliferation. Top, Lgr5-eGFP-IRES-CreER reporter. Bottom, Ki67 IF. D7 post-adenovirus, jejunum. b, Wnt ligand augmentation by Ad scFv-DKK1c does not alter Lgr5+ ISC lineage tracing either by itself or in combination with Rspo1. Jejunum of Lgr5-eGFP-IRES-CreER; tdTomato mice, d4 following simultaneous administration of adenovirus and tamoxifen. c, Rspo1 treatment cannot rescue Lgr5+ ISC loss after Fzd8 ECD-mediated Wnt sequestration. d–e, scFv-DKK1c cannot rescue loss of Lgr5+ ISC or crypts after (d) dual Rspo blockade via LGR5 ECD + Znrf3 ECD or (e) single Rspo blockade via LGR5 ECD. c-e are d4 post-adenovirus, jejunum, Lgr5-eGFP-IRES-CreER mice. Bars = 50 μm. All experiments used n=3 mice per condition and were repeated at least twice.
The scFv-DKK1c + Rspo1-induced proliferative villus cells did not express Lgr5-eGFP (Fig. 4a,b), Olfm4 or enterocyte (Fabp1) (Extended Data Fig. 6e,f) or enteroendocrine (ChgA; data not shown) differentiation markers, consistent with a TA identity. Furthermore, Lgr5+ ISC lineage traces upon scFv-DKK1c + Rspo1 treatment were crypt-confined, identical to Rspo1 (Fig. 4b), despite highly proliferative CD44+ villi (Extended Data Fig. 7a–c). Adenoviral expression of Wnt3A (Ad Wnt3A) did not produce detectable serum expression (data not shown) and did not synergize with Ad Rspo1/2 on intestinal proliferation, highlighting the diffusible nature of the Wnt analog versus Wnt3A (Extended Fig. 7a–c). An scFv-DKK1c-RSPO2 fusion polypeptide25 similarly induced villus proliferation, CD44 expression, Lgr5+ ISCs and crypt-confined Lgr5+ progeny, although restricted to proximal small intestine (Extended Data Fig. 7).
Rspo1 could not rescue Lgr5+ ISC loss from Fzd8 CRD-mediated endogenous Wnt sequestration (Fig. 4c), indicating that in vivo Rspo activity absolutely requires a Wnt ligand priming function. Reciprocally, scFv-DKK1c did not rescue Lgr5-eGFP+ or Olfm4+ ISC loss after dual LGR5 ECD + Znrf3 ECD treatment (Fig. 4d; Extended Data Fig. 8a). However, scFv-DKK1c did rescue the proliferative crypt compartment despite absent Lgr5+ ISCs, suggesting that increased Wnt ligands can replace Rspo to maintain crypt/TA cells, but not Lgr5+ ISCs. Similarly, scFv-DKK1c could not rescue Lgr5-eGFP+ or Olfm4+ ISC upon hypomorphic Rspo blockade from LGR5 ECD alone (Fig. 4e; Extended Data Fig. 8b), where intact Rspo:Znrf3/Rnf43 interaction could maintain Fzd receptor density and full sensitivity to Wnt ligands18,28. Overall, Rspo and Wnt signals were mutually non-redundant during Lgr5+ ISC homeostasis, consistent with functional non-equivalence.
We analyzed Wnt- versus Rspo-perturbed Lgr5+ ISC fate outcomes by single-cell RNA-seq of FACS purified proximal jejunum Lgr5-eGFP+ cells, including both Lgr5hi and Lgr5lo (ref.15), 26 h after injection with adenoviruses encoding Wnt or Rspo agonists or inhibitors. The persistent GFP protein half-life allowed short-term fluorescent tracking of these cells despite rapid loss of Lgr5 mRNA upon Wnt or Rspo inhibition. Lgr5-eGFP+ or Ad Fc negative control Lgr5-eGFP− cells (~1000–2500 cells recovered per treatment condition, Supplementary Information Table 3) were analyzed by single-cell RNA-seq using the GemCode system (10x Genomics), a droplet-based method allowing high cell throughput and >50% single cell capture efficiency29. Accordingly, sequencing data from 13,102 single cells (11,177 Lgr5-eGFP+ and 1,925 Lgr5-eGFP−) were analyzed by principal component analysis (PCA), Seurat clustering30 and T-SNE projection (Fig. 5a; Extended Data Fig. 9a–f).
Figure 5. Single-cell transcriptomics of FACS-sorted Lgr5-eGFP(+) cells following in vivo Wnt versus Rspo modulation.
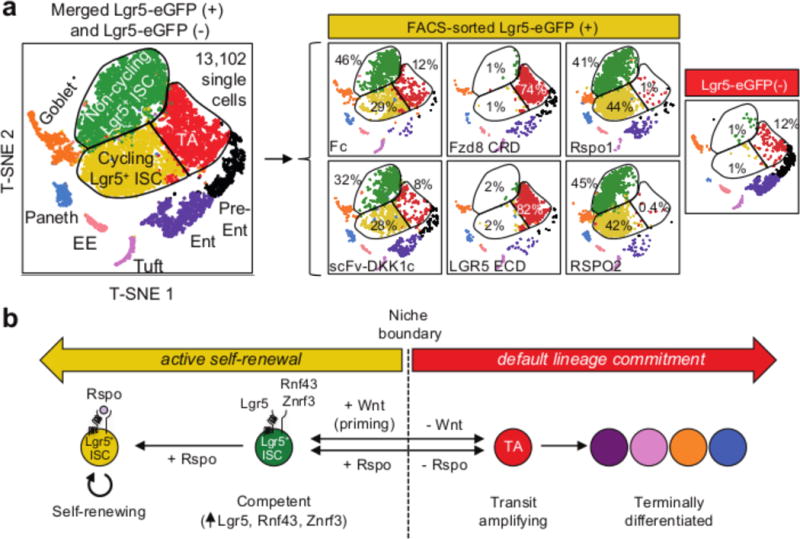
a, (Left) T-SNE projection of 13,102 single cells, colored by inferred cell type, comprised of 11,177 FACS-sorted Lgr5-eGFP(+) and 1,925 Lgr5-eGFP(−) cells. (Right) T-SNE projection of the 13,102 single cells segregated by 6 Lgr5-eGFP(+) cell treatment conditions and Lgr5-eGFP(−) control; % cells in non-cycling Lgr5(+) ISCs, cycling Lgr5(+) ISCs and TA clusters are indicated. b, Proposed model.
Lgr5-eGFP− control cells represented differentiated small intestinal lineages (goblet, EE, enterocyte, pre-enterocyte, Paneth, tuft), TA, proliferating and non-proliferating Lgr5+ ISCs (Extended Data Fig. 9g,h; Supplementary Information Table 4). In contrast, Lgr5-eGFP+ cells (Lgr5hi + Lgr5lo) comprised 3 major clusters: cycling Lgr5+, non-cycling Lgr5+ and TA (Fig. 5a). Although cycling and non-cycling Lgr5+ populations strongly expressed canonical CBC genes (Lgr5, Olfm4, Ascl2), cell cycle mRNAs (Mki67, Tuba1b, Hist1h1b) specifically segregated to cycling Lgr5+ cells. The TA cluster exhibited proliferation markers (Mki67, Tuba1b, Hist1h1b) and Wnt targets (Axin2, Cd44, Ccnd1) but lacked Lgr5 mRNA alongside markedly decreased Ascl2 and Olfm4, as reported31 (Extended Data Fig. 10).
Notably, Ad Rspo1 and Ad RSPO2 homogenized Lgr5-eGFP+ identity to the cycling and non-cycling Lgr5+ ISC clusters with quantitative TA loss (Fig. 5a, Supplementary Information Table 5), concordant with in vivo lineage tracing inferring simultaneous Lgr5+ ISC expansion and suppressed lineage commitment (Fig. 2d). Ad Rspo1 and Ad RSPO2 also induced canonical CBC genes (Lgr5, Olfm4, Ascl2, Tnfrsf19) whereas Ad scFv-DKK1c did not (Extended Data Fig. 9, 10; Supplementary Information Tables 5–7), consistent with its lack of effects on Lgr5 lineage tracing (Fig. 3, 4; Extended Data Fig. 6b).
Crucially, either Wnt or Rspo ligand LOF (Ad Fzd8 CRD, Ad LGR5 ECD) elicited virtually identical single-cell clusters, with pronounced loss of both the cycling and non-cycling Lgr5+ ISC clusters and marked TA predominance (Fig. 5a, Supplementary Information Table 5), identical to the inference from in vivo lineage tracing (Fig. 2a,d). Ad Fzd8 CRD and Ad LGR5 ECD identically extinguished CBC markers (Lgr5, Olfm4, Ascl2, Tnrsf19), Wnt target genes (Axin2, CD44), Rspo receptors (Rnf43, Znrf3) and Fzds (Fzd2, Fzd7) (Extended Data Fig. 10; Supplementary Information Tables 6–8). The Wnt priming of Lgr5+ ISC responses to Rspo thus occurs by (1) maintaining expression of cell surface Rspo receptors (Lgr5, Rnf43, Znrf3) and (2) inducing positive Wnt autoregulation via Fzd2/7.
Wnt and Rspo ligands represent two discrete, non-equivalent yet essential families that cooperatively maintain Lgr5+ ISCs. The striking concordance of single-cell RNA-seq profiles and lineage commitment phenotypes upon either selective Wnt or Rspo blockade strongly indicates that these two ligand families cooperate within the same molecular pathway to maintain Lgr5+ ISCs. This powerfully illustrates the utility of single-cell RNA-seq to monitor discrete stem cell states and their dynamic perturbation. The synergistic crypt loss after simultaneous blockade of both Rspo:Lgr and Rspo:Rnf43/Znrf3 binding further suggests that maximal Rspo activity requires concordant engagement of both receptor classes, as predicted by structural studies23,24, while supporting an essential role for Lgr receptors and Rspo proteins during crypt and Lgr5+ ISC maintenance11,32. However, Wnt and Rspo ligands are functionally non-equivalent since Wnt ligand overexpression, using the novel non-lipidated scFv-DKK1c as a proxy, cannot induce crypt expansion or Lgr5+ ISCs, in marked contrast to Rspo. Furthermore, these ligand families cannot mutually substitute during Lgr5+ ISC maintenance. Rather, Wnts and Rspos intimately cooperate, with Wnts conferring a basal priming/competency unto the Lgr5+ ISCs by inducing Rspo receptor expression (Lgr5, Rnf43 and Znrf3) that enables Rspo-driven Lgr5+ ISC self-renewal (Fig. 5b). This parallels proposed models of Rspo action where Rspo does not itself induce canonical Wnt signaling but dramatically amplifies the basal activity of Wnt ligands18. Other genetic phenotypes from Wnt signaling intermediates such as Axin, Apc or β-catenin, been previously attributed to Wnt ligands, may arise from analogous Wnt/Rspo cooperativity.
Both in vivo lineage tracing and single-cell RNA-seq analysis of Wnt or Rspo inhibition concordantly reveal that the default fate of Lgr5+ ISCs is passive lineage commitment. In contrast, Lgr5+ ISC self-renewal is an active process requiring both Wnt and Rspo as priming and self-renewal factors, respectively. However, Rspo, not Wnt, dominantly dictates the size of the Lgr5+ ISC pool irrespective of overexpressed Wnt ligand amplitude. The reciprocal Rspo GOF self-renewal versus LOF lineage commitment phenotypes reveal Rspos as master regulators of Lgr5+ ISC fate determination and associated neutral drift kinetics21,22. Overall, the parsing of ISC regulation into distinct Wnt priming and Rspo self-renewal stages has significant regulatory implications for precision control and fine-tuning of tissue homeostasis, as potentially facilitated by the evolutionary appearance of Rspo genes in vertebrates. Analogous multi-tiered regulation by priming and self-renewal factors may be a generalized property of stem cells across diverse organ systems, either through Wnt and Rspo or functionally equivalent niche components.
METHODS
Recombinant adenoviruses and proteins
Recombinant adenoviruses were constructed with the following inserts. Full length murine Dkk16, and murine Rspo1-Fc16 with full length Rspo1 fused to a murine antibody IgG2α Fc fragment at the C-terminus have been described. Human RSPO2 and murine Rnf43 ECD and Znrf3 ECD similarly contained full-length open reading frames with a C-terminal murine IgG2α Fc fragment. Murine Fzd8 CRD (residues 25–173) was cloned with an N-terminal hemagglutinin (HA) epitope tag and C-terminal IgG2α Fc fragment. In addition, a recombinant adenovirus was engineered to express human LGR5 ECD with both C-terminal FLAG and histidine tags. The construction of the adenoviruses encoding the scFv-DKK1c Wnt surrogate agonist and scFv-DKK1c-RSPO2 single chain polypeptide fusion, each with C-terminal His6 tag is described in a companion paper by Janda et al.25 On day 2 following i.v. injection, scFv-DKK1c was found to be expressed in vivo at ~10–20 μg/ml (280–560 nM) in mouse sera and the serum potently induced TOPflash activity in vitro. Full length Wnt3A cDNA (Roel Nusse, Stanford) was cloned without any epitope tags and detected by Western blotting with anti-Wnt3A (Cell Signaling #2391) against a recombinant Wnt3A protein. No detectable Wnt3A protein was found in mouse sera following i.v. injection. All adenoviral constructs contained an N-terminal signal peptide sequence to allow for their secretion. These adenoviruses were cloned by homologous recombination into E1− E3− adenovirus strain 5, purified by double CsCl2 gradient, and titered as previously described33. Recombinant proteins were expressed in serum-free CD293 medium (Invitrogen) of HEK 293 cells infected by adenovirus. Recombinant LGR5 ECD protein was purified by Nickel-NTA affinity chromatography (Qiagen) from Ad LGR5 ECD-infected CD293 medium. Likewise, recombinant Rnf43 and Znrf3 ECD Fc fusion proteins were purified by protein A affinity chromatography (KPL) from Ad Rnf43 ECD or Ad Znrf3 ECD-infected CD293 medium, respectively. Protein purity was verified by Coomassie-stained SDS-PAGE.
Mice
Adult Lgr5-eGFP-IRES-CreER mice7 (Jax) or Axin2-LacZ mice (Jax) between 8–12 weeks old were injected intravenously with adenoviruses (doses of 5×10⁸ to 1×10⁹ pfu per mouse). Lgr5-eGFP-IRES-CreER mice were crossed with Rosa26-tdTomato mice to generate Lgr5-eGFP-IRES-CreER; Rosa26-tdTomato compound heterozygous mice. Likewise, Villin-CreER or Actin-CreER mice were crossed to Rosa26-Rainbow mice to generate Villin-CreER; Rosa26-Rainbow or Actin-CreER; Rosa26-Rainbow compound heterozygous mice. Mice were dosed with adenoviruses as above and serum expression of all ECDs were confirmed by immunoblotting and histological assessment of intestinal crypt hyperplasia for those treated with Ad Rspo1 and Ad RSPO2. Adult mice between 8–12 weeks of age were administered tamoxifen (Sigma) dosed at 9 mg per 40 g body weight to genetically label for lineage tracing experiments using the various Rosa26 reporter strains. All in vivo experiments used n=3 to n=5 mice per group and repeated at least twice except for the RNA-seq studies. Both male and female mice were used. All animal experiments were conducted in accordance with procedures approved by the IACUC at Stanford University.
Flow Cytometry
FACS experiments were performed using fresh small intestine epithelial preparations. A standardized 3 cm segment of proximal jejunum was used for quantitative FACS analysis of ISC populations. Intestinal epithelial cells were extracted from en bloc resected small intestine with 10 mM EDTA and manual shaking, followed by enzymatic dissociation with collagenase/dispase (Roche) to generate a single cell suspension. Singlet discrimination was sequentially performed using plots for FSC (FSC-A vs. FSC-H) and SSC (SSC-W vs. SSC-H). Dead cells were excluded by scatter characteristics and viability stains. All FACS experiments were performed on an Aria II sorter (BD) or LSRII analyzer (BD) at the Stanford University Shared FACS Facility and FACS data were analyzed using FlowJo software (TreeStar).
Histological analysis and Immunofluorescence
Intestinal tissue was harvested and fixed in 4% paraformaldehyde. 8 μm OCT frozen sections or 5 μm paraffin-embedded sections were TUNEL stained using the DeadEnd Fluorometric TUNEL system was used per manufacturer’s instructions (Promega) or immunostained using the following primary antibodies: anti-Ki67 (ThermoFisher #RM-9106), anti-Muc2 (Santa Cruz #sc-15334), anti-lysozyme (Dako #A0099), anti-chromogranin A (Santa Cruz #sc-1488), anti-FABP1 (Novus #NBP1-87695), anti-CD44 (BD Pharmingen #550538), anti-cyclin D1 (Abcam #ab134175) and anti-CD166 (R&D #AF1172). All primary antibodies were used at 1:100 to 1:200. Cy3- and Cy5-conjugated secondary antibodies (Santa Cruz and Jackson ImmunoResearch) were used at 1:500 to 1:1000 dilutions. Alexa Fluor 594-conjugated Phalloidin (Invitrogen) was used at 1:500. CD166 immunostained tissue sections34 were analyzed and confocal images acquired as 0.5-μm planes using an IX81 Inverted Microscope equipped with Fluoview FV1000-Spinning Disc Confocal scan head and FV10 ASW 1.7 software (Olympus). All other images were captured on a Zeiss Axio-Imager Z1 with ApoTome or Leica SP5 confocal microscope.
Olfm4 mRNA in situ hybridization
In situ hybridization for Olfm4 mRNA was performed using the RNAscope kit (Advanced Cell Diagnostics) according to the manufacturer’s instructions. Briefly, 5 μm formalin-fixed, paraffin embedded tissue sections or 8 μm OCT frozen sections were pretreated with heat and protease prior to hybridization with a target probe to Olfm4 mRNA. An HRP-based signal amplification system was then hybridized to the target probes followed by colorimetric development with DAB. Negative control probes for the bacterial gene DapB were also included for each slide.
in vivo Porcupine inhibition
Adult Lgr5-eGFP-IRES-CreER mice (Jax) between 10–12 weeks old were treated with intravenous adenovirus. After 48 hours these mice were treated by oral gavage for four days with twice daily dosing interval with either 50 mg/kg of Porcupine inhibitor C59 (Cellagen Technology) or vehicle comprised of 0.5% methylcellulose + 0.1% Tween80, as previously described35. Mice were harvested 20h following the last dose of C59 and the intestine was harvested for FACS and histologic analysis.
Electron Microscopy
Small intestine tissue samples were fixed with 2.5% glutaraldehyde and post-fixed in 1% osmium tetroxide in 100mM phosphate buffer. Tissue was dehydrated, embedded in epoxy resin, and visualized by a JEOL transmission electron microscope at 120kV (model JEM-1210).
TOPflash Wnt reporter assays
L cells stably transfected with TOPflash dual reporter plasmid system (James Chen, Stanford University) were used in TOPflash dual luciferase assays (Promega Dual Luciferase kit) with Wnt3A conditioned medium from a stably transfected Wnt3A-expressing cell line (Roel Nusse, Stanford University) or recombinant Wnt3A (R&D). Recombinant murine Rspo1-4 (R&D) were used at 5 pM concentration each in these assays. Recombinant LGR5, Rnf43 and Znrf3 ECD proteins were expressed and purified as above and their purity and protein concentrations were determined by Coomassie-stained SDS-PAGE and Bradford assays. Assays were visualized with a Tecan M1000 luminometer. Recombinant scFv-DKK1c was expressed and purified per Janda et al.25
Surface plasmon resonance binding studies
The kinetics and affinity of interactions between Rspo1-4 and FLAG- and histidine-tagged LGR5 ECD, Fc-tagged Rnf43 ECD or Fc-tagged Znrf3 ECD were determined by surface plasmon resonance. Data were collected on the BIAcore T100 instrument (GE Healthcare). Approximately 1000 resonance units (RU) of recombinant murine Rspo1, 2, 3 or 4 (R&D) were immobilized on a CM5 sensor chip (GE Healthcare) using standard amine coupling. Increasing concentrations of LGR5 ECD, Rnf43 ECD or Znrf3 ECD were passed over the chip in HBS supplemented with 0.005% surfactant P20 (HBS+P). Binding phases for the LGR5 ECD were performed at 50 μl/min for 240 sec and dissociation phases were performed at 50 μl/min for 1850 sec. The chip was regenerated after each injection with 240-second washes with 0.5 M magnesium chloride. Binding and dissociation phases for the Rnf43 and Znrf3 ECDs were each performed at 50 μl/min for 120 sec. The chip was regenerated after each injection with 120-second washes with 1 M magnesium chloride. All curves were reference-subtracted from a flow cell containing 1000 RU of a negative control protein (hen egg white lysozyme or BSA). Curves were fitted using the BIAcore T100 evaluation software to a 1:1 model to determine the association rate (ka), dissociation rate (kd) and dissociation constant (KD). The kinetics and affinity of anti-Rspo antibody interactions with Rspo1-4 were determined as described for Rnf43 and Znrf3, except that the regeneration buffer was 25% ethylene glycol and 2.25 M magnesium chloride. The kinetics and affinity of Fc-tagged Rnf43 and Znrf3 ECDs are enhanced by avidity effects due to Fc-dimerization.
Yeast display of RSPO2
The Furin1 and Furin2 repeats of human RSPO2 were cloned into the pCT302 vector as a C-terminal fusion to a c-Myc epitope and the cell-wall protein Aga2. RSPO2 was displayed on the EBY100 strain of S. cerevisiae as previously described36. Competent yeast were electroporated with the RSPO2 expression plasmid and recovered in SDCAA selection media. The cultures were harvested in log phase, and yeast were then pelleted and resuspended in SGCAA induction media. Surface expression of RSPO2 was detected by staining yeast with a 488-labeled antibody to the c-Myc epitope (Cell Signaling #2279), labeled and monitored by FACS.
Binding of LGR5, Rnf43 and Znrf3 ECDs was tested by incubating yeast with 200 nM recombinant FLAG-tagged LGR5 ECD or with Fc-tagged Rnf43 ECD or Znrf3 ECD in PBS + 0.1% BSA for 2 hours, washing 2× with PBS + 0.1% BSA and then incubating for 30 min with an Alexa Fluor 647-labeled antibody to the FLAG epitope (Cell Signaling #3916S) (for LGR5 binding) or a PE-labeled anti-IgG antibody (eBioscience #12-4998-82). Cells were washed 2× with PBS +0.1% BSA and then analyzed by flow cytometry. Sequential staining of yeast was performed by incubating samples with 200 nM LGR5 ECD or Rnf43/Znrf3 ECDs alone, washing and then incubating with a mixture of (200 nM LGR5 ECD + 200 nM Rnf43 ECD) or (200 nM LGR5 ECD + 200 nM Znrf3 ECD). Cells stained with both LGR5 ECD and Rnf43/Znrf3 ECD were then washed and incubated with a mixture of PE-anti-IgG and 647-anti-FLAG prior to a final wash and analysis by flow cytometry.
Bulk cell RNA-Seq
RNA isolation
Cells were isolated by flow cytometry into RNEasy lysis buffer (Qiagen) from n=2–3 mice per condition, 1.5 days after injection of the appropriate adenoviruses. A 1.8× volume of AMPure beads (Beckman Coulter) was added to the thawed cell lysates. After a 30-min incubation at room temperature, the samples were washed 2× with 70% ethanol and eluted in 22 μl water. The samples were then digested with 0.6 mAU Proteinase K (Qiagen) in the presence of 1× NEB Buffer 1 (NEB) at 50°C for 20 min, followed by a heat inactivation step at 65°C for 10 min. A DNase digestion was performed using the RNase-Free DNase Set (Qiagen) at 37°C for 30 min. The samples were cleaned with a 1.8× volume of AMPure XP beads (Beckman Coulter). 1 ng of purified total RNA, as determined by Agilent Bioanalyzer (Agilent Technologies), was processed with the mRNA direct micro kit (Life Technologies) to select for poly A RNA. Each entire sample was input into the Ambion WT Expression Kit (Life Technologies) to perform double stranded cDNA synthesis followed by in vitro transcription to generate amplified cRNA. The cRNA was purified following the manufacturer’s instructions and the concentration was determined with a NanoDrop instrument (ThermoFisher). 1 μg of cRNA was fragmented in 1× Fragmentation Buffer (mRNA-Seq Sample Prep Kit, Illumina) at 94°C for 5 min, then placed on ice and the reaction was stopped by the addition of 20 mM EDTA. The fragments were precipitated with 70 mM sodium actetate (Life Technologies), 40 μg glycogen (Life Technologies) and 70% ethanol at −80°C for 1 hour followed by centrifugation and washing with 70% ethanol. 3 μg of random hexamer (Life Technologies) was added to the fragmented, purified cRNA and incubated at 70°C for 10 min to anneal the primer. The first strand reaction was performed with 200 units of SuperScript II (Life Technologies) with 0.625 mM dNTPs (NEB,) and 8U SUPERase RNase Inhibitor (Life Technologies) at 25°C for 10 min, then 42°C for 50 min, then 75°C for 15 min and cooled to 4°C. In second strand synthesis, 1× second strand buffer (Illumina) and 0.3 mM dNTPs (Illumina) were added and the samples were incubated at 4°C for 5 min before adding 50 units of DNA Polymerase (NEB) and 5 units of Rnase H (NEB). The samples were mixed well and incubated at 16°C for 2.5 hours, followed by purification with the MinElute Kit (Qiagen).
Library prep and sequencing
To perform library prep, the samples were end repaired using a Quick Blunting Kit (NEB) and incubated at 20°C for 1 hour, then 75°C for 30 min to inactivate the enzyme. A’ bases were added to the 3′ ends of each fragment with 2 mM dATP and 5 units of Klenow fragment 3′–5′ exo- DNA Polymerase (NEB) at 37°C for 45 min, followed by 75°C for 30 min to inactivate the enzyme. Using a quick ligase kit (NEB), 0.5 μM of adaptors were ligated to the cDNA fragments at 12°C for 75 min, then 80°C for 20 min and cooled to 4°C. These adaptors contain barcodes to facilitate sample multiplexing during sequencing. The adaptor sequence is preceded by four random nucleotides to add diversity to the pooled library. The samples were pooled by combining 5 μl of each library. After AMPure XP cleanup, one half of the pooled library was run on the Pippin Size Selection Instrument (Sage Sciences) to select for 200 bp fragments. Library amplification was performed on one half of the Pippin eluate in 1× Phusion GC buffer with 0.2 mM dNTPs, 0.1 μM forward primer (IDT), 0.1 μM reverse primer, 1 unit of Phusion Hot Start II Polymerase (Thermo Fisher Scientific). The reaction was run with the following program: 98°C for 30 sec, then 15 cycles of 98°C for 10 sec, 65°C for 30 sec, 72°C for 30 sec, then 72°C for 4 min and cooled to 4°C. The amplified library was cleaned using a 1× volume of AMPure XP beads and QC was run with the Agilent Bioanalyzer DNA 1000 kit, followed by concentration determination by qPCR using the KAPA Library Quantification Kit (KAPA Biosystems). To perform sequencing, the library was diluted to 4 nM and denatured with 0.1 N NaOH. Following denaturation, the library was further diluted to 4 pM and run on the Illumina HiSeq 2500 in paired-end, 100×100bp format.
Forward adapter sequence:
5′ /5Phos/ATCGCACNNNNAGATCGGAAGAGCGGTTCAGCAGGAATGCCGAG 3′
Reverse adaptor sequence:
5′ ACACTCTTTCCCTACACGACGCTCTTCCGATCTNNNNGTGCGATT 3′
Red=sample specific barcode sequence
Blue=T overhang to enable TA ligation
Reverse library amplification primer (PAGE ultramer):
5′ CAAGCAGAAGACGGCATACGAGATC 3′
Forward library amplification primer (PAGE ultramer):
5′ AATGATACGGCGACCACCGAGATCTA 3′
Bioinformatics analysis for bulk cell RNA-seq
Sequenced reads were aligned to the mouse reference genome mm9 (UCSC) using TopHat37 with the transcript annotation supplied. The mapped reads was assigned to gene using the tool htseq-count of the Python package HTseq38, with the default union-counting mode. The output of htseq-count was used as input for DESeq239 to perform differential expression analysis, with a FDR of 10% as the cutoff. In addition, a filtering criterion of mean FPKM 1 in at least one condition was used to define expressed transcripts in each differential expression analysis. Cufflinks40 was used to calculate gene count and perform FPKM normalization. GO term analysis was performed using DAVID functional annotation tool41. A FDR of 10% was applied to evaluate the significance.
Single-cell RNA-seq
Single-cell sequencing library construction using the GemCode platform
Lgr5-eGFP-IRES-CreER mice were treated with adenovirus in vivo and then 26h post-treatment, the proximal jejunum was harvested to generate a single cell suspension and FACS isolated using the endogenous GFP signal, as above. The sorted cellular suspensions were loaded on a GemCode Single Cell Instrument (10x Genomics, Pleasanton, CA) to generate single-cell GEMs. Approximately ~1200–2800 cells were loaded per channel. Two technical replicates were generated per sorted cell suspension. Single-cell RNA-Seq libraries were prepared using GemCode Single Cell 3′ Gel Bead and Library Kit (now sold as P/N 120230, 120231, 120232, 10x Genomics) as per Zheng et. al29. Sequencing libraries were loaded at 2.1pM on an Illumina NextSeq500 with 2 × 75 paired-end kits using the following read length: 98bp Read1, 14bp I7 Index, 8bp I5 Index and 5bp Read2. Note that these libraries were generated before the official launch of GemCode Single Cell 3′ Gel Bead and Library Kit. Thus 5bp UMI was used (the official GemCode Single Cell 3′ Gel Bead contains 10bp UMI.).
Alignment, barcode assignment and UMI counting
The Cell Ranger Single Cell Software Suite was used to perform sample demultiplexing, barcode processing, and single cell 3′ gene counting (http://software.10xgenomics.com/single-cell/overview/welcome). 5bp UMI tags were extracted from Read2.
PCA and T-SNE analysis
We analyzed a total of 13,247 single cells, comprised of 11,268 FACS-sorted Lgr5-eGFP(+) and 1,979 Ad Fc-treated Lgr5-eGFP(−) cells. Two technical replicates (the number of cells recovered per channel ranges from ~400 to 1,400 cells) were generated from each treatment condition. The mean raw reads per cell varied from ~45k to 86k. Each sample was downsampled to 28,439 confidently mapped reads per cell. Then the gene-cell barcode matrix from each sample was concatenated.
The gene-cell barcode matrix was filtered based on number of genes detected per cell (any cells with less than 400 or more than 4400 genes per cell were filtered) and percentage of mitochondrial UMI counts (any cells with more than 10% of mitochondrial UMI counts were filtered). Altogether, 13,176 cells, and 15,865 genes were kept for analysis by the Seurat R package30. Among these 13,176 cells, 74 did not show any epithelial cell markers so they were removed leaving a total of 13,102 cells, comprised of 1925 Ad Fc-treated Lgr5(−) cells and 11,177 Lgr5-eGFP(+) cells across six conditions.
2,289 variable genes were selected based on their expression and dispersion (expression cutoff=0.0125, and dispersion cutoff=0.5). The first 11 principal components were used for the T-SNE projection and clustering analysis (resolution=0.3, k.seed=100).
We applied sSeq from Yu et al.42 to identify genes that are enriched in a specific cluster (the specific cluster is assigned as group a, and the rest of clusters is assigned as group b). There are a few differences between our implementation and Yu et al. 1) we used the ratio of total UMI counts and median of total UMI counts across all cells) as the size factors. 2) The quantile rule of thumb was used to estimate the shrinkage target. 3) For genes with large counts, an asymptotic approximation from the edgeR package43 was used instead of the NB exact test to speed up the computation.
For the heatmap in Extended Data Fig. 9h, the gene list was furthered filtered requiring minimum UMI counts of 5 in each group, with a positive log2 fold change of mean expression between the 2 groups, and an adjusted p<0.01. Top 10 genes specific to each cluster was picked, and their mean expression was center scaled before used for the heatmap.
Classification of cells was inferred from the annotation of cluster-specific genes. The stem cell clusters (clusters 0 and 1) were marked by enrichment of Lgr5, Olfm4, and Ascl2. Non-cycling and cycling stem cells were distinguished by the enrichment of cell cycle markers such as Mki67 and Tuba1b. Transit amplifying cells (cluster 2) were classified based on the enrichment of cell cycle markers and lack of Lgr5+ stem cell marker expression. Interestingly, there are genes that are specifically enriched in cluster 2, such as Gjb3 and Fgfbp1. Enterocytes (clusters 3 and 4) were annotated based on the enrichment of markers such as Alpi and Reg1 and prior studies31. Goblet cells (cluster 5) were annotated based on the enrichment of markers such as Muc2 and Guca2a. Paneth cells (cluster 6) were annotated based on the enrichment of Defa genes. Tuft cells (cluster 7) were annotated based on the enrichment of markers such as Dclk1 and Hck. EE cells (cluster 8) were annotated based on the enrichment of markers such as Chga and Chgb.
Pseudobulk analysis of single-cell RNA-seq data
To compare the global expression difference between samples and Fc, we first normalized gene expression by the sum of their UMI counts across all cells in the sample (adding 1 to the numerator and denominator to avoid dividing by 0 for genes that were not detected at all). Then we compared the normalized gene expression between the sample to Fc.
To generate the heatmap, we furthered filtered the gene list: 1) Only genes with UMI counts > 2 in each sample and a log2 fold change of >1 were considered. 2) The top 15 up- or down-regulated genes were picked per sample-Fc comparison, and the union of all genes was used for the heatmap.
DATA AVAILABILITY
Data generated during this study are available in the Gene Expression Omnibus (GEO) repository (GSE92377 and GSE92865).
Extended Data
Extended Data Fig. 1. Characterization of recombinant ectodomain proteins and adenoviruses for Rspo inhibition.
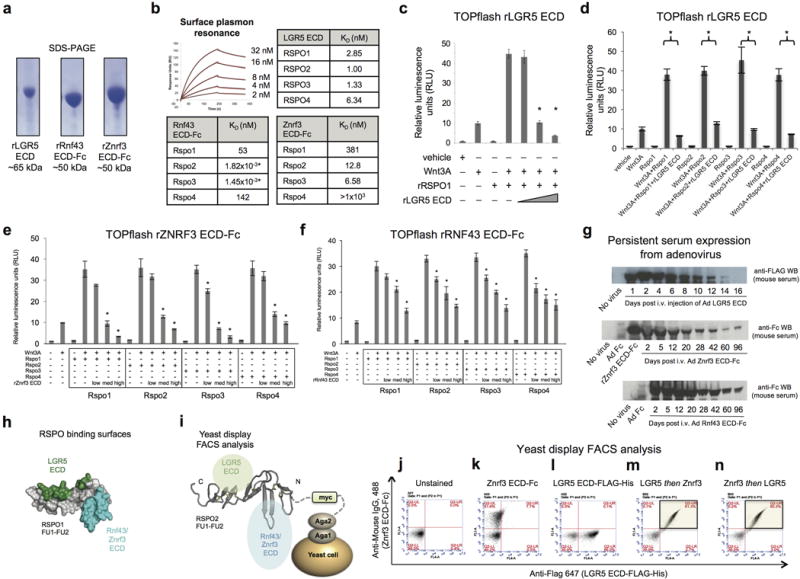
a, Recombinant LGR5 ECD, Rnf43 ECD-Fc and Znrf3 ECD-Fc proteins purified by Ni-NTA affinity chromatography, Coomassie-stained SDS-PAGE. b, Top, Surface plasmon resonance analysis of LGR5 ECD binding to immobilized recombinant human RSPO1-4. Traces for RSPO1 are shown. Bottom, Binding of Rnf43 ECD-Fc or Znrf3 ECD-Fc to murine Rspo1-4. c,d, Recombinant LGR5 ECD inhibits recombinant human RSPO1 or recombinant murine Rspo1-4 in TOPflash Wnt reporter gene assay. Error bars represent S.E.M., *p<0.05. e, Recombinant Znrf3 ECD (murine Znrf3 ECD-Fc fusion) inhibits recombinant murine Rspo1-4 in TOPflash Wnt reporter assay. f, Recombinant Rnf43 ECD (murine Rnf43 ECD-Fc fusion) inhibits recombinant murine Rspo1-4 in TOPflash Wnt reporter assay. Error bars represent S.E.M. Low, med and high refer to 50:1, 250:1, 1000:1 molar ratios of the respective recombinant ECD to the appropriate Rspo protein. *p < 0.05 versus the appropriate no ECD condition. g, Time course of serum expression following single i.v. injection of adenoviruses into C57Bl/6 mice. Top, Anti-FLAG Western blot was performed on serum at the indicated times post- infection with Ad LGR5 ECD (FLAG-tagged). Middle, Time course of serum expression of Znrf3 ECD-Fc fusion following single i.v. injection of Ad Znrf3 ECD. Anti-IgG2α Fc Western blot. Bottom, Time course of serum expression of Rnf43 ECD-Fc fusion following single i.v. injection of Ad Rnf43 ECD into C57Bl/6 mice. Anti-IgG2α Fc Western blot. h, LGR5 ECD and Znrf3 ECD bind simultaneously and non-exclusively to RSPO. Structure of RSPO1 (residues 40–132) highlighting distinct LGR5 ECD and Znrf3/Rnf43 ECD binding interfaces. i, Schematic of yeast display FACS experiment in which human RSPO2 is displayed on the extracellular surface via Aga2-myc fusion. j–l, Unstained control for RSPO2 Furin1-Furin2 domain-expressing yeast (j) or stained individually with 500 nM LGR5 ECD-FLAG-His or Znrf3-Fc ECD (k,l). m,n, Yeast were also stained sequentially with 500 nM LGR5 ECD-FLAG-His, washed, and then stained with a mixture of 500 nM Znrf3 ECD-Fc + 500 nM LGR5 ECD-FLAG-His to prevent competition or dissociation of LGR5 ECD-FLAG-His. Znrf3 ECD-Fc was detected with Alexa Fluor 488-conjugated anti-mouse IgG. LGR5 ECD-FLAG-His was detected with Alexa Fluor 647-conjugated anti-FLAG (m). The order of this experiment was then reversed (Znrf3 ECD-Fc first, then Znrf3 ECD-Fc + LGR5 ECD-FLAG-His) (n). The ability of the Znrf3 and LGR5 ECDs to simultaneously bind to RSPO2 is shown by FACS staining in the upper right quadrant (light green shading) (m,n).
Extended Data Fig. 2. Time course of Ad LGR5 ECD-induced ablation of Lgr5+ ISCs.
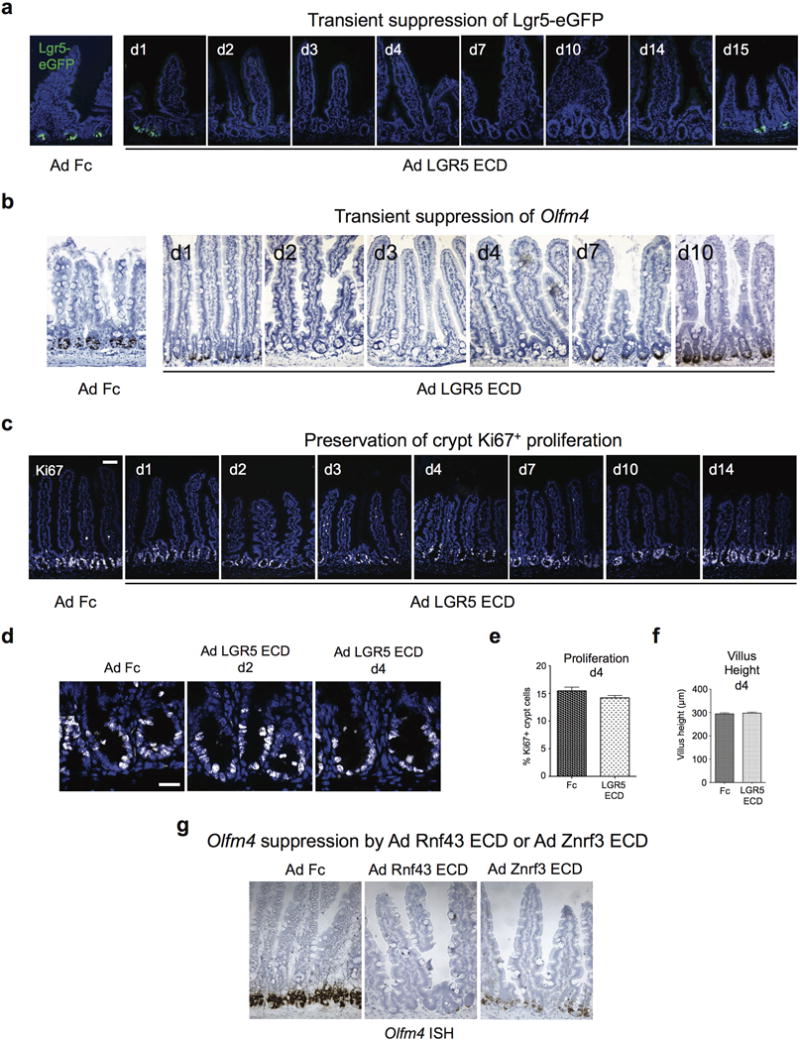
a, Lgr5-eGFP+ ISC signal is transiently lost from days 2–14 after single i.v. injection of Ad LGR5 ECD, correlating with duration of transgenic overexpression of LGR5 ECD in sera of mice. Note that LGR5 ECD does not ablate the crypt compartment despite loss of Lgr5-eGFP+ ISC signal. b, Crypt-based Olfm4 expression is transiently lost from days 2–7 after single i.v. injection of Ad LGR5 ECD. Olfm4 mRNA in situ hybridization. c, LGR5 ECD does not ablate crypt Ki67+ proliferation after Ad LGR5 ECD despite loss of Lgr5+ ISC signal. Bar = 50 mm. d, Higher magnification crypt images of Ki67+ cells after LGR5 ECD treatment. Bar = 20 mm. e, Quantitation of d. Error bars represent S.E.M., p=0.1215. f, Villus heights are not altered by LGR5 ECD. Error bars represent S.E.M., p=0.2971. g, Strong suppression of Olfm4 in situ hybridization is observed on day 3 following treatment of mice with either Ad Rnf43 ECD or Ad Znrf3 ECD. Jejunum is shown.
Extended Data Fig. 3. LGR5 ECD reduces ISC/progenitors but not via apoptosis.
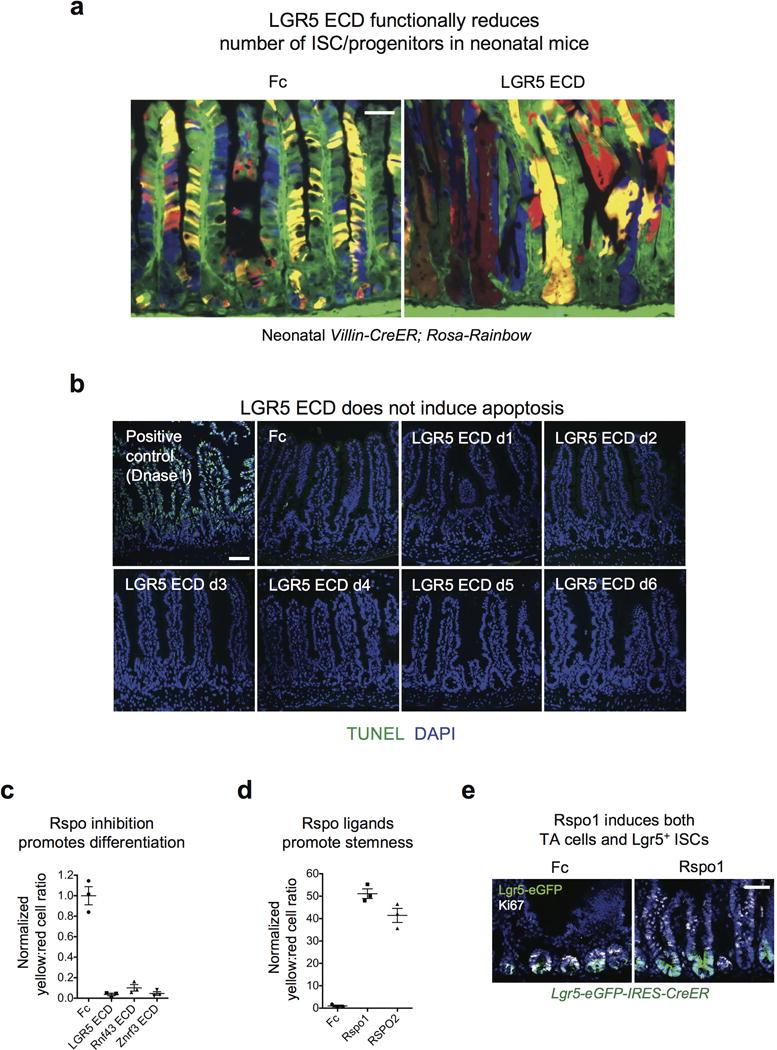
a, LGR5 ECD functionally reduces number of ISC/progenitors in neonatal mice. Multi-color clonal labeling of intestinal epithelial cells in jejunum of neonatal Villin-CreER; Rosa26-Rainbow mice, 8 days post-tamoxifen induction resulting in stochastic clonal labeling to one of four fluorescent colors and 7 days post-infection with Ad LGR5 ECD compared to control Ad Fc. Ad LGR5 ECD induced premature crypt monoclonality, reflecting a functional decrease in the number of clones functioning to repopulate the epithelium under conditions of Rspo inhibition, consistent with a marked reduction in ISC/progenitor number. Bars = 50 mm. b, LGR5 ECD does not induce apoptosis. TUNEL staining of jejunum at the indicated days after single i.v. injection of Ad LGR5 ECD into mice reveals absence of crypt apoptosis. Positive control TUNEL staining after DNase I treatment of sections is also shown. Bar = 50 mm. c, FACS quantitation of yellow:red (Lgr5+ ISC:differentiated) cell ratio from Fig. 2a. Error bars represent S.E.M. d, FACS quantitation of yellow:red (Lgr5+ ISC:differentiated) cell ratio from Fig. 2d, d4 post-treatment. Error bars represent S.E.M. e, Ad Rspo1 expands both Lgr5+ ISCs and Lgr5− Ki67+ proliferative crypt cells consistent with ISC and TA expansion. Bar = 50 mm.
Extended Data Fig. 4. Multi-lineage differentiation upon LGR5, Rnf43 or Znrf3 ECD treatment.
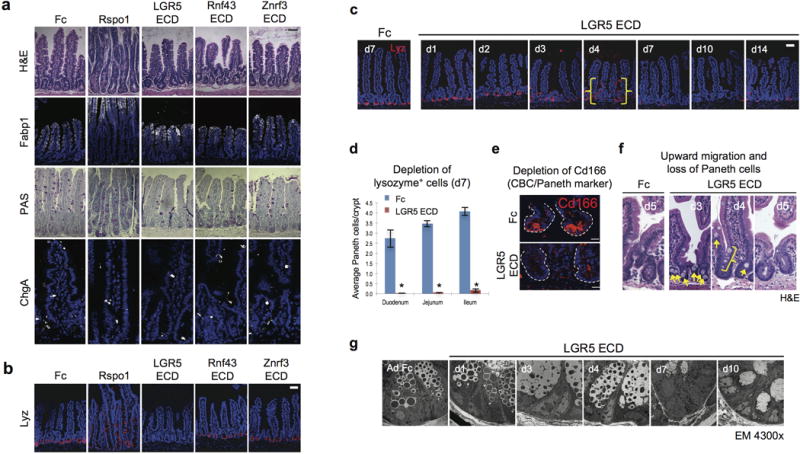
a, Enterocyte, goblet and enteroendocrine differentiation are preserved upon LGR5, Rnf43 or Znrf3 ECD treatment. Adult mice received single i.v. injection of the indicated adenoviruses encoding soluble ECDs of LGR5, Rnf43 (Fc fusion) or Znrf3 (Fc fusion), or Rspo1 (Fc fusion) and the jejunum was analyzed at d7 after injection by H&E or histology with anti-Fabp1 (enterocyte), PAS (goblet) or anti-ChgA (enteroendocrine). Multi-lineage differentiation was maintained. b, LGR5 ECD but not Rnf43 ECD or Znrf3 ECD induces Paneth cell loss (d7 post-infection). Bars = 50 mm. c, LGR5 ECD induces transient Paneth cell loss. Time course of lysozyme expression in jejunum following single i.v. injection of Ad LGR5 ECD into mice. Bar = 50 mm. Note ballooning degeneration and upward migration of lysozyme+ Paneth cells at d3–4 (yellow brackets), followed by near-total Paneth cell loss at d7–10 and return of Paneth cells at d14 post-injection. The Paneth cell loss (after d3) occurs after the loss of Lgr5-eGFP signal (d2, Extended Data Fig. 2) and Paneth cell return correlates with the time course of disappearance of adenoviral LGR5 ECD serum expression (Extended Data Fig. 1g). d, Quantitation of Paneth cell loss in small intestine, d7, n=3 animals/condition, Error bars represent S.E.M., *= P<0.05. e, Ad LGR5 ECD induces loss of anti-Cd166 immunofluorescence (CBC/Paneth marker), jejunum, d7 after adenovirus treatment. f, H&E reveals ballooning degeneration and upward migration of lysozyme+ Paneth cells after Ad LGR5 ECD treatment (yellow brackets and arrows), consistent with an intermediate cell phenotype. g, Electron microscopy analysis of intestinal crypts after Ad LGR5 ECD i.v. injection reveals ballooning degeneration at d3–4 followed by Paneth cell loss by d7.
Extended Data Fig. 5. Wnt analog scFv-DKK1c functions via Fzd receptors to support Lgr5+ ISCs and can substitute for endogenous Wnts.
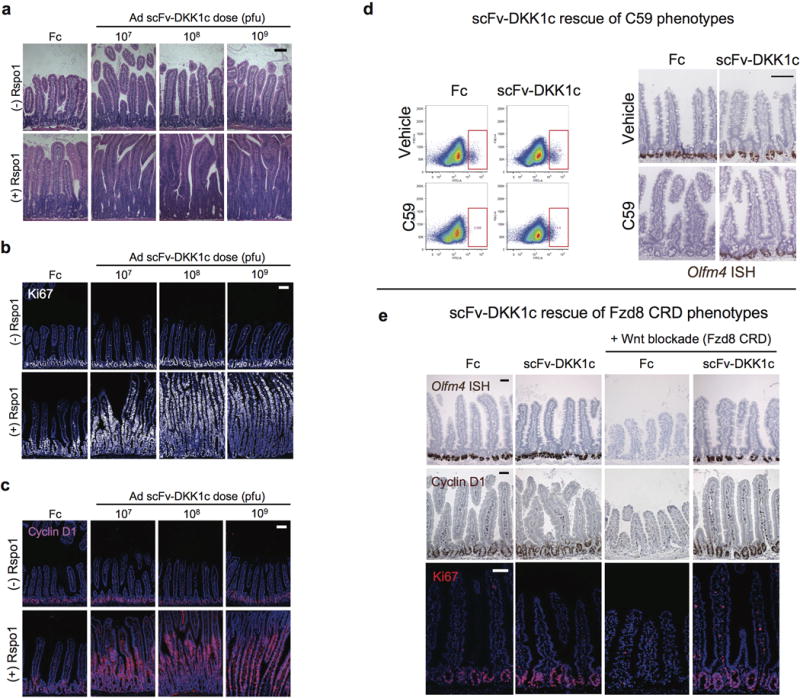
a–c, Dose-dependent effects of Ad scFv-DKK1c +/− Ad Rspo1 on the intestinal epithelium. H&E of jejunum on d4 post-adenovirus treatment (a). Mice were treated with adenovirus titers of 107 to 109 pfu. Ki67+ proliferation of jejunum on d4 after adenovirus injection (b). Dose-dependent effects of scFv-DKK1c on Wnt target gene cyclin D1 (c). Jejunum, IF, d4 post-adenovirus. Bars = 100 mm. d, Wnt analog scFv-DKK1c functionally substitutes for endogenous Wnts in vivo to rescue Lgr5+ ISC from C59-mediated loss. Loss of Lgr5-eGFP reporter signal (red box) by FACS analysis (left) and Olfm4 expression (right) from jejunum of mice treated with the small molecule Porcn inhibitor C59. Adenoviral overexpression of scFv-DKK1c prevents C59-mediated ablation of the reporter signal. Mice were treated with C59 for a total of 4 days that began 2 days following adenovirus injection. Bar = 100 mm. e, Wnt analog scFv-DKK1c rescues in vivo phenotypes elicited by the Wnt antagonist Fzd8 CRD. Ad Fzd8 CRD-mediated loss of Olfm4 (top), Wnt target gene CD44 (middle) and Ki67+ crypt proliferation (bottom) are rescued by concomitant adenoviral overexpression of scFv-DKK1c. Jejunum, d4 following treatment with adenovirus. Bars = 50 mm.
Extended Data Fig. 6. Functional characterization of scFv-DKK1c overexpression in vivo.
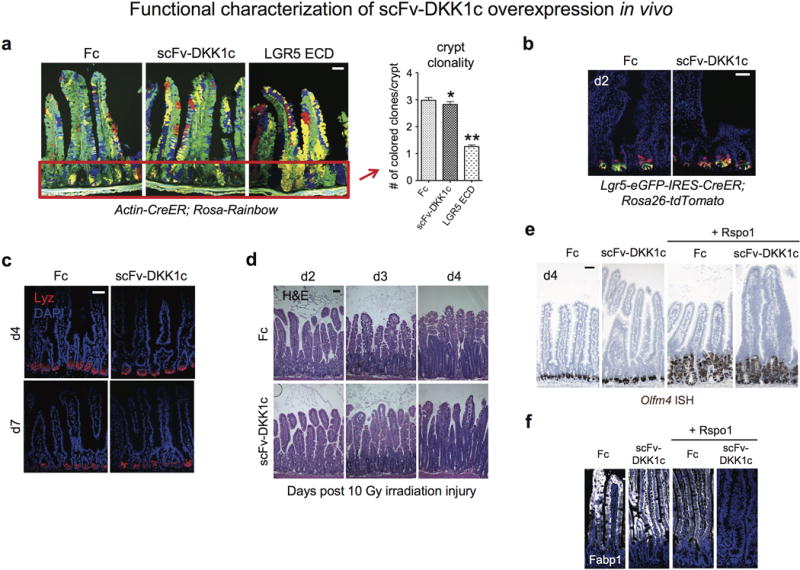
a, Crypt clonality in Actin-CreER; Rosa-Rainbow mice on d8 post-tamoxifen to clonally label cells and d7 post adenovirus injection. Recombinant adenovirus encoding either Fc, scFv-DKK1c or LGR5 ECD was adminstered as a single i.v. injection into mice. IF (left), Red box indicates an example of crypt areas used for quantitation. Bar = 50 mm. Quantitation of crypt clonality (right). Crypt clonality is not altered by scFv-DKK1c versus Fc control (*P=0.2854), whereas LGR5 ECD treatment quickly establishes crypt monoclonality (i.e. single color), ** P<0.0001. Error bars represent S.E.M. b, Lineage tracing kinetics of scFv-DKK1c treatment, d2 post simultaneous tamoxifen and adenovirus treatment. Bar = 50 mm. c, Paneth cell homeostasis is not perturbed by scFv-DKK1c overexpression. d4 and d7 post-adenovirus treatment, jejunum. Bars = 50 mm. d, Wnt analog scFv-DKK1c does not accelerate radiation injury-induced epithelial repair. H&E following 10 Gy total body irradiation injury. Jejunum. Mice were pre-treated with adenovirus encoding either Fc or scFv-DKK1c 2 days prior to 10 Gy irradation. Bar = 50 mm. e, Wnt analog scFv-DKK1c does not expand Olfm4+ ISCs. Olfm4 ISH demonstrates lack of Olfm4 expansion upon Ad scFv-DKK1c treatment compared to control and combinatorial treatment with Rspo1 does not expand Olfm4+ CBCs beyond the actions of Rspo1 alone. Jejunum, d4 post-treatment. Bar = 50 mm. f, Proliferative villus cells in Fig. 4a and Extended Data Fig. 6e do not express Fabp1 by IF staining.
Extended Data Fig. 7. Comparative effects of scFv-DKK1c, Wnt3A and scFV-DKK1c-RSPO2 adenoviruses on the intestinal epithelium.
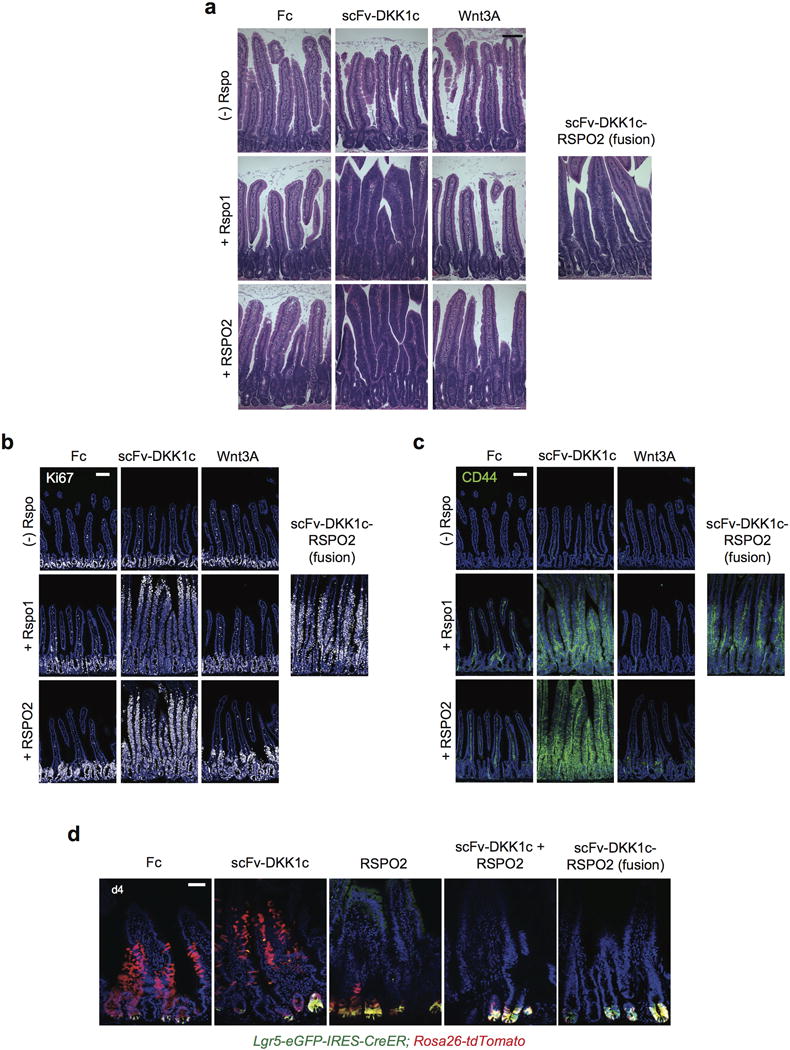
a–c, Mice were treated with adenovirus encoding either scFv-DKK1c or Wnt3A with or without Rspo1/2 or scFv-DKK1c-RSPO2 and tissue was harvested on d4 following treatment. The single chain polypeptide scFv-DKK1c-RSPO2 phenocopies combinatorial treatment with scFv-DKK1c + Rspo. The effects of scFv-DKK1c-RSPO2 were present in a proximal-distal gradient and were confined to the proximal small intestine, in contrast to the effects of scFv-Dkk1c + Rspo1 or scFv-DKK1c + RSPO2 which were pervasive throughout the small intestine. a, H&E of jejunum on D4 post-treatment. b, Ki67 IF. c, CD44 IF. a-c, Bars = 100 mm. d, Lgr5-eGFP-IRES-CreER; Rosa26-tdTomato mice were treated simultaneously with tamoxifen and i.v. adenovirus. Tissue was harvested on d4 post-treatment. Notably, neither treatment with combined scFv-DKK1c + RSPO2 nor the single chain polypeptide scFv-DKK1-RSPO2 alters the lineage tracing of Lgr5+ ISCs compared to RSPO2 alone. Bar = 50 mm.
Extended Data Fig. 8. Wnt analog scFv-DKK1c does not substitute for Rspo loss in vivo.
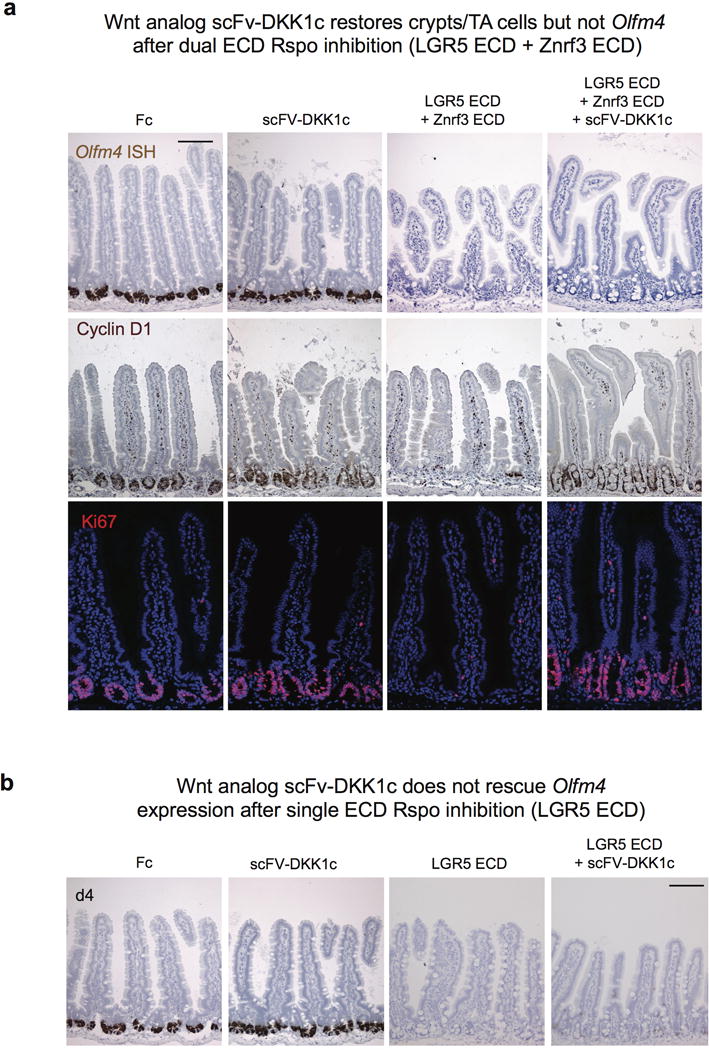
a, Wnt analog scFv-DKK1c restores crypts but not Olfm4 after dual ECD Rspo inhibition (LGR5 ECD + Znrf3 ECD). Adenoviral overexpression of scFv-DKK1c does not rescue combined LGR5 ECD and Znrf3 ECD-mediated loss of Olfm4 expression (top), despite reversing loss of the Wnt target gene cyclin D1 (middle) as well as Ki67+ crypt proliferation (bottom). Jejunum, d4 following treatment. Bar = 100 mm. b, Wnt analog scFv-DKK1c does not rescue Olfm4 expression after single ECD Rspo inhibition (LGR5 ECD). Olfm4 ISH, jejunum, d4 following treatment with adenovirus. Bar = 100 mm.
Extended Data Figure 9. Single-cell RNA-seq PCA and clustering.
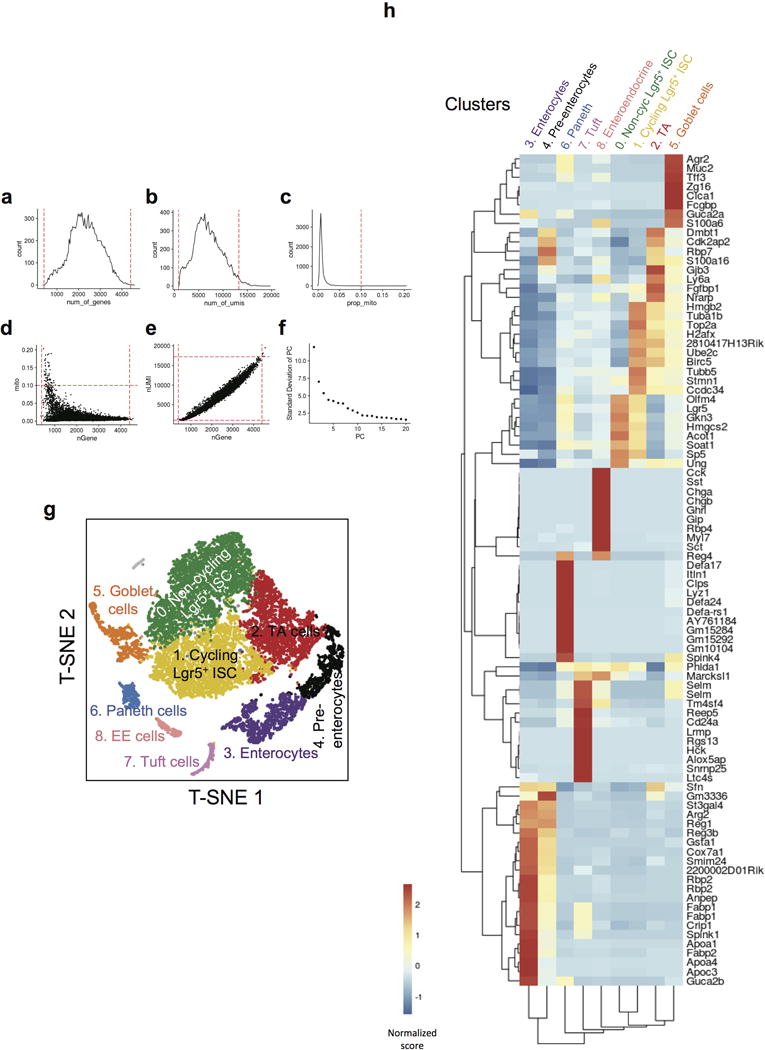
a–f, Single-cell RNA-seq QC metrics used to filter out cells before PCA and clustering. a, Distribution of number of genes detected per cell. Cells with more than 400 genes, but less than 4400 genes were selected for PCA analysis (red dashed lines). b, Distribution of number of UMIs detected per cell. Cells with more than 861 UMIs, but less than 13250 UMIs were selected for PCA analysis (red dashed lines). c, Distribution of percentage of mitochondria UMIs per cell. Cells with less than 10% mitochondrial UMIs were selected for PCA analysis (red dashed lines). d, Number of genes and percentage of mitochondria UMIs detected per cell. e, Number of genes and UMIs detected per cell. f, Standard deviation of PC. g–h, 9 distinct clusters were detected among >13,000 single cells analyzed by single cell RNA-seq. g, T-SNE projection of single cells, colored by inferred cell type assignment. h, Normalized expression (centered) of the top variable genes (rows) from each of 9 clusters (columns) is shown in a heatmap. Numbers at the top indicate cluster number in g, with connecting lines indicating the hierarchical relationship between clusters. Gene symbols of markers from each cluster are shown on the right.
Extended Data Fig. 10. Gene expression of additional marker genes in single cell RNA-seq clusters upon Wnt versus Rspo modulation in vivo.
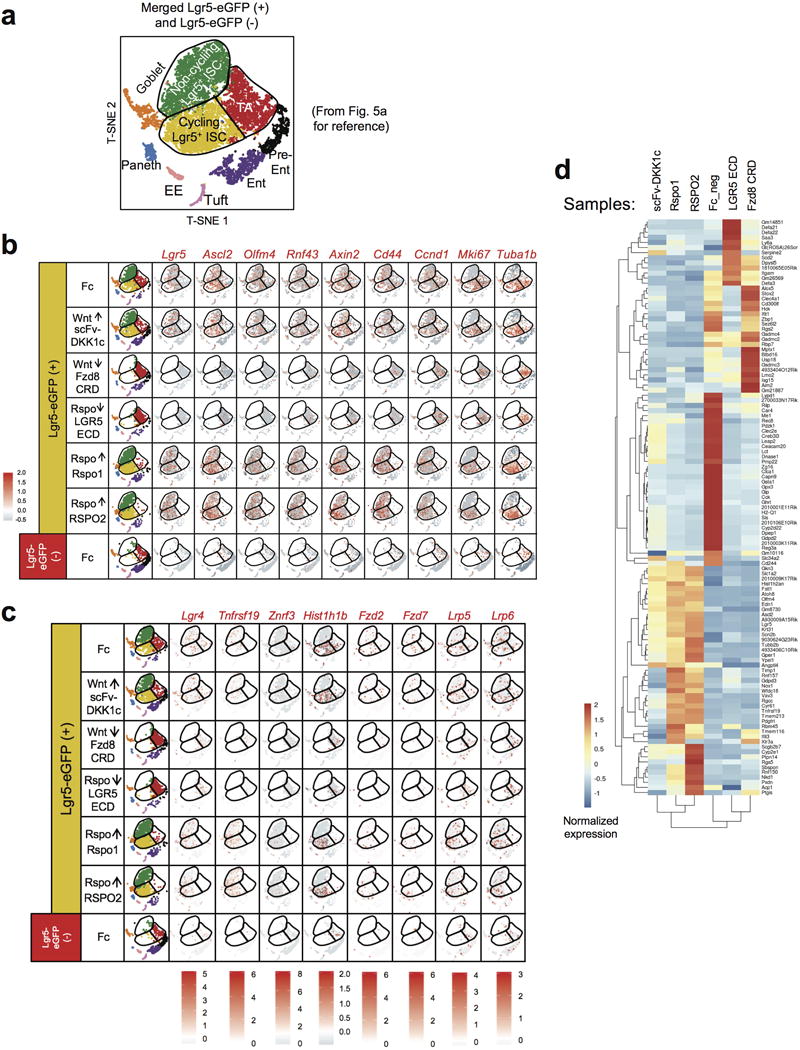
a, Reproduction of Fig. 5a for reference. b, T-SNE projection of >13,000 single cells divided over the 7 conditions, with each cell colored based on their normalized expression of the indicated genes. UMI normalization was performed by first dividing UMI counts by the total UMI counts in each cell, followed by multiplication with the median of the total UMI counts across cells and calculation of the natural log of the UMI counts. Finally, each gene was normalized such that the mean signal for each gene is 0, and standard deviation is 1. Note repression of CBC identify genes (Lgr5, Ascl2, Olfm4, Rnf43), and Axin2 by LGR5 ECD and Fzd8 CRD. Further, Mki67 and Tuba1b are expressed in cycling Lgr5+ ISC and TA cells but not non-cycling Lgr5+ ISC at homeostasis (Fc) but are restricted only to TA cells after LGR5 ECD and Fzd8 CRD. c, Similar T-SNE analysis of Fig. 5a for additional loci of interest (Lgr4, Tnfrsf19, Znrf3, Hist1h1b, Fzd2, Fzd7, Lrp5 and Lrp6). d, Normalized expression (centered) of the top variable genes (rows) of each sample (columns) against Fc from Fig. 5a is shown in a heatmap. Sample numbers are shown at the top, with connecting lines indicating the hierarchical relationship between samples (based on the top variable genes identified). Gene symbols of markers from each cluster are shown on the right. “Fc_neg” indicates the Lgr5-eGFP(−) population from an Ad Fc-treated mouse.
Supplementary Material
Acknowledgments
We are indebted to members of the Kuo lab, Roel Nusse, Lucy O’Brien, Donna Bouley, Jill Carrington and Hans Clevers for helpful discussions, Roel Nusse for Wnt3A-expressing cells and Fzd8 CRD cDNA and Sylvie Robine for Villin-CreER mice. We thank the Stanford Histology, Functional Genomics, Confocal, Neuroscience Imaging and Stanford Shared FACS Facility Cores. This work was supported by CIRM MD Scholar Fellowships (K.S.Y. and A.O), an AHA Postdoctoral Fellowship (J.C.), a Cancer Research Institute Irvington Fellowship (V.S.L), BWF CAMS (K.S.Y.), NIH K08DK096048 (K.S.Y.), NIH K08DK100739 (A.H.) and the Ludwig Fund for Cancer Research (C.J.K., K.C.G.). C.J.K., P.D., R.J.F., S.J.H. and M.W. were supported by the Intestinal Stem Cell Consortium (NIH U01DK085527, U01DK085547, U01DK085525) which was funded by the NIDDK and NIAID. K.C.G was supported by HHMI, the Stinehart/Reed Foundation, and NIH R01GM097015 and C.J.K. by an AHA Innovative Science Award and NIH U01CA168424, U19AI116484 and U01CA151920.
Footnotes
AUTHOR CONTRIBUTIONS
K.S.Y. conceived, designed, and performed experiments, analyzed data, and wrote the manuscript. J.C., J.Y., A.J.H. helped with adenovirus cloning. K.A.L. and K.R. assisted with histology and in vivo experiments. C.Y.J., V.C.L. and K.C.G. contributed to biophysical studies. L.A.C., A.O., M.L., P.S.D, R.J.F., A.T.M., M.H.W., S.J.H. assisted with characterization of LGR5 ECD and Fzd8 CRD. H.U. and I.L.W. contributed Rainbow mice. C.R.B., J.W., X.L., A.H., and M.P.S. helped with bulk RNA-seq analysis. G.X.Y.Z., A.H., J.M.T., P.B., S.B.Z., H.O., and T.S.M. were involved in single-cell experiments. C.J.K. conceived and designed experiments, analyzed data and wrote the manuscript.
The authors declare competing financial interests. C.Y J., K C.G and C.J.K. are equity shareholders in Surrozen, Inc., which is developing bioengineered Wnt surrogates. G.X.Y.Z., J.M.T., P.B., S.B.Z., H.O., and T.S.M. are equity shareholders in 10x Genomics, Inc., which is developing genomics and single cell transcriptomics technologies.
References
- 1.Clevers H, Loh KM, Nusse R. Stem cell signaling. An integral program for tissue renewal and regeneration: Wnt signaling and stem cell control. Science. 2014;346:1248012. doi: 10.1126/science.1248012. doi:346/6205/1248012 [pii] 10.1126/science.1248012 [doi] [DOI] [PubMed] [Google Scholar]
- 2.Willert K, et al. Wnt proteins are lipid-modified and can act as stem cell growth factors. Nature. 2003;423:448–452. doi: 10.1038/nature01611. [DOI] [PubMed] [Google Scholar]
- 3.Janda CY, Waghray D, Levin AM, Thomas C, Garcia KC. Structural basis of Wnt recognition by Frizzled. Science. 2012;337:59–64. doi: 10.1126/science.1222879. doi:science.1222879 [pii] 10.1126/science.1222879 [doi] [DOI] [PMC free article] [PubMed] [Google Scholar]
- 4.Miyoshi H, Ajima R, Luo CT, Yamaguchi TP, Stappenbeck TS. Wnt5a potentiates TGF-beta signaling to promote colonic crypt regeneration after tissue injury. Science. 2012;338:108–113. doi: 10.1126/science.1223821. doi:science.1223821 [pii] 10.1126/science.1223821 [doi] [DOI] [PMC free article] [PubMed] [Google Scholar]
- 5.Pinto D, Gregorieff A, Begthel H, Clevers H. Canonical Wnt signals are essential for homeostasis of the intestinal epithelium. Genes Dev. 2003;17:1709–1713. doi: 10.1101/gad.267103. [DOI] [PMC free article] [PubMed] [Google Scholar]
- 6.Kuhnert F, et al. Essential requirement for Wnt signaling in proliferation of adult small intestine and colon revealed by adenoviral expression of Dickkopf-1. Proc Natl Acad Sci U S A. 2004;101:266–271. doi: 10.1073/pnas.2536800100. [DOI] [PMC free article] [PubMed] [Google Scholar]
- 7.Barker N, et al. Identification of stem cells in small intestine and colon by marker gene Lgr5. Nature. 2007;449(7165):1003–1007. doi: 10.1038/nature06196. [DOI] [PubMed] [Google Scholar]
- 8.Yan KS, et al. The intestinal stem cell markers Bmi1 and Lgr5 identify two functionally distinct populations. Proc Natl Acad Sci U S A. 2012;109:466–471. doi: 10.1073/pnas.1118857109. doi:1118857109 [pii] 10.1073/pnas.1118857109 [doi] [DOI] [PMC free article] [PubMed] [Google Scholar]
- 9.Clevers H. The intestinal crypt, a prototype stem cell compartment. Cell. 2013;154:274–284. doi: 10.1016/j.cell.2013.07.004. doi:S0092-8674(13)00838-6 [pii] 10.1016/j.cell.2013.07.004 [doi] [DOI] [PubMed] [Google Scholar]
- 10.Xie Y, et al. Interaction with both ZNRF3 and LGR4 is required for the signalling activity of R-spondin. EMBO Rep. 2013 doi: 10.1038/embor.2013.167. doi:embor2013167 [pii] 10.1038/embor.2013.167 [doi] [DOI] [PMC free article] [PubMed] [Google Scholar]
- 11.de Lau W, et al. Lgr5 homologues associate with Wnt receptors and mediate R-spondin signalling. Nature. 2011;476:293–297. doi: 10.1038/nature10337. doi:nature10337 [pii] 10.1038/nature10337 [doi] [DOI] [PubMed] [Google Scholar]
- 12.Carmon KS, Gong X, Lin Q, Thomas A, Liu Q. R-spondins function as ligands of the orphan receptors LGR4 and LGR5 to regulate Wnt/beta-catenin signaling. Proc Natl Acad Sci U S A. 2011;108:11452–11457. doi: 10.1073/pnas.1106083108. 1106083108 [pii] 10.1073/pnas.1106083108 [doi] [DOI] [PMC free article] [PubMed] [Google Scholar]
- 13.Glinka A, et al. LGR4 and LGR5 are R-spondin receptors mediating Wnt/beta-catenin and Wnt/PCP signalling. EMBO Rep. 2011;12:1055–1061. doi: 10.1038/embor.2011.175. doi:embor2011175 [pii] 10.1038/embor2011175 [doi] [DOI] [PMC free article] [PubMed] [Google Scholar]
- 14.Kim KA, et al. Mitogenic influence of human R-spondin1 on the intestinal epithelium. Science. 2005;309:1256–1259. doi: 10.1126/science.1112521. [DOI] [PubMed] [Google Scholar]
- 15.Sato T, et al. Single Lgr5 stem cells build crypt-villus structures in vitro without a mesenchymal niche. Nature. 2009;459:262–265. doi: 10.1038/nature07935. doi:nature07935 [pii] 10.1038/nature07935 [doi] [DOI] [PubMed] [Google Scholar]
- 16.Ootani A, et al. Sustained in vitro intestinal epithelial culture within a Wnt-dependent stem cell niche. Nat Med. 2009;15:701–706. doi: 10.1038/nm.1951. doi:nm.1951 [pii] 10.1038/nm.1951 [doi] [DOI] [PMC free article] [PubMed] [Google Scholar]
- 17.Schuijers J, et al. Ascl2 Acts as an R-spondin/Wnt-Responsive Switch to Control Stemness in Intestinal Crypts. Cell Stem Cell. 2015;16:158–170. doi: 10.1016/j.stem.2014.12.006. doi:S1934-5909(14)00564-5 [pii] 10.1016/j.stem.2014.12.006 [doi] [DOI] [PubMed] [Google Scholar]
- 18.Hao HX, et al. ZNRF3 promotes Wnt receptor turnover in an R-spondin-sensitive manner. Nature. 2012;485:195–200. doi: 10.1038/nature11019. doi:nature11019 [pii] 10.1038/nature11019 [doi] [DOI] [PubMed] [Google Scholar]
- 19.van der Flier LG, Haegebarth A, Stange DE, van de Wetering M, Clevers H. OLFM4 Is a Robust Marker for Stem Cells in Human Intestine and Marks a Subset of Colorectal Cancer Cells. Gastroenterology. 2009 doi: 10.1053/j.gastro.2009.05.035. doi:S0016-5085(09)00800-2 [pii] 10.1053/j.gastro.2009.05.035 [doi] [DOI] [PubMed] [Google Scholar]
- 20.Tian H, et al. A reserve stem cell population in small intestine renders Lgr5-positive cells dispensable. Nature. 2011;478:255–259. doi: 10.1038/nature10408. doi:nature10408 [pii] 10.1038/nature10408 [doi] [DOI] [PMC free article] [PubMed] [Google Scholar]
- 21.Lopez-Garcia C, Klein AM, Simons BD, Winton DJ. Intestinal stem cell replacement follows a pattern of neutral drift. Science. 2010;330:822–825. doi: 10.1126/science.1196236. doi:science.1196236 [pii] 10.1126/science.1196236 [doi] [DOI] [PubMed] [Google Scholar]
- 22.Snippert HJ, et al. Intestinal crypt homeostasis results from neutral competition between symmetrically dividing Lgr5 stem cells. Cell. 2010;143:134–144. doi: 10.1016/j.cell.2010.09.016. doi:S0092-8674(10)01064-0 [pii] 10.1016/j.cell.2010.09.016 [doi] [DOI] [PubMed] [Google Scholar]
- 23.Peng WC, et al. Structure of stem cell growth factor R-spondin 1 in complex with the ectodomain of its receptor LGR5. Cell Rep. 2013;3:1885–1892. doi: 10.1016/j.celrep.2013.06.009. doi:S2211-1247(13)00287-8 [pii] 10.1016/j.celrep.2013.06.009 [doi] [DOI] [PubMed] [Google Scholar]
- 24.Zebisch M, et al. Structural and molecular basis of ZNRF3/RNF43 transmembrane ubiquitin ligase inhibition by the Wnt agonist R-spondin. Nature communications. 2013;4:2787. doi: 10.1038/ncomms3787. [DOI] [PMC free article] [PubMed] [Google Scholar]
- 25.Janda CYD,LT, You C, Chang J, de Lau W, Zhong ZA, Yan KS, Marecic O, Siepe D, Li X, Moody JD, Williams BO, Clevers H, Piehler J, Baker D, Kuo CJ, Garcia KC. Surrogate Wnt ligands that phenocopy canonical Wnt/β-catenin signaling. Nature. 2017;xxx:xxx. doi: 10.1038/nature22306. [DOI] [PMC free article] [PubMed] [Google Scholar]
- 26.Kabiri Z, et al. Stroma provides an intestinal stem cell niche in the absence of epithelial Wnts. Development. 2014;141:2206–2215. doi: 10.1242/dev.104976. doi:dev.104976 [pii] 10.1242/dev.104976 [doi] [DOI] [PubMed] [Google Scholar]
- 27.Hsieh JC, Rattner A, Smallwood PM, Nathans J. Biochemical characterization of Wnt-frizzled interactions using a soluble, biologically active vertebrate Wnt protein. Proc Natl Acad Sci U S A. 1999;96:3546–3551. doi: 10.1073/pnas.96.7.3546. [DOI] [PMC free article] [PubMed] [Google Scholar]
- 28.Koo BK, et al. Tumour suppressor RNF43 is a stem-cell E3 ligase that induces endocytosis of Wnt receptors. Nature. 2012;488:665–669. doi: 10.1038/nature11308. doi:nature11308 [pii] 10.1038/nature11308 [doi] [DOI] [PubMed] [Google Scholar]
- 29.Zheng GX, et al. Massively parallel digital transcriptional profiling of single cells. Nature communications. 2017;8:14049. doi: 10.1038/ncomms14049. [DOI] [PMC free article] [PubMed] [Google Scholar]
- 30.Macosko EZ, et al. Highly Parallel Genome-wide Expression Profiling of Individual Cells Using Nanoliter Droplets. Cell. 2015;161:1202–1214. doi: 10.1016/j.cell.2015.05.002. doi:S0092-8674(15)00549-8 [pii] 10.1016/j.cell.2015.05.002 [doi] [DOI] [PMC free article] [PubMed] [Google Scholar]
- 31.Grun D, et al. Single-cell messenger RNA sequencing reveals rare intestinal cell types. Nature. 2015;525:251–255. doi: 10.1038/nature14966. doi:nature14966 [pii] 10.1038/nature14966 [doi] [DOI] [PubMed] [Google Scholar]
- 32.Storm EE, et al. Targeting PTPRK-RSPO3 colon tumours promotes differentiation and loss of stem-cell function. Nature. 2016;529:97–100. doi: 10.1038/nature16466. doi:nature16466 [pii] 10.1038/nature16466 [doi] [DOI] [PubMed] [Google Scholar]
METHODS REFERENCES
- 33.Wei K, et al. A liver Hif-2alpha-Irs2 pathway sensitizes hepatic insulin signaling and is modulated by Vegf inhibition. Nat Med. 2013;19:1331–1337. doi: 10.1038/nm.3295. doi:nm.3295 [pii] 10.1038/nm.3295 [doi] [DOI] [PMC free article] [PubMed] [Google Scholar]
- 34.Levin TG, et al. Characterization of the intestinal cancer stem cell marker CD166 in the human and mouse gastrointestinal tract. Gastroenterology. 2010;139:2072–2082 e2075. doi: 10.1053/j.gastro.2010.08.053. doi:S0016-5085(10)01303-X [pii] 10.1053/j.gastro.2010.08.053 [doi] [DOI] [PMC free article] [PubMed] [Google Scholar]
- 35.Proffitt KD, et al. Pharmacological inhibition of the Wnt acyltransferase PORCN prevents growth of WNT-driven mammary cancer. Cancer research. 2013;73:502–507. doi: 10.1158/0008-5472.CAN-12-2258. [DOI] [PubMed] [Google Scholar]
- 36.Chao G, et al. Isolating and engineering human antibodies using yeast surface display. Nature protocols. 2006;1:755–768. doi: 10.1038/nprot.2006.94. [DOI] [PubMed] [Google Scholar]
- 37.Trapnell C, Pachter L, Salzberg SL. TopHat: discovering splice junctions with RNA-Seq. Bioinformatics. 2009;25:1105–1111. doi: 10.1093/bioinformatics/btp120. [DOI] [PMC free article] [PubMed] [Google Scholar]
- 38.Anders S, Pyl PT, Huber W. HTSeq–a Python framework to work with high-throughput sequencing data. Bioinformatics. 2015;31:166–169. doi: 10.1093/bioinformatics/btu638. [DOI] [PMC free article] [PubMed] [Google Scholar]
- 39.Love MI, Huber W, Anders S. Moderated estimation of fold change and dispersion for RNA-seq data with DESeq2. Genome biology. 2014;15:550. doi: 10.1186/s13059-014-0550-8. [DOI] [PMC free article] [PubMed] [Google Scholar]
- 40.Trapnell C, et al. Transcript assembly and quantification by RNA-Seq reveals unannotated transcripts and isoform switching during cell differentiation. Nature biotechnology. 2010;28:511–515. doi: 10.1038/nbt.1621. [DOI] [PMC free article] [PubMed] [Google Scholar]
- 41.Huang da W, Sherman BT, Lempicki RA. Systematic and integrative analysis of large gene lists using DAVID bioinformatics resources. Nature protocols. 2009;4:44–57. doi: 10.1038/nprot.2008.211. [DOI] [PubMed] [Google Scholar]
- 42.Yu D, Huber W, Vitek O. Shrinkage estimation of dispersion in Negative Binomial models for RNA-seq experiments with small sample size. Bioinformatics. 2013;29:1275–1282. doi: 10.1093/bioinformatics/btt143. doi:btt143 [pii] 10.1093/bioinformatics/btt143 [doi] [DOI] [PMC free article] [PubMed] [Google Scholar]
- 43.McCarthy DJ, Chen Y, Smyth GK. Differential expression analysis of multifactor RNA-Seq experiments with respect to biological variation. Nucleic acids research. 2012;40:4288–4297. doi: 10.1093/nar/gks042. [DOI] [PMC free article] [PubMed] [Google Scholar]
Associated Data
This section collects any data citations, data availability statements, or supplementary materials included in this article.
Supplementary Materials
Data Availability Statement
Data generated during this study are available in the Gene Expression Omnibus (GEO) repository (GSE92377 and GSE92865).


