

Abstract
Introduction.
Obesity is defined by the World Health Organization (WHO) as a disease characterized by the excessive accumulation of body fat. Obesity is considered a public health problem, leading to serious social, psychological and physical problems. However, the appropriate cut-off point of body mass index (BMI) based on body fat percentage (BF%) for classifying an individual as obese in middle-aged adults living in Rio de Janeiro remains unclear.
Materials and methods.
This was a prospective cross-sectional study comprising of 856 adults (413 men and 443 women) living in Rio de Janeiro, Brazil ranging from 30-59 years of age. The data were collected over a two year period (2010-2011), and all participants were underwent anthropometric evaluation. The gold standard was the percentage of body fat estimated by bioelectrical impedance analysis. The optimal sensitivity and specificity were attained by adjusting BMI cut-off values to predict obesity based on the WHO criteria: BF% >25% in men and >35% in women, according to the receiver operating characteristic curve (ROC) analysis adjusted for age and for the whole group.
Results.
The BMI cut-offs for predicting BF% were 29.9 kg/m2 in men and 24.9 kg/m2 in women.
Conclusions
The BMI that corresponded to a BF% previously defining obesity was similar to that of other Western populations for men but not for women. Furthermore, gender and age specific cut-off values are recommended in this population.
Significance for public health.
World Health Organization (WHO) defines obesity as a disease characterized by the excessive accumulation of body fat. Obesity is considered a public health problem, leading to serious social, psychological and physical problems. The WHO suggested cut-off point for obesity is a body mass index (BMI) of 30 kg/m2, which is associated with morbidity and mortality. An important issue in the debate over measuring obesity concerns the use of BMI to define obesity across different populations. However, it is not clear, what is an appropriate cut-off point of BMI based on body fat percentage (BF%) to classify an individual as obese within gender-age groups and to distinguish categories of BF% in middle-aged adults living in the city of Rio de Janeiro.
Key words: Obesity, receiver operating characteristic curve, body fat percentage, body mass index
Introduction
Obesity is defined by the World Health Organization (WHO) as a disease characterized by the excessive accumulation of body fat.1 It is considered a public health problem, leading to serious social, psychological and physical problems. This disease is associated with an increased risk of morbidity and mortality due to metabolic changes related to chronic diseases, such as dyslipidaemia,2 sleep apnea,3 type II diabetes mellitus,4 certain types of cancer,5 osteoarthritis,6 pulmonary diseases3 and hypertension.7
In the past several years, the prevalence of obesity has been increasing in several countries,1 including Brazil, where the prevalence of obesity in the adult population in the 27 cities covered by the VIGITEL system increased from 11.6% to 17.4% from 2006 to 2012, representing an average increase of 0.89% per year.8
In 1998, the WHO provided international body mass index (BMI) standards for classifying overweight and obesity in adults, based on the risk of obesity-related disease for Europeans at each BMI category.1 Values of body weight adjusted for height, referred to as BMI, indicated overweight for values exceeding 25 kg/m2 and obesity for values exceeding 30 kg/m2.1
While the WHO’s recommendation regarding BMI thresholds for defining obesity and overweight are well established, it is still necessary to define appropriate threshold levels of BMI based on body fat percentage (BF%) for classifying an individual as obese. In fact, investigators have asserted that obesity corresponds to a BF% greater than 25% for men and 35% for women, and these percentages relate to a BMI of 30 kg/m2 in young Caucasians.9 These adiposity thresholds have been associated with incident cardiovascular disease.10
In both clinical practice and population studies, BMI is often used for quantitative diagnosis of obesity due to its simplicity and high correlation to body fat content11 and body mass.12
However, an obvious limitation of this measure concerns to its inability to distinguish between fat and fat-free mass.13 Despite this limitation, the strong relationship between increased BMI and morbidity and mortality14,15 supports its application as a nutritional indicator in epidemiological studies, particularly in addition to other more specific measures of body fat.16 Notably, previous studies have shown that a single BMI value might represent a large range of BF%, due to the instrumentation as well as the ethnic and environmental characteristics of studied population.11
Given the relevance of the obesity problem, the application of a reliable tool for diagnosing obesity is germane to establishing subsequent public health policies and treatment protocols and to determining the correct prevalence of obesity, with the aim of minimizing the risk of morbidity in these individuals. Thus, the purpose of the present study was to determine the optimal cut-off points of BMI, based on gender- and age-specific BF%, in middle-aged adults living in Rio de Janeiro city, to predict obesity.
Materials and methods
Participants
The Ethics Committee of the Institution of the Estácio de Sá University approved the study protocol (n° 0045.0.308.000-10),17 and informed written consent was obtained from all participants. The study was conducted according to the principles of the Helsinki Declaration of 2008.
This was a prospective cross-sectional study, including convenience sampling, comprising 856 adults (413 men and 443 women), living in Rio de Janeiro, Brazil, with a range of 30-59 years of age. The data were collected over a two-year period (2010-2011). All participants were instructed to avoid strenuous activity for the 24 hours prior to each testing session and to avoid alcohol, caffeinated beverages, smoking and the consumption of large meals for at least three hours prior to testing. The exclusion criteria were a history of recent acute illness based on self-declaration, different chronic diseases, such as diabetes mellitus, hypertension, and osteomyoarticular injuries, use of orthopaedic prosthesis or cardiac pacemaker, use of any ergogenic supplements, and women who were either experiencing their period or pregnant.
Anthropometric measurements
The data collection and the anthropometric variables were performed by the same and experienced evaluator throughout the study. For measuring both body weight and height participants were kept barefoot, wearing light clothes and not carrying any object. The height was measured in centimeters and the body mass was measured in kilogram with certified and calibrated mechanics scale (Filizola, Brazil). BMI was calculated as the quocient ratio of weight oversquared height (kg/m2). All participants were assessed for nutritional status based on BMI cut-offs established by the WHO.1
Body composition measures
The measure of body fat percentage was estimated by bioelectrical impedance vector analysis using the BIA machine - 101A (RJL Systems, USA), standardized according to Khaled et al.18 To reduce the influence of intervening factors on measures of body resistance and reactance, the volunteers followed the recommendations of the NIH.19 The electrodes (Ag/AgCl) were applied on the hand and right leg for current injection and at the wrist and right ankle for current catchment, preceded by cleaning with alcohol and slight abrasion of the underlying skin. Measurements were performed with a single frequency of 50 kHz, which generated currents between 300 and 800 mA. The obesity BF% thresholds were defined as the WHO criteria: 35% and 25% for women and men, respectively.9
Statistics analysis
Descriptive statistics were expressed as the mean ± standard deviation, and post hoc power (1 - beta error level) sample analysis determined the effect size; these analyses were conducted in G*Power software version 3.1.9.2 (University Kiel, Germany). Lilliefors test confirmed the normality of the sample distribution. Age- and gender-specific percentile values of BMI that corresponded to the percentage of body fat categories were estimated, identifying equivalent percentiles and proportions of BMI distribution. This procedure returned approximately the same prevalence estimates as the percentage body fat categories. ROC curves were generated to identify the optimal cut-off values of BMI according to age categories and for the whole group, with better sensitivity and specificity corresponding to a particular threshold in men and women. All procedures assumed P<0.05 for statistical significance and were performed in SPSS software version 18.0 (SPSS, USA).
Results
Anthropometric and physical characteristics of the participants are presented in Table 1. Low standard deviation values confirmed the homogeneity of the sample. The actual power (1 - beta error level) was estimated as 0.99.
Table 1.
Descriptive characteristics of participants.*
| Variables | Men (n=413) | Women (n=443) |
|---|---|---|
| Age, year | 32.8±13.1 | 35.7±14.4 |
| Height, cm | 175.0±7.2 | 162.7±6.8 |
| Weight, kg | 78.8±15.1 | 63.7±11.1 |
| BMI, kg/m2 | 26.2±4.7 | 23.5±3.7 |
| BF% | 18.9±6.7 | 28.1±8.1 |
BMI, body mass index; BF%, body fat percentage. *Values are mean ± standard deviation (SD).
The areas under the BMI ROC curves to predict values of BF% for obesity in men and women are illustrated in Figure 1. The AUCs to predict values of BF% for obesity reached 0.99 (0.97 to 1.00 with 95%CI) in men (Figure 1A), which corresponded to a cut-off value of 29.9 kg/m2 (100% sensitivity and 99.4% specificity). In women (Figure 1B), the AUC obtained was 0.80 (0.74 to 0.85 with 95%CI), which corresponded to a cut-off value of 24.9 kg/m2 (66.7% sensitivity and 89.8% specificity) (P<0.05).
Figure 1.
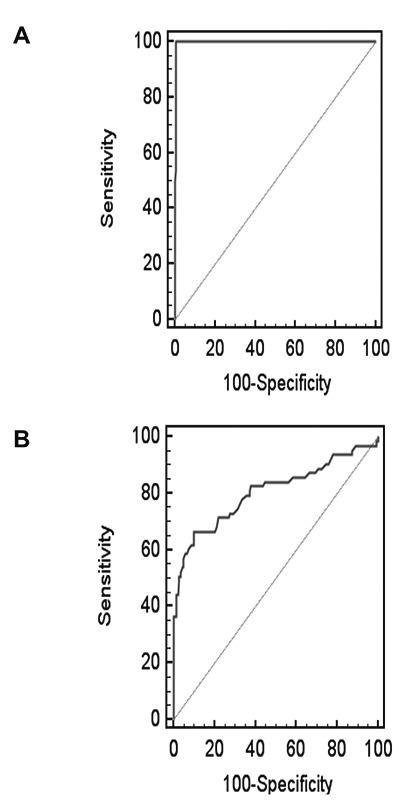
ROC curves showing the performance of body mass index in predicting body fat % in men (A) and women (B).
Table 2 summarizes the estimated age- and gender-specific percentile values of 50%, 75% and 85% of BMI and the corresponding percentage of body fat categories.
Considering that BMI distinguishes categories of BF% based on different ranges of percentile within gender- and age-specific groups, cut-off values of BMI that predicted BF% indicating obesity were also identified, using the ROC analysis in both genders according to age group (Table 3).
Discussion
The increasing prevalence of obesity worldwide is a serious health problem that confers an increased risk of morbidity and mortality due to the metabolic changes related to chronic diseases.2-7 The association between BMI and obesity allows the construction of a simple nutritional marker in epidemiological studies.14,15 In Brazil, the lack of a dwelling regional population-based cut-off value of BMI to predict excess body fat and, consequently, morbidity related to this excess imposed the need to use imported thresholds. Therefore, the purpose of the present study was to address this gap and thereby identify cut-off points for BMI to predict values of obesity based on BF% in men and women in a domestic population.
The analysis of BF% using BIA was chosen due to the simplicity of outputs, the high inter- and intra-measurer reliability, and the minimal discomfort during the evaluation, as well as the convenience of operating in the field or in the laboratory.20 The BF% values show significant correlation (r=0.73 to 0.94) with the DEXA gold standard.21,22
An important issue in the debate over measuring obesity concerns the use of BMI to define overweight and obesity across populations. There are a number of recent studies showing that the relationship between BMI and BF% differs among ethnic groups; for example, studies with Chinese,23 Indian,24 North American,24,25 Japanese,26 Thai,24 British,24 Indonesian,24 Polish,24 Spanish,27 Tongan,28 Australian,29 Nigerian25 and Jamaican25 populations have demonstrated that a single BMI value represents different values of fat percentage due to the influences of the population’s ethnic and environmental characteristics.11 In addition, the combination of these cut-offs associated with disease may vary between populations.29
BMI is a measure of body weight based on a person’s weight and height.1 Though it does not actually measure the percentage of body fat, it is used to estimate a person’s healthy body weight, assuming an average body composition.11 The suggested cut-off point for obesity (BMI≥30 kg/m2) is based on observational studies in Europe and the USA that assessed the relationship of morbidity and mortality with BMI.1 However, a universal BMI cut-off point for obesity is not appropriate as a criterion for diagnosing obesity and can result in lower sensitivity in the diagnosis of disease and associated co-morbidities.30 This has immense public health implications regarding the definitions of BMI cut-off points for obesity, which need to be population-specific.31,32
Regarding Asian populations, much debate has surrounded the appropriateness of using cut-off points from Western contries.33 The International Obesity Task Force has proposed lower cut-off points for obesity (BMI≥25 kg/m2) in Asian and Pacific Island populations to promote healthy lifestyles and weight control.34 The body composition profile in Asian populations differs from that of Caucasian populations, and these variations have already been associated with body fat percentages below that found at the cutoff point of 25 kg/m2, i.e., the overweight threshold defined in the current WHO classification.33,35 Previous studies26,27 investigated optimal cut-off points in different Western populations. In Spanish,27 for instance, the optimal cut-off values for predicting BF% were found to be 27.5 kg/m2 for men and 27.4 kg/m2 for women. Those values were associated, respectively, with >25% and >35% body fat. The BMI cut-off for predicting BF% in American Caucasian and European Caucasian populations26 was 30 kg/m2 in both genders and was 28.2 kg/m2 for Australian Caucasian men.29 The present study demonstrated similar cut-off values for men, at 29.9 kg/m2, and lower cut-off values for women, at 24.9 kg/m2; these values corresponded to 25% and 35% BF%, respectively. The differences found in the body fat/BMI relationship in different ethnic groups could be due to differences in energy balance as well as to differences in body build.13 Differences in relative leg length could be partly responsible for the differences in BMI and, consequently, in the differences in the relationship between BF% and BMI;35,36 race/ethnic-specific BMI cut-off values would more accurately identify obesity.37
Conclusions
In the present study, the optimal BMI cut-off values corresponding to obesity, as defined by BF%, showed important differences with respect to gender and age. Therefore, BMI is an inaccurate measure of body fat percentage for an individual. However, BMI corresponds fairly well to overall body fat percentage within gender-age groups and distinguishes between categories of body fat percentage. Future research should address the limitations of the present study by employing a sample from different regions of the country and by investigating the associations between these optimal cut-off values and cardiovascular risk factors. Besides, the present study did not consider the result the degree of concordance between two tests in the absence of a real gold standard.
In conclusion, considering obesity is defined as an excess of body fat and not as an excess of weight, the BMI cut-off value for obesity in men is 29.9 kg/m2, similar to other Western populations. However, in women, this value is 24.9 kg/m2 instead of 30 kg/m2, indicating that specific anthropometric standards according to gender may prevail in this population.
Table 2.
The estimated age- and sex-specific percentile values of 50%, 75% and 85% of body mass index that correspond to the different fat percentage categories
| Percentile | Men | Women | ||
|---|---|---|---|---|
| BMI | BF% | BMI | BF% | |
| 30-39 years | ||||
| 50% | 25 | 12.3 | 22 | 23 |
| 75% | 27 | 18.6 | 23.6 | 26.4 |
| 85% | 29.5 | 22.5 | 24.5 | 29.8 |
| 49 years | ||||
| 50% | 25.5 | 18 | 23.3 | 27.3 |
| 75% | 28.5 | 21 | 25.3 | 31.4 |
| 85% | 29 | 23.6 | 27.4 | 34 |
| 59 years | ||||
| 50% | 26 | 21 | 24 | 35.4 |
| 75% | 28 | 24 | 27.3 | 41.2 |
| 85% | 30.2 | 24.9 | 28.8 | 42.7 |
BMI, body mass index and BF%, body fat percentage.
Table 3.
The optimal cut-off values, sensitivities and specificities for body mass index predictive of obesity as defined by BF% in men and women according to age group.
| Age (year) | Men (n=145, 138 and 130, respectively) | Women (n=120, 110 and 99, respectively) | ||||
|---|---|---|---|---|---|---|
| Cut-off | Sensitivity | Specificity | Cut-off | Sensitivity | Specificity | |
| 30-39 | 27.9 | 60.0 | 97.5 | 25.4 | 93.3 | 60.8 |
| 40-49 | 30.0 | 80.0 | 91.5 | 24.7 | 100.0 | 76.9 |
| 50-58 | 27.7 | 75.6 | 77.5 | 26.4 | 53.0 | 96.5 |
Sensitivities and specificities are expressed in %, and cut-off values are expressed in kg/m2.
References
- 1.World Health Organization. Obesity: preventing and managing the global epidemic. World Health Organization: Geneva 1998; 276. [PubMed] [Google Scholar]
- 2.Mangge H, Almer G, Truschnig-Wilders M, et al. Inflamation, adiponectin, obesity and cardiovascular risk. Curr Med Chem 2010;17:4511-20. [DOI] [PubMed] [Google Scholar]
- 3.Dzieciolowska-Baran E, Gawlikowska-Sroka A, Poziomkowaska-Gesicka Teul-Swiniarska I, Sroczynski T. Influence of body mass index on treatment of breathing-related sleep disorders. Eur J Med Res 2010;4:36-40. [DOI] [PMC free article] [PubMed] [Google Scholar]
- 4.Joost H. Pathogenesis, risk assessment and prevention of type 2 diabetes mellitus. Obes Facts 2008;1:128-137. [DOI] [PMC free article] [PubMed] [Google Scholar]
- 5.Dickerman BA, Ahearn TU, Giavannucci E, et al. Weight change, obesity, and risk of prostate cancer progression among men with clinically localized prostate cancer. Int J Cancer 2017;141:933-44. [DOI] [PMC free article] [PubMed] [Google Scholar]
- 6.Aspden RM. Obesity punches above its weight in osteoarthritis. Nat Rev Rheumatol 2011;7:65-8. [DOI] [PubMed] [Google Scholar]
- 7.Kshatriya S, Liu K, Salah A, et al. Obesity hypertension: the regulatory role of leptin. Int J Hypertens 2011;3:1-8. [DOI] [PMC free article] [PubMed] [Google Scholar]
- 8.Brasil. Ministério da Saúde. Secretaria de Vigilância em Saúde. VIGITEL. Brasil 2012: Vigilância de fatores de risco e proteçâo para doenças crônicas por inquérito telefônico. Brasilia: Ministério da Saúde, 2013. [Google Scholar]
- 9.World Health Organization. Physical status: the use and interpretation of anthropometry. Technical report series 854. Geneva: World Health Organization; 1995. [PubMed] [Google Scholar]
- 10.Britton KA, Massaro JM, Murabito JM, et al. Body fat distribution, incident cardiovascular disease, cancer, and all-cause mortality. J Am Coll Cardiol 2013;62:921-5. [DOI] [PMC free article] [PubMed] [Google Scholar]
- 11.Deurenberg P, Weststrate JA, Seidell JC. Body mass index as a measure of body fatness: age- and sex-specific prediction formulas. Br J Nutr 1999;65:105-14. [DOI] [PubMed] [Google Scholar]
- 12.Garn SM, Leonard WR, Hawthorne VM. Three limitations of the body mass index. Am J Clin Nutr 1986;44:996-7. [DOI] [PubMed] [Google Scholar]
- 13.Deurenberg P, Deurenberg Yap M, Wang J, et al. The impact of body build on the relationship between body mass index and percent body fat. Int J Obes Relat Metab Disord 1999;23:537-42. [DOI] [PubMed] [Google Scholar]
- 14.Ashton WD, Nanchahal K, Wood DA. Body mass index and metabolic risks factors for coronary heart disease in women. Eur Heart J 2001;22:46-55. [DOI] [PubMed] [Google Scholar]
- 15.Gu D, He J, Duan X, et al. Body weight and mortality among men and women in China. JAMA 2006;295:776-83. [DOI] [PubMed] [Google Scholar]
- 16.Perichart-Perera O, Balas-Nakash M, Schiffman-Selechnik E, Barbato-Dosal A, Vadilo-Ortega F. Obesity increases metabolic syndrome risk factors in school-aged children from an urban school in Mexico City. J Am Die Assoc 2007;107:81-91. [DOI] [PubMed] [Google Scholar]
- 17.Materko W, Santos EL. Predição e validação da gordura relativa baseada nas características antropométricas. Arquivos em Movimento (UFRJ Online) 2010;6:91-106. [Google Scholar]
- 18.Khaled MA, McCutcheon MJ, Reddy S, et al. Electrial impedance in assessing human body composition: the BIA method. Am J Clin Nutr 1988;47:789-92. [DOI] [PubMed] [Google Scholar]
- 19.NIH/USA. Bioeletric impedance analysis in body composition measurement. National Institute of Health Tecnology Assesment Statement. 12-14 december,. 1994, pp 1-35. [Google Scholar]
- 20.Valentinuzzi ME. Bioelectrical impedance techniques in medicine: monitoring of physiological events by impedance. Crit Rev Biomed Eng 1996;24:353-466. [PubMed] [Google Scholar]
- 21.Newton RL, Alfonso A, White MA, et al. Percent body fat measured by BIA and DEXA in obese, African-American adolescent girls. Int J Obes 2005;29:594-602. [DOI] [PubMed] [Google Scholar]
- 22.Bowden RG, Lanning BA, Doyle EI, et al. Comparison of body composition measures to dual-energy x-ray absorptiometry. J Exerc Physiol Online 2005;8:1-9. [Google Scholar]
- 23.Chen YM, Ho SC, Lam SS, Chan SS. Validity of body mass index and waist circumference in the classification of obesity as compared to percent body fat in Chinese middle-aged women. Int J Obes (Lond) 2006;30:918-25. [DOI] [PubMed] [Google Scholar]
- 24.Gallagher D, Heymsfield SB, Heo M, et al. Healthy percentage body fat ranges: an approach for developing guidelines based on body mass index. Am J Cli Nutr 2000;72:694-701. [DOI] [PubMed] [Google Scholar]
- 25.Luke A, Durazo-Arvizzu R, Rotimi C, et al. Relation between BMI and body fat in black population samples from Nigeria, Jamaica and the United States. Am J Epidemiol 2000;145:620-8. [DOI] [PubMed] [Google Scholar]
- 26.Kagawa M, Uenishi K, Kuroiwa C, et al. Is the BMI cut-off level for Japanese females for obesity set too high? A consideration from a body composition perspective. Asia Pac J Clin Nutr 2006;15:502-7. [PubMed] [Google Scholar]
- 27.Fernandez-Real JM, Vayreda M, Casamitjana R, et al. [Body mass index (BMI) and percent fat mass. A BMI>27.5 kg/m2 could be indicative of obesity in the Spanish population] Med Clin (Barc) 2001;117:681-4. [Article in Spanish]. [PubMed] [Google Scholar]
- 28.Craig P, Colagiuri S, Hussain Z, Palu T. Identifying cut-points in anthropometric indexes for predicting previously undiagnosed diabetes and cardiovascular risk factors in the Tongan population. Obes Res Clin Pract 2007;1:17-25. [DOI] [PubMed] [Google Scholar]
- 29.Piers LS, Rowley KG, Soares MJ, O’Dea K. Relation of adiposity and body fat distribution to body mass index in Australians of Aboriginal and European ancestry. Eur J Clin Nutr 2003;57:956-63. [DOI] [PubMed] [Google Scholar]
- 30.Deurenberg P, Yap M, Van Staveren WA. Body mass index and percent body fat: a meta analysis among different ethnic groups. Int J Obes 1998;22:1164-71. [DOI] [PubMed] [Google Scholar]
- 31.James WPT, Chen C, Inoue S. Appropriate Asian body mass indices? Obesity Rev 2002;3:3-139. [DOI] [PubMed] [Google Scholar]
- 32.Razak F, Anand SS, Shannon H, et al. Defining obesity cut points in a multiethnic population. Circulation 2007;115:2111-8. [DOI] [PubMed] [Google Scholar]
- 33.Deurenberg-Yap M, Schimidt G, van Staveren WA, Deurenberg P. The paradox of low body mass index and high body fat percentage among Chinese, Malays and Indians in Singapore. Int J Obes Relat Metab Disord 2000;24:1011-7. [DOI] [PubMed] [Google Scholar]
- 34.International Obesity Task Force (on behalf of the Steering Committee). The Asia-Pacif perspective: redefining obesity and its treatment. Western Pacif Region Sydney, Australia: Heath Communications Australia Pty Limited; 2002. [Google Scholar]
- 35.Kagawa M, Kerr D, Uchida H, Binns CW. Differences in the relationship between BMI and percentage body fat between Japanese and Australian-Caucasian young men. Br J Nutr 2006;95:1002-7.16611393 [Google Scholar]
- 36.Norgan NG. Population differences in body composition in relation to body mass index. Eur J Clin Nutr 1994;48:S10-27. [PubMed] [Google Scholar]
- 37.Rahman M, Berenson AB. Accuracy of current body mass index obesity for white, black and Hispanic reproductive-age women. Obstet Gynecol 2010;115:982-8. [DOI] [PMC free article] [PubMed] [Google Scholar]