Summary
Using interferometry based biosensors the binding and release of eNOS and nNOS from calmodulin (CaM) was measured. In both isoforms, binding to CaM is diffusion limited and within about three orders of magnitude of the Smoluchowski limit imposed by orientation independent collisions. This suggests that the orientation of CaM is facilitated by the charge arrays on the CaM binding site and the complementary surface on CaM. Protein kinase C (PKC) phosphorylation of eNOS T495, adjacent to the CaM binding site, abolishes or greatly slows CaM binding. Kinases which increase the activity of eNOS did not stimulate the binding of CaM, which is already diffusion limited. The coupling of Ca+2 binding and CaM/NOS binding equilibria links the affinity of CaM for NOS to the Ca+2 dependence of CaM binding. Hence, changes in the Ca+2 sensitivity of CaM binding always imply changes in the NOS-CaM affinity. It is possible, however, that in some regimes binding and activation are not synonymous, so that Ca+2 sensitivity need not be tightly linked to CaM sensitivity of activation. This work will be extended using mutants to probe the roles of individual structural elements in binding and release.
Keywords: nitric oxide synthase, calmodulin, kinase, optical biosensing, protein kinase C
Introduction
Mammalian endothelial and neuronal nitric oxide synthases (eNOS and nNOS) are homologous signal generating enzymes which function in a wide variety of physiological applications including angiogenesis, control of vascular tone, control of insulin secretion (eNOS) and signaling at synapses and in skeletal muscle (nNOS) (1–6). Primary control of NO production is through regulation of the supply of NADPH-derived reducing equivalents to the active site by calmodulin binding at a well-defined canonical site (1, 7, 8). Important secondary regulatory mechanisms include the covalent modification of target residues by specific kinases (9–13). These modifications often occur within regulatory elements involved in CaM control (14–16).
The calcium biosensor calmodulin is the best known of a group of EF hand proteins that regulate (and usually activate) specific targets in response to the binding of Ca2+ (17–21). The eNOS and nNOS isoforms are two of many established CaM targets (22). In the classical binding mode of CaM, which appears to be followed by NOS, the central helix breaks, allowing the dumbbell shaped Ca+2 replete CaM to wrap around the helical target peptide. In NOS, the target is part of the linker joining the oxygenase and reductase regions. It contains basic and aromatic residues, and a specific 17 residue motif.
CaM binding and CaM activation of NOS isoforms have been widely studied since the discovery by Nathan and coworkers of CaM as a ‘subunit’ of the inducible isoform iNOS, to which it is for all practical purposes irreversibly bound (23). Bredt and Snyder described canonical CaM binding sequences in all three mammalian isoforms (8), and Ca2+-dependent activation of eNOS and nNOS by CaM is well established (e.g., (24, 25)).
The profile of Ca2+ dependence has been studied by a number of laboratories. The work of Persechini et al (26) established details of the Ca2+ dependence of activation, and numerous groups have carried out studies using model peptides and mutant enzymes (27) (10, 28–30). Kds for binding of CaM to constitutive NOS holoenzymes and their CaM binding peptides have generally been reported to be in the 1–10 nM range. Reports of higher ‘EC50’ values for CaM activation of NOS result from activation experiments that were generally done at concentrations above the true Kd. The high EC50 values are handy measures of the amount of CaM required to activate NOS in standard experiments, but represent stoichiometric titrations and correspond to half the concentration of CaM binding sites in a particular preparation.
The interaction of CaM-based and phosphorylation-based NOS controls is incompletely understood. Phosphorylation of some sites, including those within autoinhibitory elements (e.g., S635 and S1179), activates eNOS, while phosphorylation of others (T497) inhibits (10, 13). Work with the phosphomimetic mutant T497D indicates that negative charge introduced immediately prior to the CaM binding site interferes with CaM binding (31). Kinases including protein kinase A (PKA), PKC, and Akt have been shown to phosphorylate eNOS as part of a complex control network (32). Here we show that detailed studies can be carried out at low concentrations of CaM and enzyme, enabling the measurement of thermodynamic and kinetic parameters.
Results
Binding of CaM to eNOS and nNOS
Association of eNOS and CaM was investigated using biolayer interferometry (BLI) as described in Materials & Methods. BLI is an optical biosensting technique that yields similar data but operates on a different physical principle than surface plasmon resonance (SPR). Like SPR, BLI measures changes near a surface that reflect association and dissociation of biomolecules (33). Fiber optic sensors with an immobilized ligand are dipped into analyte-containing buffer to monitor association and then moved to analyte-free buffer to monitor dissociation. Instrument response is monitored over time and reported as the shift in nm of an interference pattern. Rate and affinity constants are determined by fits to kinetic models. Initial experiments used CaM as the immobilized ligand and eNOS or nNOS as the analyte. Binding of eNOS and nNOS to CaM produced strong signals corresponding to maximum shifts of 3 to 7 nm (and depends in part on the amount of ligand bound to the sensor tip). These signals provided a means of probing the formation of CaM-NOS complexes.
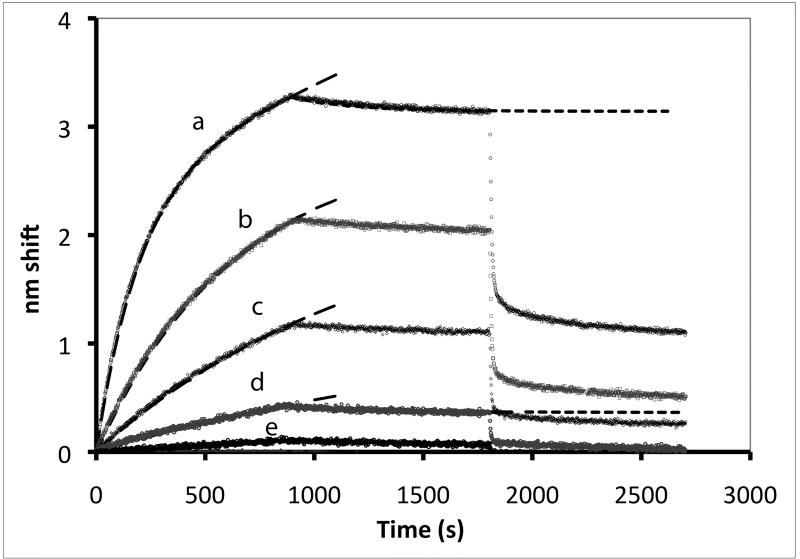
Figure 1A shows sensorgram traces produced by eNOS binding to immobilized CaM at eNOS concentrations ranging from 10 nM to 120 pM in 5 µM Ca2+. The majority of the signal can be fit with a single exponential. At the two highest concentrations a significant secondary event is observed at longer times; the top trace has been fit with two components, and a single exponential fit would only account for about 85% of the observed signal. At about 900 sec in each trace, release of eNOS after transfer of the tip to a buffer containing Ca2+ but not eNOS can be observed. At about 1800 sec, sensors were transferred into an EDTA solution, sequestering Ca+2 and producing rapid dissociation of most of the eNOS. These features are addressed below. Transfer to EGTA resulted in dissociation indistinguishable from EDTA (see supplemental figure 1). The experimental traces (Figs. 1A, 2B, 3 and 6) are not lines, but are composed of thousands of individual data points.
Figure 1. Binding of eNOS holoenzyme (analyte) to calmodulin tethered to sensor tips.
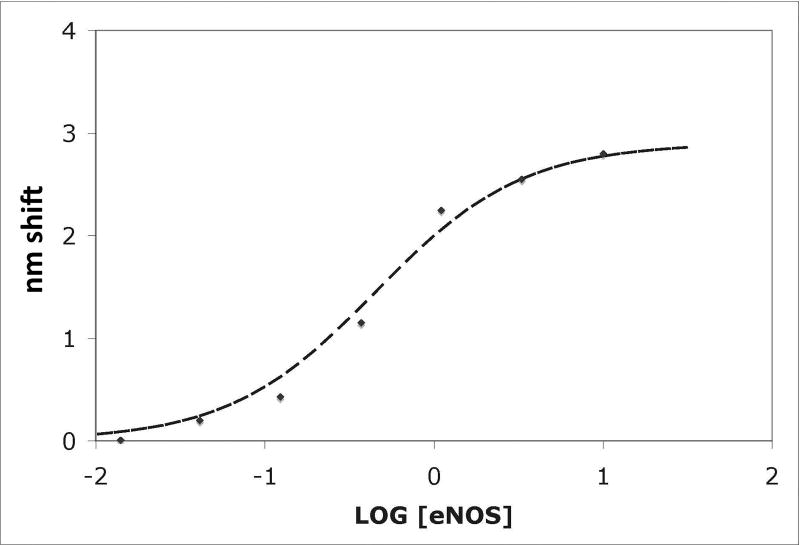
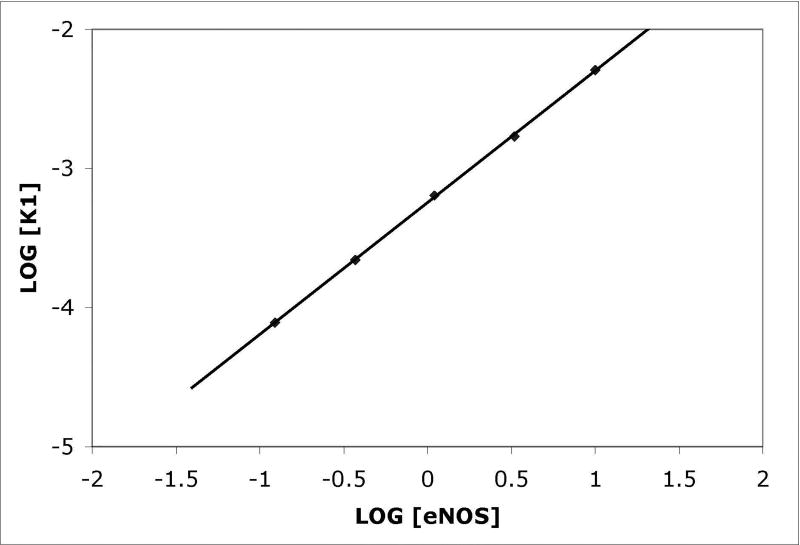
(A) NOS concentrations (top to bottom) were a:10 nM, b: 3.33 nM, c: 1.11 nM, d: 0.37 nM, and e: 0.123 nM; concentrations down to 0.005 nM were also examined. Binding was initiated by immersion of tips into solutions of eNOS at the concentrations listed; after 15 minutes, the tips were transferred into buffer containing calcium but no eNOS, and after 15 minutes of slow dissociation the tips were transferred into a solution of EDTA. A two exponential fit for binding is shown for the top trace, single exponential fits to early data for the others. For the physiologically relevant rapid phase, amplitudes were 2.8, 2.55, 2.25, and 1.15 and rate constants (kobs in sec−1) were 0.0051, 0.00185, 0.00084 and 0.00052. The rapid components account for most of the observed changes. The slow component in the top trace has an amplitude of 60 and rate of 0.00015 sec−1 when fit as an exponential; because the slow components are very slow, they can be fit as a line or as the slow conversion of the initial bound state into modified tightly bound states (see text). (B) Titration of signal intensity with eNOS showing rapid component amplitude vs [eNOS]. Sigmoidal titration simulation is shown with an apparent Kd of 0.65 nM. Plot of forward rate constant calculated from global fit of kobs vs. [eNOS] showing first order behavior with respect to eNOS. (D) Kinetics scheme showing steps for binding, dissociation and modification of components. Rate constants are: k1, forward rate constant for binding in Ca+2 buffer; k2, dissociation rate constant for binding in Ca+2 buffer k3, forward rate constant for conversion to slow release conformational state; k4, reverse rate constant conformational change; k5 and k6, forward and reverse rate constants for dissociation of the slow state in Ca+2 buffer (negligible), k7 and k8, forward and reverse rate constants for dissociation of the initial state in EDTA buffer; k9 and k10, forward and reverse rate constants for dissociation of the slow state in EDTA buffer.
Figure 2. Competition and ligand-analyte reversal experiments.
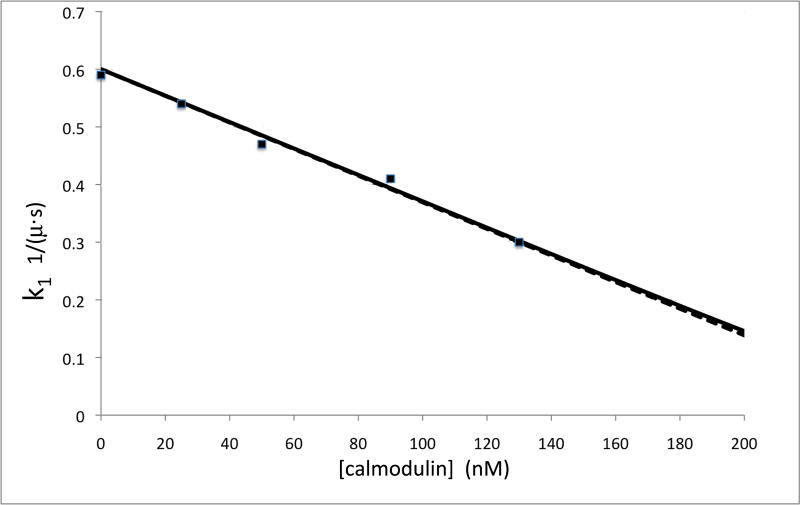
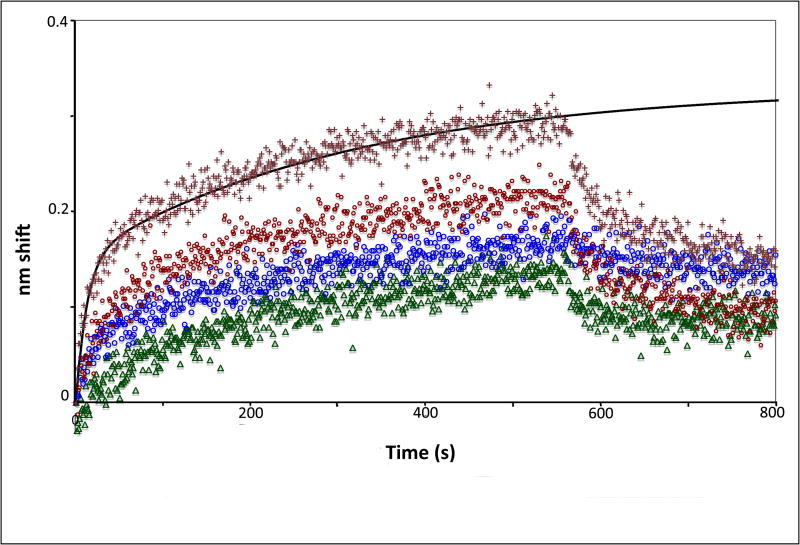
(A) Competition experiment in which free CaM was added to eNOS before binding to determine the concentration of CaM binding sites. Plot shows k1 vs. [calmodulin]. (B) Sensorgrams of binding of analyte calmodulin to ligand eNOS holoenzyme. CaM concentrations top to bottom were 40 nM (crosses), 30 nM (red circles), 20 nM (blue circles), and 10 nM (green triangles).
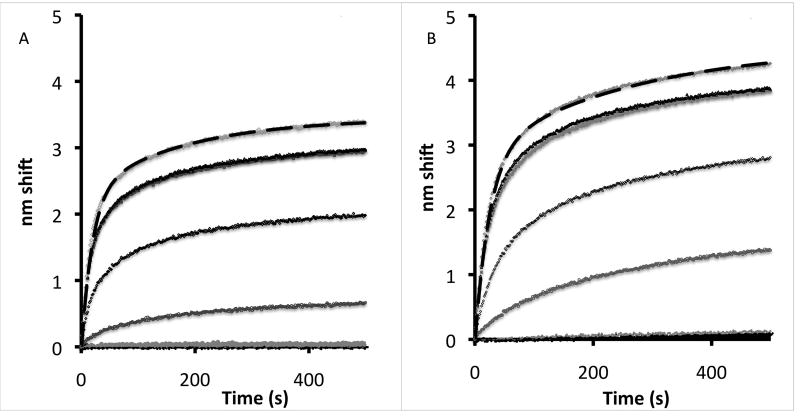
Figure 3. Ca2+ titrations for nNOS and eNOS.
Largest amplitude trace in both experiments corresponds to 10 µM and Ca2+ concentrations in order were 10, 3, 1, 0.3. 0.1, 0.03 and 0.01 µM; the 3 and 1 µM traces are almost superimposed. (A) Titration of 100 nM nNOS dimers with buffered calcium in the 10 nM-10 µM regime. Rates of rapid and slow components in double exponential fit were 0.05 and 0.005 M−1 sec−1 (time constants 20 and 200 sec). (B) Titration of 100 nM eNOS dimers with buffered calcium in the 10 nM-10 µM regime. Rates of rapid and slow components in two component first order kinetic simulation were 0.05 and 0.005 M−1 sec−1 (time constants 20 and 200 sec).
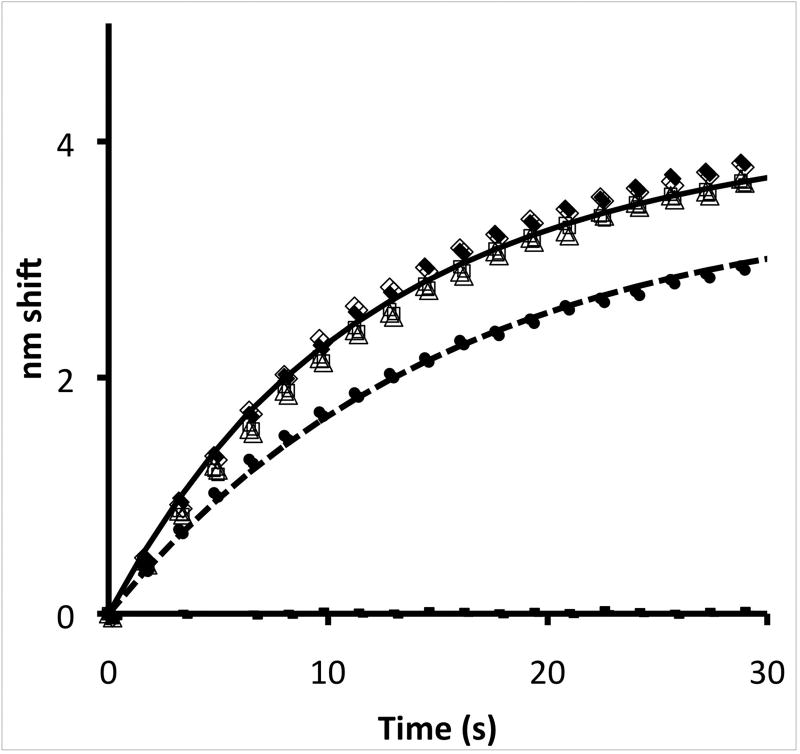
Figure 6. Effect of phosphorylation of eNOS residues on binding of CaM.
eNOS was phosphorylated by AKT (open diamonds) and PKC (filled circles); control experiments with no ATP are shown as filled diamonds (incubation with PKC) and open triangles (incubation with AKT). Two component fits are shown as solid or dashed lines. No significant effect was observed except with PKC, which phosphorylates T495 adjacent to the CaM binding site. In the experiment shown it is estimated that the 30% decrease in rate of CaM binding is caused by ~30% phosphorylation at the T495 site; no indication of binding of a slower component could be observed.
The amplitude of the exponential can be fit to an equilibrium expression. For each eNOS concentration, it is proportional to [eNOS]/(Kd+[eNOS]), where Kd=k2/k1. Here Kd is the dissociation constant for eNOS from CaM and k1 and k2 are the forward and reverse rate constants for the initial binding reactions. Figure 1B shows a plot of the amplitude of the rapid component (in nm shift) vs. log10[eNOS], fit with Kd=500 pM. At each concentration, the forward rate is equal to the product of the apparent rate and the amplitude of the exponential divided by the maximum amplitude at high [eNOS], assuming the forward reaction is first order in eNOS. The forward and reverse rates can then be calculated at each eNOS concentration; the reverse rate obtained from this calculation and kobs for the initial binding component is about 0.001 sec−1, first order in the immobilized CaM-NOS complex and zero order in free eNOS. Fitting the data with numerical simulations including mixed reversible reactions did not improve the simulation or appreciably alter the results; simulations with various schemes produced fits with values differing by less than a factor of 2, which is in good agreement because of the presence of multiple components.
Binding of eNOS to CaM occurs at a forward rate proportional to eNOS concentration as shown in figure 1C. The pseudo first order rate constant (with respect to immobilized CaM) for the initial component at 10 nM eNOS is 0.005 sec−1; eNOS is many orders of magnitude in excess over CaM so that free eNOS is not measurably depleted during the reaction. This corresponds to a second order rate constant of ~0.5×10⁶ M−1 sec−1. Very similar results were obtained for nNOS (data not shown, but compare figures 3A and B).
The slow phase of the binding has several potential causes, including the presence of bound CaM with hindered access and conversion of bound NOS to a secondary species at a rate much slower than NOS binding. These alternatives are explored later in this paper. To facilitate discussion of the results, figure 1D presents a scheme in which initial binding and release take place with rate constants k1 and k2. k1 is a second order rate constant, but because the analyte species is in great excess over the immobilized ligand it is conveniently represented as a pseudo-first order rate constant proportional to the concentration (formally the activity) of analyte. Conversion to the secondary species (“NOS-CaM*”) occurs with forward and reverse rate constants k3 and k4. Dissociation of the primary and secondary species in EDTA occurs with rate constants k8 and k10. K5k6,k7 and k9 are rate constants incuded for completeness of the model, but represent very slow events. Other reactions in the scheme are very slow; no binding could be observed in the presence of EDTA.
Release of eNOS into Ca2+ containing buffer is incomplete. It can be fit to a double exponential dominated by a component with a first order rate constant of 0.001 sec−1, with a smaller contribution from a much slower phase, here with a rate constant of 10−6 sec−1. The rate constant for the faster phase of dissociation into Ca+2 buffer in the absence of analyte is in good agreement with the reverse rate constant calculated from the association phase. The incomplete dissociation observed does not represent attainment of equilibrium for a simple binding/dissociation reaction, because the rebinding reaction would have to be much faster than the measured binding rate to account for the observed results. Simply put, the very small amount of analyte released in the dissociation phase could never produce a binding reaction fast enough to stop net dissociation until the complex was nearly fully dissociated. The major phase of release into an EDTA solution occurs with a rate constant of 0.11 sec−1.
Supplemental figure 2 demonstrates that non-specific binding of NOS to the surface of the biosensor produces a very small report. At relatively high concentrations of eNOS or nNOS (e.g., as shown here 3.3 nM), the binding report to the undecorated surface is 5-10% of the signal obtained with CaM decorated sensors. The nonspecific signal was not affected by EDTA, and inclusion of a component of this magnitude would not significantly affect the rate or equilibrium constants reported here. Because the sensor surface is already covered by CaM and quickly becomes further obscured by NOS binding to CaM, it is likely that much lower levels of NOS are non-specifically bound during these experiments. For this reason we do not attempt to correct for nonspecific binding by subtraction. At low levels of NOS binding is reversible by EDTA, and hence cannot include a significant non-specific component.
Figure 2A shows the result of a competition experiment in which 250 nM eNOS (as estimated by heme content) was titrated with free CaM in solution. After equilibration, binding to CaM immobilized on a tip was carried out under the conditions of Figure 1. Since the concentrations of CaM and eNOS are much higher than Kd values estimated from the data of figure 1, CaM binding should be approximately stoichiometric, removing eNOS from the pool capable of binding. The first order behavior of k1 for the binding reaction in figure 1 implies that the observed binding rate (kobs=k1+k2) should be proportional to ([eNOS]-[CaM])/[eNOS]. The dotted line shows the results for stoichiometric binding, and the almost identical solid line shows a simulation for a Kd of 0.645 nM. In both these fits, the concentration of functional CaM binding sites was 260 nM, indicating that there is about 1 functional CaM binding site per heme in quality NOS preparations.
Figure 2b demonstrates reversibility of ligand and analyte with CaM as the analyte and eNOS immobilized on the sensor. Binding of free CaM to eNOS is about 2.3 times faster than free eNOS from the same preparation to CaM because of the difference in the molecular weights; the dimer molecular weight of eNOS is about 262 kDa, while the molecular weight of CaM is 16.9 kDa. The radii of equivalent spheres would have a ratio of 2.5, accounting for the diffusion difference with a small correction for molecular geometry. Reversibility effectively removes the possibility that the experimental results are significantly affected by the attachment of CaM to sensors since attaching NOS produces equivalent results.
Dissociation kinetics and Ca+2 dependence
Calcium dependence of nNOS and eNOS binding to immobilized CaM is shown in Figures 3A and 3B, respectively. Ca2+ concentrations ranged between 10−8 M and 10−5 M. Higher Ca2+ concentrations had no significant effect on the rate of association. The binding traces in figure 3 have been fit to two component exponentials consistent with first order kinetics in CaM and pseudo zero order kinetics in eNOS. The results for nNOS are very similar, the major difference being that the slow phase is less significant.
At a descriptive level, the experimental results are simple. The apparent on rate (kobs) increases rapidly with calcium, with half the maximal rate attained at 300 nM. Dissociation of NOS-CaM complexes was observed after transferring the sensors to a calcium solution buffered with a calcium ionophore (not shown but similar to Figure 1a). The apparent off rate is very slow at high calcium levels, but between 300 and 30 nM it increases rapidly, approaching the maximum rate obtained in EDTA solutions. The underlying coupled system is complex. However, it is convenient to initially treat the extreme cases represented by binding in high Ca2+ and release in EDTA.
Because for both eNOS and nNOS in high Ca2+ the on rate k1 is much faster than the off rate k2the observed on rate (k1+k2)~k1 as in Figure 1a. The Ca2+ dependence of the on reactions is indistinguishable for eNOS and nNOS. At 10 µM Ca2+, the association kinetics in 100 nM eNOS (this is the dimer concentration based on a heme concentration of 200 nM) can be fit with two pseudo first order components. The majority component represents rapid binding with a pseudo first order rate constant of ~0.055 M−1sec−1, in good agreement with the data of figure 1 because the concentration is ten times as high in the Ca2+ titration experiment. The slower component, with an apparent rate constant of ~0.005 M−1sec−1, accounts for around 30% of the amplitude in these experiments and is probably not physiologically relevant. It may be due to damaged protein molecules or ligand bound to the surface in hindered orientations, but the most likely explanation is aggregation.
No binding of eNOS or nNOS to CaM can be observed in EDTA. Defining k8 as the off rate constant for calcium-free CaM and k7 the on rate constant in the presence of EDTA (Fig. 1d), k8≫k7. The observed off rate constant is thus ~k8. The dissociation in EDTA can also be fit to two components. The majority component is more rapid, with an apparent rate constant of 0.11 M−1sec−1. Because this reaction is first order and much faster than the rate of binding in low calcium solutions, we assign this as the true value of k8. The minority component is very slow. The rapid component accounts for >90% of the release if the binding phase is limited to five minutes or less, but after ten minutes of binding and ten minutes of dissociation in a calcium buffered solution the slow phase accounts for a significant fraction of the release. We attribute this phase to partially denatured protein. The slow component might involve conversion of the secondary state to the initial state in the presence of EDTA rather than direct release.
Release of eNOS and nNOS in Ca2+ buffered solutions is more complex. We initially expected to observe irreversible pseudo first order kinetics for complex dissociation, because very little protein is released into the Ca2+ buffer well. However, it is clear that the reaction does not approach completion unless the binding phase is limited and dissociation takes place at low levels of Ca2+. The dissociation data can be fit as a reversible reaction (not shown), but the rate constants then do not match the on and off rate constants obtained from the association phase of the experiment. This strongly suggests that the slow phase of association represents the slow conversion of the initial complex to a secondary complex with a very slow back reaction rate, which pulls the equilibrium toward complex formation.
In addition, at all but the lowest calcium concentrations the apparent rate of dissociation is too slow to account for the calculated equilibria for association by a simple binding/release mechanism, even when calcium equilibria are considered. A reasonable fit to the binding and release data at any calcium concentration can be obtained by inclusion of an additional conformational step after binding with no biosensor report (or a small report).
An example of such a fit is shown for the 10 µM Ca2+ (top trace) in the nNOS binding experiment in figure 3B; association in 200 µM (100 µM in dimer units) nNOS and dissociation in buffer and calcium have been fit with the same four rate constants using a numerical solution to the differential equations. The rapid phase, with forward and reverse rate constants k1 and k2, determines the physiological time course of activation and the effective Kd (k2/k1).
The slow phase, with forward and reverse rate constants k3 and k4, represents modification in the complex after association (see figure 1D). The small rapid dissociation phase observed for the nNOS/CaM complex at 10 µM Ca2+ represents the fraction of the complex still in the initial bound state after 15 minutes of association. This decays using a branched pathway by release of NOS and by conversion to the modified state; the slow release of NOS reflects the back reaction from this modified state. The rapid nature of this dissociation is well reproduced in the simulation shown. The slow off rate is also used in the second phase of binding. It is clear that the A+B→C→D model used here represents a reasonable picture of nNOS binding, although formation of other states is likely.
In particular, it is clear that although some denaturation of nNOS (or eNOS) occurs over the course of these experiments (~40 minutes at 25° C), 50–80% of the complex rapidly dissociates in EDTA either immediately (not shown) or following the slow dissociation of 5–10% of the complex in calcium solution. Typically about 25% of the total has been modified to dissociate slowly even in EDTA. In experiments in which only 10 sec of binding was allowed (not shown) EDTA dissociation was nearly complete and a much larger rapid phase of release into Ca2+ buffer was present, confirming that k2 and k3 are comparable in rate.
This model also gives a reasonable picture of eNOS binding and dissociation at 10µM, although the fit is not quite as good. We attribute this to the fact that eNOS is a less sturdy enzyme than nNOS, and eNOS is likely to be less conformationally stable during the experiment. However, similarities in the overall behavior of the two proteins are obvious from a comparison of figures 3A and 3B. Our ability to model the binding and release at high calcium using essentially the same rate constants we used to fit the fast and slow phases of binding with a double exponential model gives us confidence that fast phase rate constants represent physiologically important parameters. Constants determined from simulations are shown in Table 1.
Table I.
Rate constants for CaM-NOS interactions (see schema in fig 1D). Value for k1 assumes both components are free in solution; for immobilized CaM the value is about 0.5×10⁶ M−1sec−1. Rapid reaction parameters k1, k2 and k8 are accurate to within 10%, but other parameters are model dependent and are accurate to within a factor of 2; slow reactions are too slow to be estimated by these methods. The three rapid parameters are likely to be physiologically relevant.
| k1 | k2 | k3 | k4 | k5 | k6 | k7 | k8 | k9 | k10 | |
|---|---|---|---|---|---|---|---|---|---|---|
| eNOS | 1.3x10⁶ M−1sec−1 | 0.01 sec−1 | 0.005 sec−1 | .00005 sec−1 | slow | slow | slow | 0.11 sec−1 | slow | 10−6 sec−1 |
| nNOS | 1.25x10⁶ M−1sec−1 | 0.01 sec−1 | 0.003 sec−1 | .00005 sec−1 | slow | slow | slow | 0.11 sec−1 | slow | 10−6 sec−1 |
The dissociation phase at saturating Ca2+ concentrations can be fit by varying only the four rate constants governing NOS binding and release. The amplitude of the rapid binding phase is ~k1/(k1+k2), and kobs for the rapid phase is k1+k2. Similar rates for the rapid phase were obtained using sequential and parallel models for the slow phase, giving us confidence that the most important rate constants are reliable.
The A+B→C→D model produces reasonable global fits for experiments at saturating calcium in which ligand is varied (e.g., as in figure 1), and can account for both the binding phase and dissociation in calcium and in EDTA. The calcium dependence is more difficult to model, because of the presence of many states that cannot be independently observed. In particular, it is difficult to fit both the binding and release phases. Since the slow phases are likely an artifact, we have limited our analysis here to the calcium dependence of the rapid phases.
Calcium binding and coupled equilibria
The binding of Ca2+ to CaM has been modeled using cooperativity between EF hands in the N and C termini. In general, the models describe data showing the binding of 3 Ca2+ ions with µM affinity and the binding of a fourth ion with a few times higher Kd. Due to the nature of our data, we are less concerned with the details of Ca+2 binding to individual EF hands, which we can’t resolve. Fortunately, our analysis and conclusions do not critically depend on the details of cooperative Ca2+ binding to free CaM.
Consider a system in which binding of ligand X to component A produces an AX complex that binds to component B. This system can be described thermodynamically by three dissociation constants, KXA, KBAX, KXAB, and KAB, which describe the dissociation of complex AX, of B from complex BAX, of X from complex BAX, and of complex AB. Conservation of energy requires that KXAKBAX = KXABKAB. The equilibrium binding of X to the AB complex is thus coupled to the equilibria for AB association. This pattern holds for the slightly more complex case in which Ca2+ saturated CaM binds to a target site.
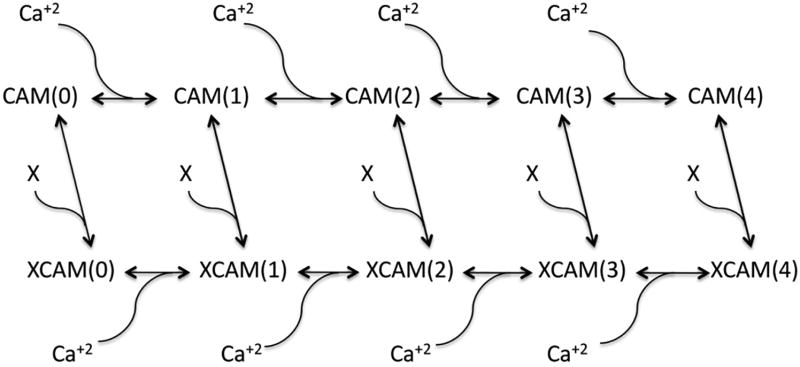
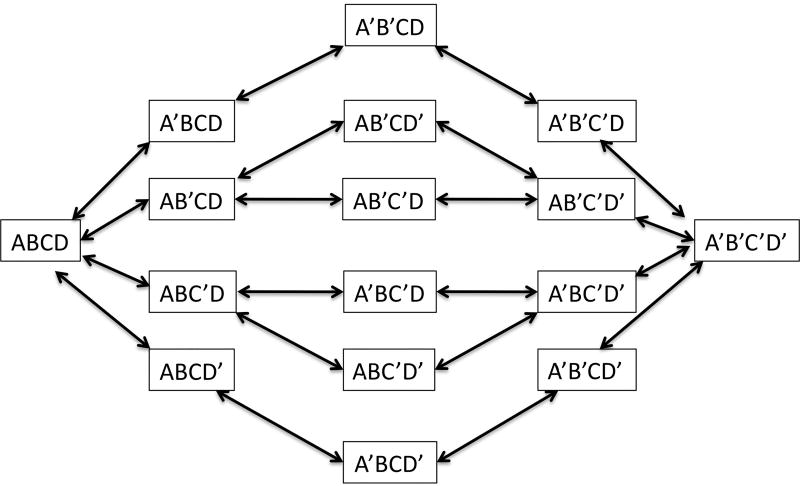
Figure 4A shows a scheme in which free CaM associates with Ca+2 to form states with 0–4 Ca+2 per CaM molecule; each of these states has sub-states in which different EF hands are occupied. Each free CaM state has a characteristic on rate for its target peptide X which is a function of the on rates for target binding to these sub-states; each bound CaM state has a characteristic off rate from its target peptide which is a function of the sub-state off rates. Each of the free CaM states has a corresponding state associated with the target peptide X. The sub-state occupancy tree for free CaM is shown in figure 4B. Primed letters A-D represent EF hands binding Ca2+.
Figure 4. Calcium binding states and state occupancy tree.
(A) States of calmodulin labeled with number of bound Ca2+ ions with and without calmodulin binding peptide X. X binds with increased affinity as the number of Ca2+ ions bound increases; equivalently, states with X bound have a higher affinity for Ca2+. (B) State occupancy tree for Ca2+ on CaM showing occupied EF hands as primed; the number of states follows the 1:4:6:4:1 binomial coefficient progression. The five columns correspond to the five possible occupancy numbers (0–4) for CaM.
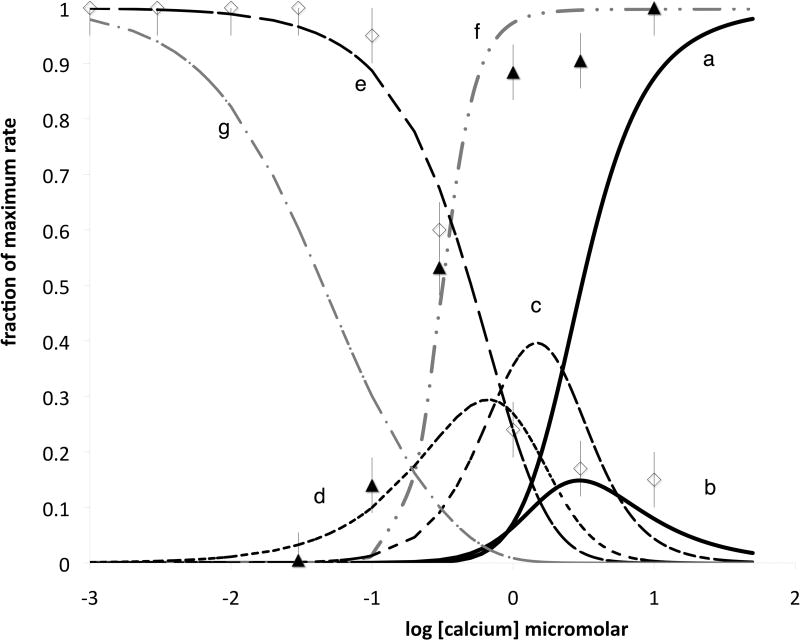
The two right hand solid black traces in Figure 5 show the dependence of the fraction of free CaM with three (trace b) and four (trace a) Ca2+ bound as a function of Ca2+; the three Ca2+ trace is the bell shaped transient. The other black bell-shaped transients show the dependence of the fraction of the one and two Ca2+ states (traces d and c, respectively) of free CaM on the Ca2+ concentration, while the black dashed decreasing sigmoid (trace e) represents the free empty CaM.
Figure 5. Ca2+ depedence of eNOS binding and dissociation.
Open diamonds represent dissociation rate constants estimated from binding phases; closed triangles are association rate constants, both as a fraction of maximum rate. The two solid black lines are fractional population for free CaM 4 Ca2+ (a) and free 3 Ca2+ (b) corresponding respectively to the right hand state in figure 4B and the four states second from the right. The next two transients in black moving left are the 2 (c) and 1 (d) Ca2+ states, and the empty state is the dashed black sigmoidal curve (e). The grey sigmoid (f) represents the calcium replete state in the presence of X (the unoccupied calmodulin target) at 104 its Kd in excess calcium; the sigmoidal curve on the far left (g) is the empty state (no Ca2+ or target) under the same conditions.
Because CaM binds with high affinity only when Ca2+ is bound to multiple EF hands, binding to the target shifts the equilibrium titration. Trace g represents the decrease of the empty state in the presence of target as described in the legend. Trace f represents Ca2+ replete, target associated CaM; binding to the target imposes effective cooperativity on the system.
Plotted with these traces are the on rate constants (black triangles) and off rate constants (open diamonds) extracted from the rapid component data as a function of Ca2+. The on rate rises as soon as free CaM begins to bind Ca2+, and is half maximal at about 300 nM. The off rate is high at low calcium, and falls steeply in the same region. It is of interest that both the on and off rates are most dependent on Ca2+ about one order of magnitude below the concentration at which free CaM binds calcium.
Figure 6 shows traces of the binding of eNOS phosphorylated by PKC at T495, adjacent to the CaM binding site, to immobilized CaM. Longer incubation with PKC produced slower binding, indicating that phosphorylation was progressive and not complete, as confirmed by Western blots with phosphospecific antibodies. Because eNOS was damaged in control experiments at longer incubations, we incubated for one hour at room temperature, which appeared to phosphorylate 30–60% of the enzyme based on simulation of kinetics (see Discussion). Binding of eNOS incubated with AKT and PKA, which phosphorylate residues distant from the CaM binding site and result in activation of eNOS, was indistinguishable from no ATP controls.
The PKC trace obtained in these experiments are indistinguishable from traces obtained with lower concentrations of unphosphorylated eNOS. It is clear that phosphorylation results in much weaker and slower binding of eNOS to CaM. We are observing the residual unphosphorylated eNOS in these experiments, and T495 phosphorylated enzyme binding is too weak to allow observation of any component against this background.
Attempts to observe effects on binding to CaM of phosphorylation at positions that activate eNOS did not produce significant effects. At least in part, this is likely due to the fact that binding is diffusion limited; it can be slowed by inhibitors but not facilitated by activators.
Discussion
The binding of CaM to eNOS and nNOS occurs at similar rates. In experiments in which CaM is immobilized and eNOS or nNOS is the mobile component, the diffusion of the NOS isoforms should vary approximately with the cube root of the molecular weight. This would give rise to a ~7% difference between isoforms in the first order rate constant, well within the error of the experiments and the effects of secondary factors (site geometry, local charge arrays).
With CaM as the mobile species, the diffusion, and hence binding, is more rapid and even the 7% factor is removed. The rate constant for CaM binding in this situation is ~106 M−1sec−1. This situation corresponds to physiological systems with immobilized NOS. For ideal systems with both components free, the diffusion controlled reaction rate is determined by the sum of the diffusion constants, and hence the rate is the sum of the rates obtained in the two cases when only one component is mobile. When both NOS and CaM are free, the forward rate constant should thus be the sum of our measured rate constants, or ~1.3×10⁶M−1sec−1.
In previous stopped flow experiments designed to investigate pulse activation of nNOS (34, 35) 100 µM CaM was used to activate nNOS catalysis. The results suggested that a lag due to activation was present, and this was manifested in a slower apparent electron transfer rate for the initial CaM activated electron transfer reaction (e.g., about 45 sec−1 vs. 70 sec−1 for subsequent electron transfer steps at 37°C). From results presented in this paper, we estimate the diffusion controlled reaction rate for CaM binding under these conditions as ~130 M−1sec−1. Thus, the rate of association of CaM accounts very well for the difference, since (1/130+1/70)~1/45~0.022. This indicates that at 37° C activation follows CaM binding to nNOS within milliseconds.
The Ca2+ dependence of the kinetics of formation and dissociation of a CaM-target complex in which the target binds only to Ca2+-saturated or partially saturated CaM are complex. The coupled equilibria depicted in Figure 4 result in a low apparent Kd for Ca2+ driven by the higher affinity of Ca2+-saturated CaM for the target. This is easy to understand as an equilibrium, and it is also easy to understand the calcium dependence of the release of CaM from NOS, since the rate of CaM release from complexes becomes faster as calcium is removed.
The increase in the binding rate with Ca2+ is less intuitive. Clearly, at high Ca2+ we observe the binding of eNOS to Ca+2 replete CaM, and at low Ca2+ no binding is observed. It is clear that between 1 and 10 µM Ca2+ a modest change in the forward rate takes place in the regime where free CaM undergoes Ca2+ binding and release. Most of the apparent change in rate takes place at much lower concentrations, in a concentration regime where neither of the reactants (free CaM and NOS) bind Ca2+. The resolution of this apparent paradox is that at intermediate [Ca2+] we only observe an apparent forward rate constant. The rate of binding for CaM with zero or one calcium atoms bound appears to be significant, but is not directly observed because the rate of release is very high and the overall affinity low, as shown in Ca+2 titrations. The rate of Ca2+ uptake by transiently bound CaM is high near or above the Kds for the EF hands. The rate of Ca+2 uptake for bound CaM above 300 nM Ca+2 is high enough to produce a nearly optimal rate of CaM binding. The modest increase in rate observed above 1 µM Ca2+ can be attributed to reaction of NOS with Ca2+-replete free CaM in solution; the increased level of Ca+2 removes empty CaM from the equilibrium and probably slightly increases the on rate via geometrical factors.
The increased affinity of bound CaM for Ca2+ is driven by the high affinity of eNOS and nNOS for Ca2+-replete CaM and their negligible (here unobservable) affinity for apocalmodulin. NOS variants with reduced requirements for Ca+2 hence must bind Ca2+ replete CaM with higher affinity. Claims that a modified enzyme has a lower requirements for Ca+2 but unaltered affinity for CaM are almost certainly the result of experimental artifacts in CaM titration, the most common problem being titration of enzyme activity or binding in a regime in which binding is essentially stoichiometric because of the high affinity of the enzymes for Ca2+-replete CaM. However, it is possible to change the calcium requirements for activation independent of the binding requirement if partially Ca+2 replete CaM binds without activation (31). We intend to investigate this possibility in subsequent studies.
Phosphorylation of T495 greatly reduces or eliminates the ability of eNOS to bind CaM even in high Ca2+ solutions. The fastest rate compatible with all the data obtained from PKC phosphorylated eNOS is about 25% of the rate of unmodified enzyme, and this would require that nearly all the enzyme is phosphorylated. It is likely that we observe the binding of the remaining unphosphorylated enzyme. This is consistent with experiments with phosphomimetics (31) and with the effect of phosphorylation on activity (36). We attribute this to the interaction of the negative charge with negative charges on CaM and with positive charges in the CaM binding site, and the observation is consistent with less quantitative measurements of CaM binding by phosphomimetic T495D (or equivalently T497D in bovine eNOS) mutants.
Initial attempts to observe enhanced CaM binding by phosphorylation of S617, S633 and S1179 were unsuccessful. Negative results are generally less convincing than positive results, but in this case there are good reasons for them. Since we show here that CaM binding is diffusion limited, it may not be possible to significantly speed up the forward reaction; indeed, this could only be done by improving the orientation effects of the charge array directly associated with the CaM binding site, and this appears to be highly optimized already. It is of course possible to increase the affinity of the site for CaM by slowing down the off rate, but since this is already slow it is hard to see what advantage this would have in activation. We hope to investigate other aspects of mutational effects on CaM binding and activation in subsequent communications.
We hope to extend these experiments using NOS mutants to examine the roles of NOS control elements in binding and activation. Use of CaM constructs should allow us to investigate the participation of individual EF hands in binding, and to compare binding to activation.
Materials and Methods
Nitric oxide synthases were expressed in BL21 E. coli cells using the pCWori+ vector as previously described. (37, 38). The expression system used the GROELS vector to provide additional chaperones. Just before induction, the medium was enriched by addition of ATP, aminolevulinic acid, and riboflavin.
eNOS and nNOS were purified as previously described using affinity chromatography (38, 39). Heme and flavin content was estimated spectrophotometrically, and activity was assayed by following NADPH consumption at 340 nm (38, 39).
CaM was purchased from Sigma (St. Louis, MO, USA). The calcium buffers Indo-1 and Quin-2 were purchased from Molecular Probes/Invitrogen (Carlsbad, CA, USA). Akt1 and PKA C-alpha Kinases were from Cell Signaling and PKC was from Promega (Madison, WI, USA). eNOS antibodies (phospho-Thr495, phospho-Ser1177, and eNOS (49G3)) were all from Cell Signaling Technology (Danvers, MA, USA). All other reagents were high purity commercial products.
Calcium buffers were prepared by addition of CaCl2 to solutions of Indo-1 or Quin-2. The relationship between the total concentration of calcium and the free concentration is given by
where y is the concentration of the calcium ionophore (calcium buffer), and k is the Kd for calcium. For y/k>>1 this provides a calcium reservoir for low free calcium concentrations. The effective Kd values are dependent on competing cations. Free calcium concentrations were calculated using the Kd values provided (60 nM for Quin-2, 0.23 mM for Indo-2), and the systems were calibrated by titrating 100 µM solutions of the ionophores.
All biolayer interferometry (BLI) measurements were made on a FortéBio (Menlo Park, CA, USA) Octet QK biosensor using streptavidin (“SA”) sensors. Assays were performed in 96-well microplates at 25 °C. All volumes were 200 µL. CaM was biotinylated using NHS-LC-LC-biotin (succinimidyl-6-[biotinamido]-6-hexanamidohexanoate) (Thermo Scientific, Rockford IL, USA) at a 5:1 molar ratio of biotin to protein for 30 min at 25° followed by rapid exchange into PBS-T (10 mM phosphate buffer, pH 7.4, 150 mM NaCl, 0.01% Tween-20) by passage over a desalting column. Conditions were chosen according to the manufacturer so that each protein was likely randomly biotinylated at an average of 1-2 positions. After loading biotinylated CaM (BT-CaM) onto SA sensors, a baseline was established in NOS buffer (50mM phosphate at pH 7.5, 50 mM NaCl, 10% glycerol) prior to association at varying analyte concentrations. Dissociation was subsequently measured in buffer only or buffer with 1 mM EDTA.
To control for attachment artifacts and artifacts related to biotinylation, reversal experiments were performed essentially as above except that eNOS was used as biotinylated ligand and free CaM as analyte.
PKC kinase reactions were done in 15 µl reactions containing 0.2 mg/ml phosphatidylserine, 20 mM Hepes (pH 7.4), 1.3 mM CaCl21 mM DTT, 10 mM MgCl21 mM ATP, and ~ 6 µM eNOS buffer. Reactions were done plus or minus PKC (0.01 µM) at room temperature and were ‘stopped’ after one hour by a 13 fold dilution into association buffer. Initial timecourse experiments showed increased phosphorylation between twenty and ninety minutes. 60 minutes was chosen to balance phosphorylation with maintenance of eNOS integrity. Control reactions without ATP were performed in parallel.
AKT and PKA reactions were done essentially as above except that 1× kinase buffer (Cell Signaling Technology) was used with 0.2 mM ATP and 0.20 µM AKT or 0.25 µM PKA.
Western blot analysis was done using antibodies from Cell Signaling according to the manufacturer’s recommendations. Reactions were diluted into the range of 1–2 pmoles of eNOS before loading.
Kinetics were modeled using summed exponentials or by numerically solving standard series of differential equations. Where A represents the empty immobilized ligand, B the initial ligand-analyte complex, and C the slow state and the other parameters are pseudo first order rate constants this becomes:
In EDTA the corresponding equations are:
Supplementary Material
Supplementary Figure 1: Time course of eNOS detachment from CaM after transfer of sensor to solution containing EGTA (black) or EDTA (blue). Amplitude of EDTA trace was slighty adjusted (reduced by 10%) to make it easier to compare the time course; this adjustment was necessary because of variations in the amount of CaM crosslinked to the sensors. There is no difference in the time course or extent of dissociation in EGTA and EDTA.
Supplementary Figure 2: Comparison of CaM dependent and non-specific binding of eNOS to biosensor surfaces. Non specific binding at 3.3 nM eNOS to undecorated surfaces is 5–10% of the CaM dependent binding and is not reversible with EDTA. Binding of eNOS at low concentrations (here 0.37 nM) is essentially fully reversible with EDTA and hence cannot include a detectable non-specific component.
Acknowledgments
This work was supported by NIH 1R15GM083317-01, 3R15GM083317-01S2 and 3R15GM080701-01,NSF 0950920, and Research Corporation (CC6942). The authors thank Raj Razdan for expert technical assistance.
Abbreviations used
- AKT
RAC-alpha serine/threonine-protein kinase
- BT-CaM
biotinylated calmodulin
- BT-NOS
biotinylated eNOS
- CaM
calmodulin
- eNOS
endothelial nitric oxide synthase
- NOS
nitric oxide synthase
- nNOS
neuronal nitric oxide synthase
- PBS-T
phosphate buffer saline-Tween-20 (see materials and methods)
- PKA
protein kinase A
- PKC
protein kinase C
- BLI
Biolayer Interferometry
Footnotes
Enzymes: NOS, 1.14.13.39, PKA, 2.7.11.11; PKC, 2.7.11.13; AKT, 2.7.11.1
References
- 1.Busse R, Mulsch A. Calcium-dependent nitric oxide synthesis in endothelial cytosol is mediated by calmodulin. FEBS letters. 1990;265:133–136. doi: 10.1016/0014-5793(90)80902-u. [DOI] [PubMed] [Google Scholar]
- 2.Ignarro LJ, Buga GM, Byrns RE, Wood KS, Chaudhuri G. Endothelium-derived relaxing factor and nitric oxide possess identical pharmacologic properties as relaxants of bovine arterial and venous smooth muscle. The Journal of pharmacology and experimental therapeutics. 1988;246:218–226. [PubMed] [Google Scholar]
- 3.Palmer RM, Ferrige AG, Moncada S. Nitric oxide release accounts for the biological activity of endothelium-derived relaxing factor. Nature. 1987;327:524–526. doi: 10.1038/327524a0. [DOI] [PubMed] [Google Scholar]
- 4.Pipili-Synetos E, Sakkoula E, Maragoudakis ME. Nitric oxide is involved in the regulation of angiogenesis. British journal of pharmacology. 1993;108:855–857. doi: 10.1111/j.1476-5381.1993.tb13476.x. [DOI] [PMC free article] [PubMed] [Google Scholar]
- 5.Silvagno F, Xia H, Bredt DS. Neuronal nitric-oxide synthase-mu, an alternatively spliced isoform expressed in differentiated skeletal muscle. The Journal of biological chemistry. 1996;271:11204–11208. doi: 10.1074/jbc.271.19.11204. [DOI] [PubMed] [Google Scholar]
- 6.Southern C, Schulster D, Green IC. Inhibition of insulin secretion by interleukin-1 beta and tumour necrosis factor-alpha via an L-arginine-dependent nitric oxide generating mechanism. FEBS letters. 1990;276:42–44. doi: 10.1016/0014-5793(90)80502-a. [DOI] [PubMed] [Google Scholar]
- 7.Abu-Soud HM, Stuehr DJ. Nitric oxide synthases reveal a role for calmodulin in controlling electron transfer. Proceedings of the National Academy of Sciences of the United States of America. 1993;90:10769–10772. doi: 10.1073/pnas.90.22.10769. [DOI] [PMC free article] [PubMed] [Google Scholar]
- 8.Bredt DS, Hwang PM, Glatt CE, Lowenstein C, Reed RR, Snyder SH. Cloned and expressed nitric oxide synthase structurally resembles cytochrome P-450 reductase. Nature. 1991;351:714–718. doi: 10.1038/351714a0. [DOI] [PubMed] [Google Scholar]
- 9.Tran QK, Leonard J, Black DJ, Nadeau OW, Boulatnikov IG, Persechini A. Effects of combined phosphorylation at Ser-617 and Ser-1179 in endothelial nitric-oxide synthase on EC50(Ca2+) values for calmodulin binding and enzyme activation. The Journal of biological chemistry. 2009;284:11892–11899. doi: 10.1074/jbc.M806205200. [DOI] [PMC free article] [PubMed] [Google Scholar]
- 10.Tran QK, Leonard J, Black DJ, Persechini A. Phosphorylation within an autoinhibitory domain in endothelial nitric oxide synthase reduces the Ca(2+) concentrations required for calmodulin to bind and activate the enzyme. Biochemistry. 2008;47:7557–7566. doi: 10.1021/bi8003186. [DOI] [PMC free article] [PubMed] [Google Scholar]
- 11.Sessa WC. Regulation of endothelial derived nitric oxide in health and disease. Mem Inst Oswaldo Cruz. 2005;100(Suppl 1):15–18. doi: 10.1590/s0074-02762005000900004. [DOI] [PubMed] [Google Scholar]
- 12.Greif DM, Kou R, Michel T. Site-specific dephosphorylation of endothelial nitric oxide synthase by protein phosphatase 2A: evidence for crosstalk between phosphorylation sites. Biochemistry. 2002;41:15845–15853. doi: 10.1021/bi026732g. [DOI] [PubMed] [Google Scholar]
- 13.Michell BJ, Harris MB, Chen ZP, Ju H, Venema VJ, Blackstone MA, Huang W, Venema RC, Kemp BE. Identification of regulatory sites of phosphorylation of the bovine endothelial nitric-oxide synthase at serine 617 and serine 635. The Journal of biological chemistry. 2002;277:42344–42351. doi: 10.1074/jbc.M205144200. [DOI] [PubMed] [Google Scholar]
- 14.Salerno JC, Harris DE, Irizarry K, Patel B, Morales AJ, Smith SM, Martasek P, Roman LJ, Masters BS, Jones CL, Weissman BA, Lane P, Liu Q, Gross SS. An autoinhibitory control element defines calcium-regulated isoforms of nitric oxide synthase. J Biol Chem. 1997;272:29769–29777. doi: 10.1074/jbc.272.47.29769. [DOI] [PubMed] [Google Scholar]
- 15.Roman LJ, Masters BS. Electron transfer by neuronal nitric-oxide synthase is regulated by concerted interaction of calmodulin and two intrinsic regulatory elements. J Biol Chem. 2006;281:23111–23118. doi: 10.1074/jbc.M603671200. [DOI] [PubMed] [Google Scholar]
- 16.Nishida CR, Ortiz de Montellano PR. Autoinhibition of endothelial nitric-oxide synthase. Identification of an electron transfer control element. J Biol Chem. 1999;274:14692–14698. doi: 10.1074/jbc.274.21.14692. [DOI] [PubMed] [Google Scholar]
- 17.Friedberg F. Centrin isoforms in mammals. Relation to calmodulin. Mol Biol Rep. 2006;33:243–252. doi: 10.1007/s11033-006-9004-z. [DOI] [PubMed] [Google Scholar]
- 18.Zhu MX. Multiple roles of calmodulin and other Ca(2+)-binding proteins in the functional regulation of TRP channels. Pflugers Arch. 2005;451:105–115. doi: 10.1007/s00424-005-1427-1. [DOI] [PubMed] [Google Scholar]
- 19.Friedberg F, Rhoads AR. Evolutionary aspects of calmodulin. IUBMB Life. 2001;51:215–221. doi: 10.1080/152165401753311753. [DOI] [PubMed] [Google Scholar]
- 20.Persechini A, Moncrief ND, Kretsinger RH. The EF-hand family of calcium-modulated proteins. Trends Neurosci. 1989;12:462–467. doi: 10.1016/0166-2236(89)90097-0. [DOI] [PubMed] [Google Scholar]
- 21.Haeseleer F, Imanishi Y, Sokal I, Filipek S, Palczewski K. Calcium-binding proteins: intracellular sensors from the calmodulin superfamily. Biochem Biophys Res Commun. 2002;290:615–623. doi: 10.1006/bbrc.2001.6228. [DOI] [PubMed] [Google Scholar]
- 22.Rhoads AR, Friedberg F. Sequence motifs for calmodulin recognition. FASEB J. 1997;11:331–340. doi: 10.1096/fasebj.11.5.9141499. [DOI] [PubMed] [Google Scholar]
- 23.Cho HJ, Xie QW, Calaycay J, Mumford RA, Swiderek KM, Lee TD, Nathan C. Calmodulin is a subunit of nitric oxide synthase from macrophages. J Exp Med. 1992;176:599–604. doi: 10.1084/jem.176.2.599. [DOI] [PMC free article] [PubMed] [Google Scholar]
- 24.Schmidt HH, Pollock JS, Nakane M, Forstermann U, Murad F. Ca2+/calmodulin-regulated nitric oxide synthases. Cell Calcium. 1992;13:427–434. doi: 10.1016/0143-4160(92)90055-w. [DOI] [PubMed] [Google Scholar]
- 25.Stuehr DJ, Abu-Soud HM, Rousseau DL, Feldman PL, Wang J. Control of electron transfer in neuronal nitric oxide synthase by calmodulin, substrate, substrate analogs, and nitric oxide. Adv Pharmacol. 1995;34:207–213. doi: 10.1016/s1054-3589(08)61087-x. [DOI] [PubMed] [Google Scholar]
- 26.Persechini A, White HD, Gansz KJ. Different mechanisms for Ca2+ dissociation from complexes of calmodulin with nitric oxide synthase or myosin light chain kinase. The Journal of biological chemistry. 1996;271:62–67. doi: 10.1074/jbc.271.1.62. [DOI] [PubMed] [Google Scholar]
- 27.Zhang M, Vogel HJ. Characterization of the calmodulin-binding domain of rat cerebellar nitric oxide synthase. J Biol Chem. 1994;269:981–985. [PubMed] [Google Scholar]
- 28.Guan ZW, Haque MM, Wei CC, Garcin ED, Getzoff ED, Stuehr DJ. Lys842 in neuronal nitric-oxide synthase enables the autoinhibitory insert to antagonize calmodulin binding, increase FMN shielding, and suppress interflavin electron transfer. J Biol Chem. 2010;285:3064–3075. doi: 10.1074/jbc.M109.000810. [DOI] [PMC free article] [PubMed] [Google Scholar]
- 29.Gao S, Chen J, Brodsky SV, Huang H, Adler S, Lee JH, Dhadwal N, Cohen-Gould L, Gross SS, Goligorsky MS. Docking of endothelial nitric oxide synthase (eNOS) to the mitochondrial outer membrane: a pentabasic amino acid sequence in the autoinhibitory domain of eNOS targets a proteinase K-cleavable peptide on the cytoplasmic face of mitochondria. J Biol Chem. 2004;279:15968–15974. doi: 10.1074/jbc.M308504200. [DOI] [PubMed] [Google Scholar]
- 30.Lane P, Gross SS. Disabling a C-terminal autoinhibitory control element in endothelial nitric-oxide synthase by phosphorylation provides a molecular explanation for activation of vascular NO synthesis by diverse physiological stimuli. J Biol Chem. 2002;277:19087–19094. doi: 10.1074/jbc.M200258200. [DOI] [PubMed] [Google Scholar]
- 31.Lin MI, Fulton D, Babbitt R, Fleming I, Busse R, Pritchard KA, Jr, Sessa WC. Phosphorylation of threonine 497 in endothelial nitric-oxide synthase coordinates the coupling of L-arginine metabolism to efficient nitric oxide production. The Journal of biological chemistry. 2003;278:44719–44726. doi: 10.1074/jbc.M302836200. [DOI] [PubMed] [Google Scholar]
- 32.Michell BJ, Chen Z, Tiganis T, Stapleton D, Katsis F, Power DA, Sim AT, Kemp BE. Coordinated control of endothelial nitric-oxide synthase phosphorylation by protein kinase C and the cAMP-dependent protein kinase. The Journal of biological chemistry. 2001;276:17625–17628. doi: 10.1074/jbc.C100122200. [DOI] [PubMed] [Google Scholar]
- 33.Abdiche Y, Malashock D, Pinkerton A, Pons J. Determining kinetics and affinities of protein interactions using a parallel real-time label-free biosensor, the Octet. Anal. Biochem. 2008;377(2):209–217. doi: 10.1016/j.ab.2008.03.035. [DOI] [PubMed] [Google Scholar]
- 34.Salerno JC. Neuronal nitric oxide synthase: prototype for pulsed enzymology. FEBS Lett. 2008;582:1395–1399. doi: 10.1016/j.febslet.2008.03.051. [DOI] [PubMed] [Google Scholar]
- 35.Salerno JC, Ghosh DK. Space, time and nitric oxide--neuronal nitric oxide synthase generates signal pulses. Febs J. 2009;276:6677–6688. doi: 10.1111/j.1742-4658.2009.07382.x. [DOI] [PubMed] [Google Scholar]
- 36.Matsubara M, Hayashi N, Jing T, Titani K. Regulation of endothelial nitric oxide synthase by protein kinase C. J Biochem. 2003;133:773–781. doi: 10.1093/jb/mvg099. [DOI] [PubMed] [Google Scholar]
- 37.Gerber NC, Ortiz de Montellano PR. Neuronal nitric oxide synthase. Expression in Escherichia coli, irreversible inhibition by phenyldiazene, and active site topology. J Biol Chem. 1995;270:17791–17796. doi: 10.1074/jbc.270.30.17791. [DOI] [PubMed] [Google Scholar]
- 38.Roman LJ, Sheta EA, Martasek P, Gross SS, Liu Q, Masters BS. High-level expression of functional rat neuronal nitric oxide synthase in Escherichia coli. Proc Natl Acad Sci U S A. 1995;92:8428–8432. doi: 10.1073/pnas.92.18.8428. [DOI] [PMC free article] [PubMed] [Google Scholar]
- 39.Martasek P, Liu Q, Liu J, Roman LJ, Gross SS, Sessa WC, Masters BS. Characterization of bovine endothelial nitric oxide synthase expressed in E. coli. Biochem Biophys Res Commun. 1996;219:359–365. doi: 10.1006/bbrc.1996.0238. [DOI] [PubMed] [Google Scholar]
Associated Data
This section collects any data citations, data availability statements, or supplementary materials included in this article.
Supplementary Materials
Supplementary Figure 1: Time course of eNOS detachment from CaM after transfer of sensor to solution containing EGTA (black) or EDTA (blue). Amplitude of EDTA trace was slighty adjusted (reduced by 10%) to make it easier to compare the time course; this adjustment was necessary because of variations in the amount of CaM crosslinked to the sensors. There is no difference in the time course or extent of dissociation in EGTA and EDTA.
Supplementary Figure 2: Comparison of CaM dependent and non-specific binding of eNOS to biosensor surfaces. Non specific binding at 3.3 nM eNOS to undecorated surfaces is 5–10% of the CaM dependent binding and is not reversible with EDTA. Binding of eNOS at low concentrations (here 0.37 nM) is essentially fully reversible with EDTA and hence cannot include a detectable non-specific component.


